DOI:10.28974/idojaras.2018.4.5
IDŐJÁRÁS
Quarterly Journal of the Hungarian Meteorological Service Vol. 122, No. 4, October – December, 2018, pp. 433–452
Analysis of extreme precipitation over the Peripannonian region of Bosnia Hercegovina
Tatjana Popov*, Slobodan Gnjato, and Goran Trbić
University of Banja Luka,
Faculty of Natural Sciences and Mathematics, Department of Geography,
Mladena Stojanovića 2, 78000 Banja Luka, Republic of Srpska, Bosnia and Herzegovina;
Corresponding author E-mail: tatjana.popov@pmf.unibl.org (Manuscript received in final form December 15, 2017)
Аbstract⎯Changes in extreme precipitation indices over the Peripannonian region of Bosnia and Herzegovina were examined. Data on daily precipitation during the period 1961–2016 from four meteorological stations were used for the calculation of 13 indices recommended by the Expert Team on Climate Change Detection and Indices (ETCCDI) for the climate change assessment. The precipitation change assessment covered trend analysis and analysis of changes in distribution. Determined patterns of change were neither spatially nor temporally coherent. The estimated trends in extreme precipitation indices were mixed in sign and mostly insignificant. Moreover, no significant changes in distribution of majority indices were determined. However, the upward trends in heavy precipitation indices RX1day, RX5day, R95p, and R99p indicate changes towards more intense precipitation. Understanding patterns of precipitation changes is of a great pertinence in many applied studies: flood risks management, agricultural planning, water resources management, environment conservation, etc.
Key-words: extreme precipitation indices, trend, probability density functions, generalized extreme value distribution, climate change, Peripannonian region (Bosnia and Herzegovina)
1. Introduction
Understanding changes in extreme precipitation events is of great importance in many applied studies due to their disproportionately strong impact on society and ecosystems compared to changes in mean precipitation (Hartmann et al.,
2013). Although studies around the world determined mixed-in-sign and mostly insignificant trends in mean precipitation (Hartmann et al., 2013), the precipitation averaged over the Northern Hemisphere mid-latitudes has increased since the middle of the 20th century (IPCC, 2014).
Global scale studies indicate that changes in precipitation extremes are in general consistent with a wetter climate (Alexander et al., 2006; Donat et al., 2013). Further, there are more regions in the world where heavy precipitation events increased than those where they decreased (IPCC, 2014). The substantial increase in annual heavy precipitation events was also found over many mid- latitude regions (Hartmann et al., 2013). Despite the general increase, trends observed around the world were less spatially coherent, a small scale and with a low level of statistical significance (Alexander et al., 2006; Kiktev et al., 2003).
Most of extreme precipitation indices displayed changes towards more intense precipitation over numerous world regions (Donat et al., 2013). On a global scale, annual maximum daily precipitation (RX1day) increased by 5.73 mm on average during the last 110 years (Asadieh and Krakauer, 2015).
The highest 5-day precipitation (RX5day) showed a general increase (although insignificant) over many world regions (Alexander et al., 2006; Kiktev et al., 2003). Globally averaged, the annual number of days with precipitation, i.e., wet days (R1mm), significantly increased (p<0.05) (Kiktev et al., 2003), whereas the annual number of very wet days (R10mm) displayed insignificant upward trends during the past 60 years (Alexander et al., 2006; Donat et al., 2013). In that period, the contribution from very wet days (R95p) also displayed an upward tendency (Donat et al., 2013). Wetter conditions also suggest a steady decline in the number of consecutive dry days (CDD) since the 1960s (Alexander et al., 2006; Frich et al., 2002). Alexander et al. (2006) determined changes in the distributions of all these indices in the last quarter of the 20th century compared to the period 1901–1950. The observed changes in distributions were also consistent with tendency towards wetter conditions.
Findings of these global scale studies (trends mixed in sign, mostly insignificant, and spatially incoherent) were confirmed by numerous regional and local studies all over the world − in America (Powell and Keim, 2015; Skansi et al., 2013), Asia (Tian et al., 2017; Sheikh, et al., 2015; Balling et al., 2016), Africa (Ongoma et al., 2016; Filahi et al., 2016), Australia (Alexander and Arblaster, 2017). Similar results were also obtained for Europe − at the continental level (Chen et al., 2015; Klein Tank and Können, 2003) and in its various regions – over the Iberian Peninsula (de Lima et al., 2015; Bartolomeu et al., 2016), Central and Western Europe (Łupikasza et al., 2011; Moberg and Jones, 2005), Carpathian Basin (Bartholy and Pongrácz, 2007), and Balcan Peninsula (Kioutsioukis et al., 2010). Studies detected the increase in frequency or intensity of heavy precipitation over the continent (Hartmann et al., 2013).
Continentally averaged, most of extreme precipitation indices (R95p, R95ptot, RX5day, R10mm, and R20mm) have increased significantly (only RX1day
displayed insignificant trend) since the middle of the 20th century (Klein-Tank and Können, 2003). However, the observed trends were not spatially coherent (Klein-Tank and Können, 2003). Significant upward tendency in RX5day and simple daily intensity index (SDII) was determined over much of Europe (Donat et al., 2013; Frich et al., 2002; Kiktev et al., 2003; Alexander et al., 2006).
Coherent patterns of positive change in R10mm were also determined (Frich et al., 2002). The central part of Europe was one of the world regions with major increases in the fraction of precipitation from events wetter than the 95th percentile (R95p%) (Frich et al., 2002). Shorter duration of dry spells was detected in many regions (Kiktev et al., 2003; Donat et al., 2013). Casanueva et al. (2014) found that trends in precipitation extremes were more significant than those in mean precipitation (especially for R95p). They stated that this is in agreement with the Clausius–Clapeyron relation that describes how a warmer atmosphere can hold more water vapor, which produces in turn more intense precipitation (Casanueva et al., 2014).
Unlike the consistent warming trend regionally reported for extreme temperature indices (Lakatos et al., 2016; Bartholy and Pongrácz, 2007;
Gavrilov et al., 2016; Branković et al., 2013), studies on extreme precipitation indices over the Pannonian Basin determined spatially incoherent, mainly weak and mixed-in-sign trends (Bartholy and Pongrácz, 2007; Lakatos et al., 2011;
Dumitrescu et al., 2015; Unkašević and Tošić, 2011; Gajić-Čapka et al., 2015).
However, they generally suggest that precipitation intensity had regionally increased. Research on changes in extreme precipitation indices over the Bosnia and Herzegovina part of the region has been scarce so far (e.g., Popov et al., 2017), and this kind of study has not been previously performed for this area.
Previous national scale studies primarily focused on precipitation spatial distribution (Mihailović et al., 2015) and changes in drought occurrence patterns (Ducić et al., 2014). The knowledge about extreme precipitation is very important for impact assessment studies as well as for development and implementation of efficient adaptation and mitigation strategies. Given the existing gap in the knowledge, this study aims to analyze changes in precipitation extremes during the period 1961−2016 using 11 indices recommended by the joint CCl/CLIVAR/JCOMM Expert Team on Climate Change Detection and Indices (ETCCDI) for the climate change assessment.
The main goal was to determine trends in extreme precipitation indices and changes in their distributions.
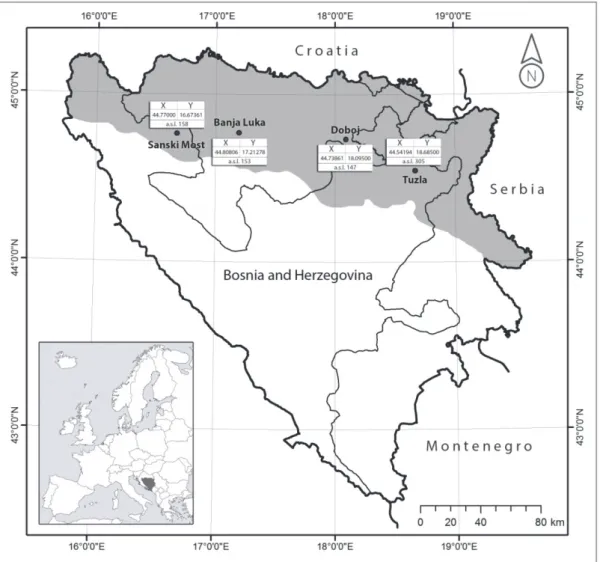
2. Study area
The Peripannonian region of Bosnia and Herzegovina represents the southern rim of the Pannonian Basin. It is located in the northern part of Bosnia and Herzegovina’s territory at latitudes 43°57'′22″−45°16′35″N and longitudes
15°43′49″−19°37′25″E (Fig. 1). It covers 37% of the country total area (18951.4 km2). The study area encompasses the lowland of the Sava River basin (and basins of its tributaries Una, Vrbas, Bosna, and Drina) up to 200 m and the southern rim of the Pannonian Basin with hills, low ore and flysch mountains, and horst mountains from 200 to 800 m (in some locations up to 1000 m).
Towards the south, it gradually enters the Dinaric Alps range covering the central part of Bosnia and Herzegovina. Western parts of the region are slightly cooler than the eastern. Average annual temperature increases from 10.2 °C in the west to an 11.3 °C in the east (Trbić, 2010). In the lowland area along the Sava River, annual precipitation decreases from ~900mm in the west to
~700mm in the east. From this lowland area, the precipitation increases to 1000−1200 mm towards the mountainous rim areas in the south (Trbić, 2010).
The primary precipitation maximum occurs in June, whereas minimum is recorded in October.
Fig. 1. Geographical location of the study area with the coordinates of the meteorological stations used in the study.
3. Data and methods
Analysis of extreme precipitation during the period of 1961–2016 was performed based on climatological datasets of daily precipitation from four meteorological stations located in different parts of the Peripannonian region:
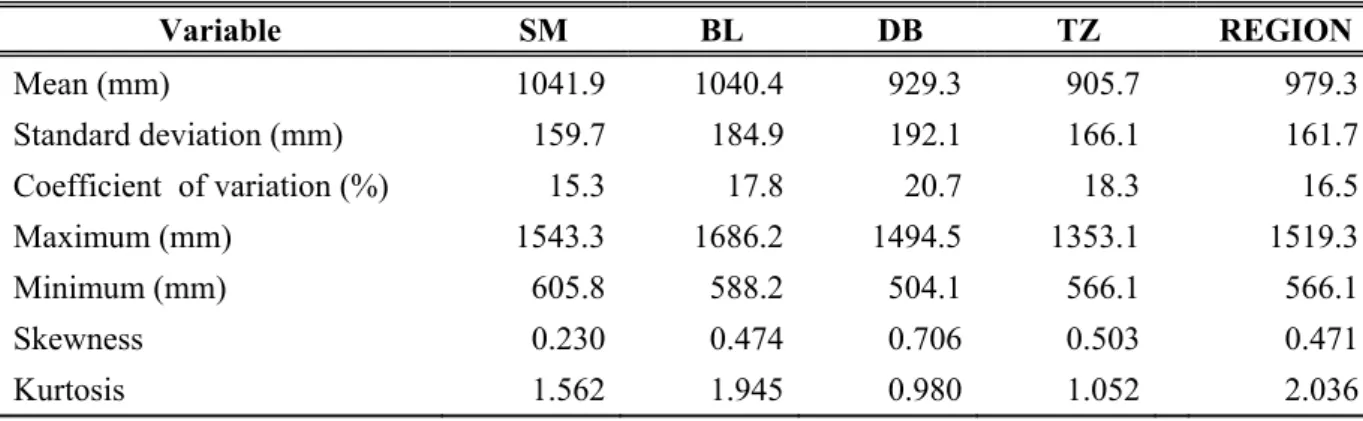
Sanski Most (SM), Banja Luka (BL), Doboj (DB), and Tuzla (TZ) (Fig. 1). Data were provided by the Federal Hydrometeorological Institute and the Hydrometeorological Service of the Republic of Srpska. In the observed period, there were short interruptions in measurements during the war period (at Sanski Most stationin November and December 1992 and November 1996; at Tuzla station from July 1992 toJuly 1993; at Doboj station during the entire war period of 1992‒1996). However, RClimDex software can run if there are some missing values (Zhang and Yang, 2004). Data quality control was performed in RClimDex. A few outliers (defined as values outside a range of 4 standard deviations of the climatological mean value for the day) were found and checked. The basic statistical parameters of the input precipitation series used in the study are given in Table 1.
Table 1. Statistical parameters of annual precipitation time series used in the study
Variable SM BL DB TZ REGION
Mean (mm) 1041.9 1040.4 929.3 905.7 979.3
Standard deviation (mm) 159.7 184.9 192.1 166.1 161.7 Coefficient of variation (%) 15.3 17.8 20.7 18.3 16.5
Maximum (mm) 1543.3 1686.2 1494.5 1353.1 1519.3
Minimum (mm) 605.8 588.2 504.1 566.1 566.1
Skewness 0.230 0.474 0.706 0.503 0.471
Kurtosis 1.562 1.945 0.980 1.052 2.036
Mean annual and seasonal precipitation amounts during the observed period (1961‒2016) are given in Table 2. For comparison, their average values in the period 1961–1990 are also showed. The regionally averaged, mean annual precipitation is 979 mm. In general, the precipitation decreases from the western (~1040 mm) to the eastern (~905 mm) parts of the region. Although precipitation is relatively distributed evenly throughout the year, the maximum occurs in the summer season (~280 mm).
Table 2. Annual and seasonal mean precipitation amounts in 1961‒2016 (a) and 1961‒1990 (b) (mm)
Index SM BL DB TZ REGION a b a b a b a b a b
Winter 226 214 227 220 198 188 184 186 209 202
Spring 264 262 266 264 232 221 228 229 248 244
Summer 272 293 284 299 274 263 284 289 279 286
Autumn 281 254 266 246 228 200 212 192 247 223
Year 1042 1023 1040 1029 929 870 906 894 979 954
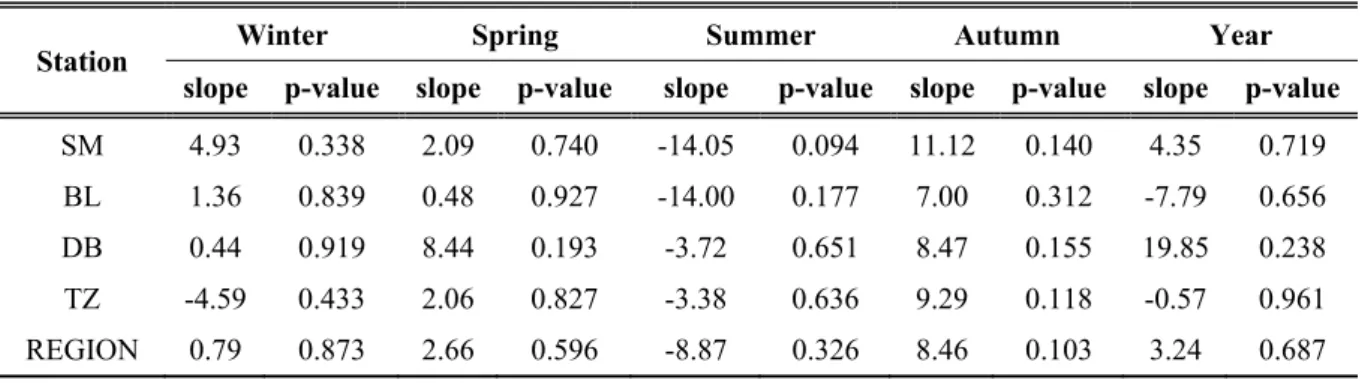
Unlike the consistent warming trend recorded for temperature (Trbić et al., 2017), precipitation does not show spatially and temporally coherent trends. The annual and seasonal precipitation amounts displayed trends of both signs, but all insignificant (Table 3). The strongest positive trend in annual precipitation was registered in Doboj (19.85 mm per decade), whereas the most prominent negative trend was detected in Banja Luka (–7.79 mm per decade). The seasonal trend analysis showed that negative trends were registered in summer over the entire region (most pronounced in Sanski Most and Banja Luka –14.0 mm per decade), whereas in other parts of the year the upward tendency was registered, except in winter in Tuzla (–4.59 mm per decade). In autumn and spring, the most pronounced trends were found at Sanski Most (11.12 mm per decade) and Doboj (8.44 mm per decade), respectively.
Table 3. Decadal trends in mean annual and seasonal precipitation amounts in 1961‒2016
Station Winter Spring Summer Autumn Year
slope p-value slope p-value slope p-value slope p-value slope p-value SM 4.93 0.338 2.09 0.740 -14.05 0.094 11.12 0.140 4.35 0.719 BL 1.36 0.839 0.48 0.927 -14.00 0.177 7.00 0.312 -7.79 0.656 DB 0.44 0.919 8.44 0.193 -3.72 0.651 8.47 0.155 19.85 0.238 TZ -4.59 0.433 2.06 0.827 -3.38 0.636 9.29 0.118 -0.57 0.961 REGION 0.79 0.873 2.66 0.596 -8.87 0.326 8.46 0.103 3.24 0.687
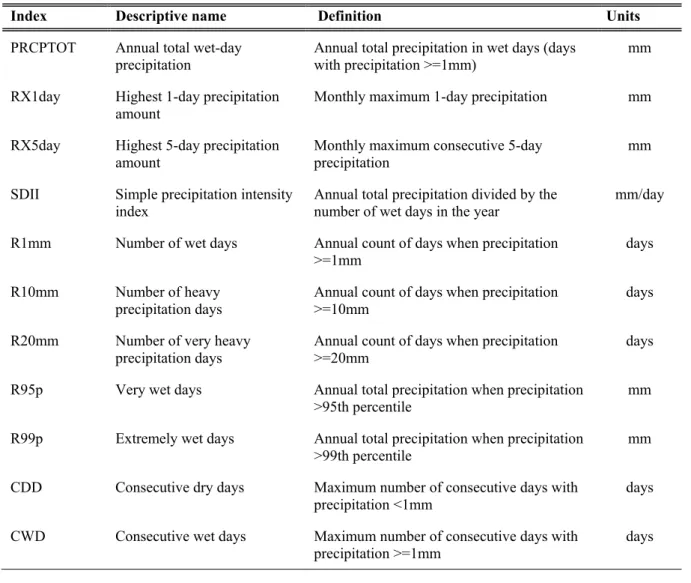
The selected precipitation indices (Table 4) can be divided into 4 different categories (Alexander et al., 2006):
1. Absolute extreme indices representing the maximum precipitation values (RX1day, Rx5day, and SDII).
2. Absolute-based (fixed) threshold indices defined as the number of days on which a precipitation value falls above fixed thresholds (R1mm, R10mm, and R20mm).
3. Percentile-based (non-fixed) threshold indices defined as the precipitation amounts exceeding fixed percentile thresholds (in this study 95th and 99th were chosen for the analysis, with the period 1961–1990 as a base period for determining its frequency distribution) (R95p and R99p).
4. Duration-based indices (i.e., spell indices) defined as periods of excessive wet or dry periods (CDD and CWD).
Table 4. Definitions of precipitation indices used in the study (ETCCDI, 2009)
Index Descriptive name Definition Units PRCPTOT Annual total wet-day
precipitation Annual total precipitation in wet days (days
with precipitation >=1mm) mm RX1day Highest 1-day precipitation
amount Monthly maximum 1-day precipitation mm RX5day Highest 5-day precipitation
amount Monthly maximum consecutive 5-day
precipitation mm
SDII Simple precipitation intensity
index Annual total precipitation divided by the
number of wet days in the year mm/day R1mm Number of wet days Annual count of days when precipitation
>=1mm days
R10mm Number of heavy
precipitation days Annual count of days when precipitation
>=10mm days
R20mm Number of very heavy precipitation days
Annual count of days when precipitation
>=20mm
days
R95p Very wet days Annual total precipitation when precipitation
>95th percentile
mm
R99p Extremely wet days Annual total precipitation when precipitation
>99th percentile mm
CDD Consecutive dry days Maximum number of consecutive days with
precipitation <1mm days
CWD Consecutive wet days Maximum number of consecutive days with
precipitation >=1mm days
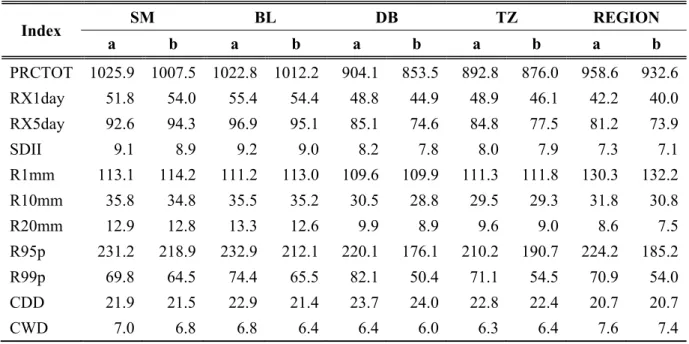
An overview of the average annual values of extreme precipitation indices during the periods of 1961–2016 and 1961−1990 is given in Table 5.
Table 5. Average annual values of extreme precipitation indices in 1961‒2016 (a) and 1961‒
1990 (b)
Index SM BL DB TZ REGION a b a b a b a b a b PRCTOT 1025.9 1007.5 1022.8 1012.2 904.1 853.5 892.8 876.0 958.6 932.6 RX1day 51.8 54.0 55.4 54.4 48.8 44.9 48.9 46.1 42.2 40.0 RX5day 92.6 94.3 96.9 95.1 85.1 74.6 84.8 77.5 81.2 73.9
SDII 9.1 8.9 9.2 9.0 8.2 7.8 8.0 7.9 7.3 7.1
R1mm 113.1 114.2 111.2 113.0 109.6 109.9 111.3 111.8 130.3 132.2 R10mm 35.8 34.8 35.5 35.2 30.5 28.8 29.5 29.3 31.8 30.8 R20mm 12.9 12.8 13.3 12.6 9.9 8.9 9.6 9.0 8.6 7.5 R95p 231.2 218.9 232.9 212.1 220.1 176.1 210.2 190.7 224.2 185.2
R99p 69.8 64.5 74.4 65.5 82.1 50.4 71.1 54.5 70.9 54.0
CDD 21.9 21.5 22.9 21.4 23.7 24.0 22.8 22.4 20.7 20.7
CWD 7.0 6.8 6.8 6.4 6.4 6.0 6.3 6.4 7.6 7.4
The extreme precipitation indices were calculated using the RClimDex (1.0) software package developed at the Climate Research Branch of Meteorological Service of Canada (Zhang and Yang, 2004). Trend slope estimate and its statistical significance were also computed in RClimDex by linear least square method and locally weighted linear regression (dashed line on plots) (Zhang and Yang, 2004).
Calculations were made by stations individually and then averaged for the whole Peripannonian region of Bosnia and Herzegovina.
In order to further examine the changes in the extreme precipitation, probability density functions (pdfs) for each index (regionally averaged) were calculated for two sub-periods: 1961–1990 and 1991–2016. Two-tailed nonparametric Kolmogorov–Smirnov test was performed by the XLSTAT Version 2014.5.03 software to test whether distribution of the indices changed significantly between the two specified periods. Moreover, the maximum likelihood estimation (MLE) method was used for estimating changes in generalized extreme value (GEV) distribution functions parameters (location, shape, and scale) of the annual maximum precipitation. R package extRemes created at the National Center for Atmospheric Research of the USA was used for performing this extreme value analysis (Gilleland and Katz, 2016).
4. Results
Decadal trends in the annual extreme precipitation indices in the period 1961‒
2016 are shown by stations in Table 6. Fig. 2 displays annual trends averaged for the whole region. The obtained results suggest a general increase in the precipitation intensity. Moreover, growing maximum duration of both dry and wet periods indicates increased precipitation variability. However, compared to the observed trends in mean and extreme temperatures (Trbić et al., 2017; Popov et al., 2018), less spatially coherent patterns of change were registered.
Table 6. Decadal trends in extreme precipitation indices in 1961‒2016
Index SM BL DB TZ
slope p-value slope p-value slope p-value slope p-value PRCTOT 7.07 0.601 –1.61 0.916 20.84 0.202 7.83 0.580 RX1day –1.55 0.310 –0.04 0.984 2.28 0.112 1.38 0.286 RX5day 0.26 0.914 –0.14 0.962 6.84 0.010 4.73 0.095 SDII 0.16 0.049 0.06 0.513 0.21 0.029 0.09 0.343 R1mm –1.51 0.196 –1.23 0.288 –0.82 0.472 –0.70 0.501 R10mm 0.57 0.293 0.08 0.898 0.56 0.366 0.06 0.908 R20mm –0.07 0.836 0.15 0.658 0.40 0.264 0.25 0.436 R95p 7.34 0.395 6.77 0.494 21.06 0.056 10.29 0.306 R99p 1.01 0.857 1.05 0.865 18.88 0.012 9.97 0.136 CDD 0.52 0.314 1.31 0.022 0.02 0.974 0.58 0.302 CWD 0.15 0.242 0.26 0.132 0.23 0.088 –0.07 0.634
Most of the estimated trend values were not statistically significant.
PRCPTOT (annual total of precipitation on wet days) displayed predominantly positive trends in the range of 7.07−20.84 mm per decade, except in Banja Luka, where a weak downward tendency was registered (–1.61mm per decade).
The peak annual daily precipitation showed very weak trends that were mixed in sign. Maximum 1-day precipitation (RX1day) had been increasing in the eastern parts of the region (1.38−2.28 mm per decade), whereas a slight decrease was registered in the west (e.g., –0.04mm per decade in Banja Luka). The increasing tendency was somewhat stronger for the RX5day − e.g., statistically significant trend in the range of 6.84 mm per decade was determined for Doboj area. Although simple precipitation intensity index (SDII) showed upward trends over the entire region, the estimated trend values were significant only at Doboj and Sanski Most stations (0.16 mm/day per decade and 0.21 mm/day per decade, respectively).
Absolute-based (fixed) threshold indices displayed very weak and insignificant trends. The negative trends in the annual number of wet days
(R1mm) (ranging from –0.70 to –1.51 days per decade) and the upward trends in the annual number of heavy precipitation days (R10mm) and very heavy precipitation days (R20mm) (in the range of 0.06‒0.57 and 0.15‒0.40 days per decade, respectively) suggest changes towards more intense precipitation (although mainly insignificant).
Decadal trends in the annual percentile-based indices were also consistent with stated. The contribution from the very wet days (R95p) and extremely wet days (R99p) to the annual precipitation total increased over the entire region, although trends were mostly insignificant. Statistically significant positive trends in the annual R95p and R99p were registered only in Doboj ‒ in the range of 21.06 mm per decade and 18.88 mm per decade, respectively. All trends indicating increase in either the frequency or intensity of heavy precipitation were generally most prominent precisely in Doboj area. Exceptionally high precipitation, which caused catastrophic flooding over this area, had been recorded several times since the beginning of the 21st century. The most disastrous floods occurred in May and August 2014, when in just a few days, 17%
and 14% of average annual precipitation in the period 1961−1990 was registered.
Before that, similar weather conditions had been registered in June 2010, when in only two days, 20% of the total annual precipitation was recorded.
Both duration-based indices, CDD and CWD, displayed positive trends over the region (but predominantly insignificant). A very weak negative trend was determined only for CWD in Tuzla. The maximum number of consecutive dry days (CDD) showed particularly prominent positive trend in Banja Luka (1.31 days per decade). The upward trend in the maximum duration of consecutive wet days (CWD) during the observed period was the most significant (p<0.1 %) in Doboj, 0.23 days per decade.
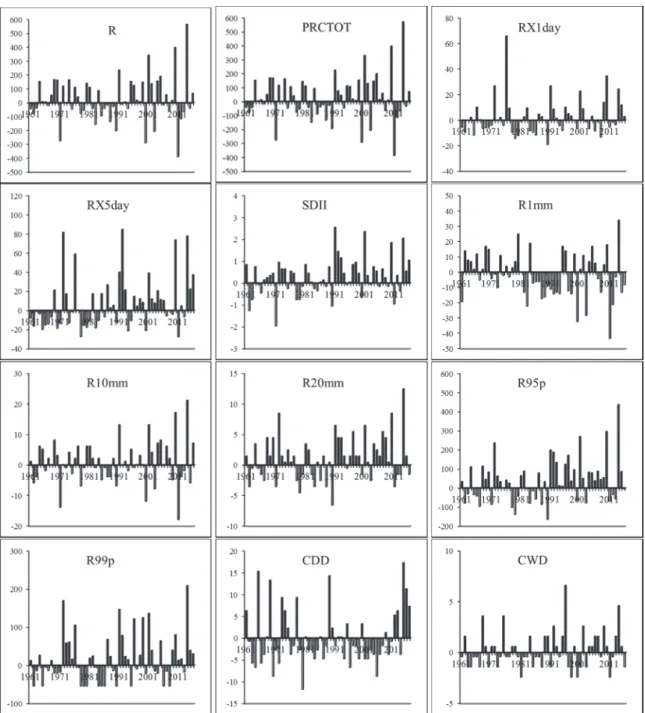
Fig. 2. Linear trends in extreme precipitation indices in 1961−2016. (Continued on the following page.)
Fig. 2. (Continued on the following page.)
Fig. 2. (Continued from the previous page.)
The analysis of deviations of annual extreme precipitation indices from the thirty-year period (1961–1990) averages (Fig. 3) showed that the increase in heavy precipitation (e.g. in R95p and R99p) has become more pronounced since the beginning of the 21st century. In that period, maximum 1-day and 5-day precipitations were also dominantly above the 1961–1990 period averages. A noticeable increase in the inter-annual precipitation variability was also observed in this period – a year with precipitation far above the average was often followed by a year with extremely low precipitation or vice versa (e.g., 2000–2001 and 2010‒2011). In 2001, annual values of PRCTOT, R10mm, R20mm, RX1day, and RX5day were 2.0‒2.3 times higher than in 2000, whereas the contribution of R95p and R99p was 4-fold and 6-fold, respectively.
In the very dry year 2011, the number of with precipitation were 41% less, while the precipitation amount was 59% less than in the very wet 2010.
Changes in the probability distribution functions (pdfs) of the annual extreme precipitation indices in the period 1991–2016 compared to the reference period 1961–1990 are displayed in Fig. 4.
In terms of the probability distributions, the results also very clearly show that heavy precipitation indices SDII, RX1day, RX5day, R20mm, R95p, and R99p shifted to the right, to higher index values (i.e., to increased heavy precipitation events). However, the Kolmogorov–Smirnov test results showed that distributional changes between the two specified periods were mostly insignificant. However, significant distributional shifts were determined for heavy precipitation indices RX5day, R95p, and R99p. For the majority of indices, changes were particularly pronounced in the upper tail of distribution.
This was especially the case with the maximum duration of consecutive days with precipitation (CWD) and heavy precipitation indices SDII, R10mm, R20mm, R95p, and R99p.
Fig. 3. Annual deviations of mean precipitation and extreme precipitation indices from the averages of the period1961–1990.
Fig. 4. Probability distribution functions of extreme precipitation indices for the two sub-
periods: 1961–1990 (dashed line) and 1991–2016 (solid line).
Fig. 4. (Continued from the previous page.)
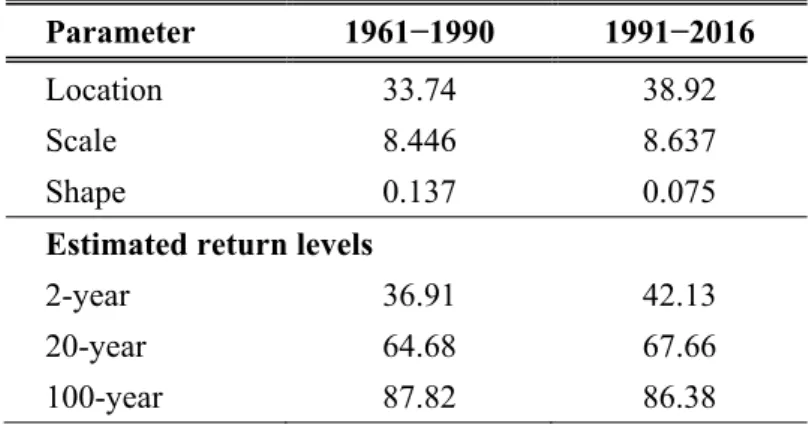
In addition, the analysis of the GEV distribution parameters of annual maximum precipitations showed that the location parameter value increased in the period 1991−2016 (Table 7), which also indicates an increase in the precipitation intensity. Higher value of the distribution scale parameter suggests that the precipitation variability also increased in the latter period. This is consistent with the changes in the probability distributions of annual total of precipitation in wet days – the lower tail of PRCTOT distribution shifted towards drier conditions, whereas the upper tail of distribution shifted towards wetter conditions. Estimated 2-year and 20-year return levels also increased compared to the reference period. Results of the study carried out over Europe for the period 1951–2010 also determined that, despite a considerable decadal variability. 5-, 10-, and 20-year events of the 1-day (but also 5-day) precipitation for the first 20-year period generally became more common during this 60-year period (Van den Besselaar et al., 2013). For all analyzed regions, seasons, and return periods, the median reduction in the return period between the first and last 20-year periods was about 21% (a decrease ranged from ∼2% to ∼58%) (Van den Besselaar et al., 2013).
Table 7. Estimated GEV distribution functions parameters and return levels fitted to the annual maximum precipitation
Parameter 1961−1990 1991−2016
Location 33.74 38.92
Scale 8.446 8.637
Shape 0.137 0.075
Estimated return levels
2-year 36.91 42.13
20-year 64.68 67.66
100-year 87.82 86.38
5. Discussion
Although observed trends were spatially incoherent and mainly statistically insignificant, the results indicate a general increase in the extreme precipitation (in its intensity, frequency, or duration). Similar patterns of change with trends spatially and temporally mixed-in-sign and mostly insignificant, had been determined in other studies carried out in the Pannonian and Peripannonian regions. A regional scale study determined that the intensity and frequency of extreme precipitation increased between 1976 and 2001 (Bartholy and Pongrácz, 2007). The significant mean tendency during the period 1946–2001 displayed CDD, RX5day, and R1mm (Bartholy and Pongrácz, 2007). It should be noted that the strongest upward trends were detected for extreme indices indicating very intense or large precipitation (i.e., R95p, R20mm, and R95) (Bartholy and Pongrácz, 2007). Local scale studies found spatially incoherent and mainly insignificant patterns of change. Increase in the proportion of heavy precipitation events in total precipitation was registered over most areas in Hungary (Lakatos et al., 2011). Over this area, the number of wet days decreased annually, whereas mixed-in-sign trends were detected for RX1day (in the range from –15mm to +10mm) (Lakatos et al., 2011). SDII increased int he summer season (Lakatos et al., 2011). The annual precipitation extremes showed mixed signals and no significant trends at majority of stations in Romania for all indices examined in the study of Dumitrescu et. al. (2015). Increase in the R10mm and R20mm was found in the Pannonian region of Romania (Dumitrescu et. al., 2015). Over this area, about one third of the stations registered significant SDII trends (20% increasing and 12% decreasing) (Dumitrescu et. al., 2015).
Heavy precipitation indices R95p and R20mm displayed upward trends over almost the entire territory of Serbia, including northern Pannonian part of the country (Unkašević and Tošić, 2011). During the 20th century, the average annual precipitation on the wettest day over Serbia increased by nearly 9% (Unkašević
and Tošić, 2011). Over the mainland of Croatia, the R95p showed mostly positive trends, whereas trends in RX1day and RX5day were mixed in sign, but weak in magnitude (Gajić-Čapka et al., 2015). The seasonal SDII trend analysis revealed mixed-in-sign and mainly insignificant trends, except in summer, when negative trends were detected (Gajić-Čapka et al., 2015). Although changes in precipitation sums showed no significant tendencies over the southern Poland in the part of period 1971–2010, an increase in R1mm and a decrease in R20mm were observed (Skowera et al., 2016).
The expected changes in the annual precipitation indices by the end of the 21st century (2071–2100) will be small, but generally consistent with the detected trends in the last quarter of the 20th century (Pongrácz et al., 2009). Strong positive and negative changes in the monthly precipitation indices are projected to occur in winter and summer, respectively − the increase in the extreme precipitation events will exceed 50% in January, whereas drought is projected to become more intense in July (Pongrácz et al., 2009). The frequency of extreme precipitation will generally increase over the entire region, except in summer, when decreasing trend is very likely to occur (e.g., R10mm and R20mm are projected to decrease in July and August relative to the 1961–1990 reference period) (Bartholy et al., 2015). The projected increase in the heavy precipitation indices R95p and R99p fractions will be generally higher in winter and autumn, whereas the smallest increases are projected to occur in the summer and spring seasons (Bartholy et al., 2015). Results of Pongrácz et al. (2014) clearly imply that future summers will be considerably drier. In this part of the year, drought-related climate indices are projected to significantly increase over the region by the end of the 21st century. In accordance with the indicated increase in dryness, R1mm is projected to decrease and CDD to increase in this season (Pongrácz et al., 2014).
6. Conclusion
Recent trends in the 11 extreme daily precipitation indices over the Peripannonian region of Bosnia and Herzegovina were calculated for the period 1961–2016 using the RClimDex (1.0) software. The examined indices displayed mainly weak, insignificant, and mixed-in-sign trends. The analysis of probability density functions also confirmed that for the majority of indices there were not significant changes in extreme precipitation indices in the period 1991−2016 compared to the period 1961−1990. However, the obtained results suggest a general increase in heavy precipitation over the study area. The upward trends in heavy precipitation events such as RX1day, RX5day, SDII, R10mm, R20mm, R95p, and R99p indicate changes towards more intense precipitation. The increase in intense precipitation has become more pronounced since the beginning of the 21st century. In addition, a noticeable increase in inter-annual precipitation variability was observed in this period.
This kind of study should contribute to overcoming the existing gap in knowledge about recent changes in extreme precipitation over this part of the Pannonian Basin. The obtained results are in accordance with the results of similar studies in other parts of the region. Moreover, the results confirm the findings of the previous studies, that changes in precipitation were not coherent at a regional scale − as opposed to the coherent and significant temperature trends (i.e., warming trend) (Lakatos et al., 2016; Bartholy and Pongrácz, 2007).
The future research should be focused on several major issues regarding the results: 1) projections of future changes in extreme precipitation indices and 2) impact assessment studies, given that the observed changes in extreme precipitation events (but also the changes anticipated by the end of the 21st century) could have strong influence on socio-economic and natural systems.
Understanding the patterns of extreme precipitation change will be of a great pertinence in many applied studies – in flood risks management, agricultural planning, water resources management, environment conservation, etc. The third major issue is the development and implementation of efficient adaptation and mitigation strategies in various sectors. As such, there is a growing need for a more detailed knowledge on extreme precipitation patterns of change.
References
Alexander, L.V. and Arblaster, J.M., 2017: Historical and projected trends in temperature and precipitation extremes in Australia in observations and CMIP5. Weather Climate Extr. 15, 34−56. https://doi.org/10.1016/j.wace.2017.02.001
Alexander, L.V., Zhang, X., Peterson, T.C., Caesar, J., Gleason, B., Klein Tank, A.M.G., Haylock, M., Collins, D., Trewin, B., Rahimzadeh, F., Tagipour, A., Rupa Kumar, K., Revadekar, J., Griffiths, G., Vincent, L., Stephenson, D.B., Burn, J., Aguilar, E., Brunet, M., Taylor, M., New, M., Zhai, P., Rusticucci, M. and Vazquez-Aguirre, J.L., 2006: Global Observed Changes in Daily Climate Extremes of Temperature and Precipitation. J. Geophys. Res. 111, D05109.
https://doi.org/10.1029/2005JD006290
Asadieh, B. and Krakauer, N.Y., 2015: Global trends in extreme precipitation: climate models versus observations. Hydrol. Earth Syst. Sci. 19, 877–891. https://doi.org/10.5194/hess-19-877-2015 Balling Jr., R.C., Kiany, M.S.K., Sen Roy, S. and Khoshhal, J., 2016: Trends in extreme precipitation
indices in Iran: 1951–2007. Adv. Meteorol. 2016, Article ID 2456809.
Bartholy, J. and Pongrácz, R., 2007: Regional analysis of extreme temperature and precipitation indices for the Carpathian Basin from 1946 to 2001. Glob. Planet. Change 57, 83–95.
https://doi.org/10.1016/j.gloplacha.2006.11.002
Bartholy, J., Pongrácz, R. and Kis, A,. 2015: Projected changes of extreme precipitation using multi- model approach. Időjárás 119, 129–142.
Bartolomeu, S., Carvalho, M.J., Marta-Almeida, M., Melo-Gonçalves, P. and Rocha, A., 2016: Recent trends of extreme precipitation indices in the Iberian Peninsula using observations and WRF model results. Physics and Chem. Earth, Parts A/B/C 94, 10−21.
https://doi.org/10.1016/j.pce.2016.06.005
Branković, Č., Cindrić, K., Gajić-Čapka, M., Güttler, I., Pandžić, K., Patarčić, M., Srnec, L., Tomašević, I., Vučetić, V. and Zaninović, K., 2013: Sixth National Communication of the Republic of Croatia under the United Nation Framework Convention on the Climate Change (UNFCCC) Selected Sections in Chapters: 7. Climate Change Impacts and Adaptation Measures 8. Resarch, Systematic Observation and Monitoring. Meteorological and hydrological service of Croatia, Zagreb.
Casanueva, A., Rodríguez-Puebla, C., Frías, M.D. and González-Reviriego, N., 2014: Variability of extreme precipitation over Europe and its relationships with teleconnection patterns. Hydrol.
Earth Syst. Sci. 18, 709–725. https://doi.org/10.5194/hess-18-709-2014
Chen, D., Walther, A., Moberg, A., Jones, P., Jacobeit, J. and Lister, D., 2015: European trend atlas of extreme temperature and precipitation records. Springer, Dordrecht.
Donat, M.G., Alexander, L.V., Yang, H., Durre, I., Vose, R., Dunn, R.J.H., Willett, K.M., Aguilar, E., Brunet, M., Caesar, J., Hewitson, B., Jack, C., Klein Tank, A.M.G., Kruger, A.C., Marengo, J., Peterson, T.C., Renom, M., Oria Rojas, C., Rusticucci, M., Salinger, J., Elrayah, A.S., Sekele, S.S., Srivastava, A.K., Trewin, B., Villarroel, C., Vincent, L.A., Zhai, P., Zhang, X. and Kitching, S., 2013:
Updated analyses of temperature and precipitation extreme indices since the beginning of the twentieth century: the Hadex2 dataset. Journal of Geophysical Research: Atmospheres 118, 1−16.
Ducić, V., Burić, D., Trbić, G. and Cupać, R., 2014: Analysis of precipitation and droughts on BIH territory based upon Standardized Precipitation Index (SPI). Herald 18, 53−70.
Dumitrescu, A., Bojariu, R., Birsan, M. V., Marin, L. and Manea, A., 2015: Recent climatic changes in Romania from observational data (1961–2013). Theor. Appl.Climatol. 122, 111−119.
https://doi.org/10.1007/s00704-014-1290-0
ETCCDI, 2009: Climate Change Indices, Definitions of the 27 Core Indices. Retrieved on February 8 2017 from http://etccdi.pacificclimate.org/list_27_indices.shtml
Filahi, S., Tanarhte, M., Mouhir, L., El Morhit, M. and Tramblay, Y., 2016: Trends in indices of daily temperature and precipitations extremes in morocco. Theor. Appl. Climatol. 124, 959–972.
https://doi.org/10.1007/s00704-015-1472-4
Frich, P., Alexander, L.V., Della-Marta, P., Gleason, B., Haylock, M. Klein Tank, A.M.G. and Peterson, T., 2002: Observed coherent changes in climatic extremes during the second half of the twentieth century. Climate Res. 19, 193–212. https://doi.org/10.3354/cr019193
Gajić-Čapka, M., Cindrić, K. and Pasarić, Z., 2015: Trends in precipitation indices in Croatia, 1961–
2010. Theor. Appl. Climatol. 121, 167−177. https://doi.org/10.1007/s00704-014-1217-9
Gavrilov, M.B., Tošić, I. Marković, S.B., Unkašević, M. and Petrović, P., 2016: Analysis of annual and seasonal temperature trends using the Mann-Kendall test in Vojvodina, Serbia. Időjárás 120, 183–198.
Gilleland, E. and Katz, R.W., 2016: extRemes 2.0: an extreme value analysis package in R. J. Stat.
Software 72, 1–39. https://doi.org/10.18637/jss.v072.i08
Hartmann, D.L., Klein Tank, A.M.G., Rusticucci, M., Alexander, L.V., Brönnimann, S., Charabi, Y., Dentener, F.J., Dlugokencky, E.J., Easterling, D.R., Kaplan, A., Soden, B.J., Thorne, P.W., Wild, M. and Zhai, P.M., 2013: Observations: atmosphere and surface. In (Eds.: Stocker, T.F., Qin, D., Plattner, G.K., Tignor, M., Allen, S.K., Boschung, J., Nauels, A., Xia, Y., Bex, V. and Midgley, P.M..) Climate change 2013: the physical science basis, Contribution of Working Group I to the Fifth Assessment Report of the Intergovernmental Panel on Climate Change.
Cambridge University Press, Cambridge. 159−254
IPCC, 2014: Climate change 2014: synthesis report. Contribution of Working Groups I, II and III to the Fifth Assessment Report of the Intergovernmental Panel on Climate Change (Eds. Core Writing Team, Pachauri, R.K., & Meyer, L.A.) IPCC, Geneva.
Kiktev, D., Sexton, D.M.H., Alexander, L. and Folland, C.K., 2003: Comparison of modeled and observed trends in indices of daily climate extremes. J. Climate 16, 3560−3571.
https://doi.org/10.1175/1520-0442(2003)016<3560:COMAOT>2.0.CO;2
Kioutsioukis, I., Melas, D. and Zerefos, C., 2010: Statistical assessment of changes in climate extremes over Greece (1955–2002). Int. J. Climatol. 30, 1723–1737. https://doi.org/10.1002/joc.2030 Klein-Tank, A.M.G. and Können, G.P., 2003: Trends indices of daily temperature and precipitation
extremes in Europe, 1946–99. J. Climate 16, 3665−3680.
https://doi.org/10.1175/1520-0442(2003)016<3665:TIIODT>2.0.CO;2
Lakatos, M., Bihari, Z., Szentimrey, T., Spinoni, J. and Szalai, S., 2016: Analyses of temperature extremes in the Carpathian region in the period 1961–2010. Időjárás 120, 41–51.
Lakatos, M., Szentimrey, T. and Bihari, Z., 2011: Application of gridded daily data series for calculation of extreme temperature and precipitation indices in Hungary. Időjárás 115, 99−109.
de Lima, M.I.P., Santo, F.E., Ramos, A.M. and Trigo, R.M., 2015: Trends and correlations in annual extreme precipitation indices for mainland Portugal, 1941–2007. Theor. Appl.
Climatol. 119, 55−75. https://doi.org/10.1007/s00704-013-1079-6
Łupikasza, E.B., Hänsel, S. and Matschullat, J., 2011: Regional and seasonal variability of extreme precipitation trends in southern Poland and central-eastern Germany 1951–2006. Int. J.
Climatol. 31, 2249–2271. https://doi.org/10.1002/joc.2229
Mihailović, D.T., Drešković, N. and Mimić, G., 2015: complexity analysis of spatial distribution of precipitation: an application to Bosnia and Herzegovina. Atmos. Sci. Lett. 16, 324−330.
https://doi.org/10.1002/asl2.563
Moberg, A. and Jones, P.D., 2005: Trends in indices for extremes in daily temperature and precipitation in central and western Europe, 1901–99. Int. J. Climatol. 25, 1149–1171.
https://doi.org/10.1002/joc.1163
Ongoma, V., Chen, H. and Omony, G.W., 2016: Variability of extreme weather events over the Equatorial East Africa, a case study of rainfall in Kenya and Uganda. Theor. Appl.Climatol.
131,295–308. https://doi.org/10.1007/s00704-016-1973-9
Pongrácz, R., Bartholy, J. and Kis, A., 2014: Estimation of future precipitation conditions for Hungary with special focus on dry periods. Időjárás 118, 305–321.
Pongrácz, R., Bartholy, J., Gelybó, G. and Szabó, P., 2009: Detected and expected trends of extreme climate indices for the Carpathian Basin. In (Eds. Střelcová, K., Mátyás, C., Kleidon, A., Lapin, M., Matejka, F., Blaženec, M., Škvarenina, J. and Holécy, J.) Bioclimatology and Natural Hazards. Springer, Dordrecht. 15−28. https://doi.org/10.1007/978-1-4020-8876-6_2
Popov, T., Gnjato, S., Trbić, G. and Ivanišević, M., 2018: Recent Trends in Extreme Temperature Indices in Bosnia and Herzegovina. Carpathian J. Earth and Environ. Sci. 13, 211–224.
Popov, T., Gnjato, S., Trbić, G. and Ivanišević, M., 2017: Trends in Extreme Daily Precipitation Indices in Bosnia and Herzegovina. Collection of Papers - Faculty of Geography at the University of Belgrade 65, online first (http://zbornik.gef.bg.ac.rs/pdf/radovi/182.pdf)
Powell, E.J. and Keim, B.D., 2015: Trends in daily temperature and precipitation extremes for the Southeastern United States: 1948–2012. J. Climate 28, 1592−1612.
https://doi.org/10.1175/JCLI-D-14-00410.1
Sheikh, M.M., Manzoor, N., Ashraf, J., Adnan, M., Collins, D., Hameed, S., Manton, M. J., Ahmed, A.U., Baidya, S.K., Borgaonkar, H.P., Islam, N., Jayasinghearachchi, D., Kothawale, D.R., Premalal, K.H.M.S., Revadekar, J.V. and Shrestha, M.L., 2015: Trends in extreme daily rainfall and temperature indices over South Asia. Int. J. Climatol. 35, 1625−1637.
https://doi.org/10.1002/joc.4081
Skansi, M.M., Brunet, M., Sigro, J., Aguilar, E., Groening, J.A.A., Bentancur, O.J., Castellon Geier, Y.R., Correa Amaya, R.I., Jacome, H., Malheiros Ramos, A., Oria Rojas, C., Pasten, A.M., Mitro, S.S., Villaroel Jimenez, C., Martinez, R., Alexander, L.V. and Jones, P.D., 2013:
Warming and wetting signals emerging from analysis of changes in climate extreme indices over South America. Glob. Planet. Change 100, 295–307.
https://doi.org/10.1016/j.gloplacha.2012.11.004
Skowera, B., Kopcińska, J.J. and Bokwa, A., 2016: Changes in the structure of days with precipitation in southern Poland in 1971−2010. Időjárás 120, 365–381.
Tian, J., Liu, J., Wang, J., Li, C., Nie, H. and Yu, F., 2017: Trend analysis of temperature and precipitation extremes in major grain producing area of China. Int. J. Climatol. 37, 672–687.
https://doi.org/10.1002/joc.4732
Trbić, G., 2010: Ecoclimatological Regionalisation of the Peripannonian Rim in the Republic of Srpska. Geographic society of the Republic of Srpska, Banja Luka. (in Serbian)
Trbić, G., Popov, T. and Gnjato, S., 2017: Analysis of air temperature trends in Bosnia and Herzegovina. Geographica Pannonica 21, 68–84. https://doi.org/10.5937/GeoPan1702068T Unkašević, M. and Tošić, I., 2011: A statistical analysis of the daily precipitation over Serbia: trends
and indices. Theor. Appl. Climatol. 106, 69−78. https://doi.org/10.1007/s00704-011-0418-8 van den Besselaar, E.J.M., Klein Tank, A.M.G. and Buishand, T.A., 2013: Trends in European
precipitation extremes over 1951–2010. Int. J. Climatol. 33, 2682–2689.
Zhang, X. and Yang, F., 2004: RClimDex (1.0) User Manual. Climate Research Branch Environment Canada, Downsview, Ontario, Canada.