DOI:10.28974/idojaras.2020.4.2
IDŐJÁRÁS
Quarterly Journal of the Hungarian Meteorological Service Vol. 124, No. 4, October – December, 2020, pp. 447–462
Frost risk indicator analysis in Sopron wine region (1961–2016)
Tamás Füzi * and Márta Ladányi
Szent István University
Department of Biometrics and Agricultural Informatics Villányi street 29-43, 1118 Budapest, Hungary
*Corresponding author E-mail: fuzi.tamas@kertk.szie.hu (Manuscript received in final form January 28, 2020)
Abstract A characteristic symptom of climate change is the modified distribution of frost events that has fundamental effect on agricultural production. To learn these changes in Sopron region, Hungary, we investigated daily minimum and maximum temperature data of the period 1961–2016 provided by the Hungarian Meteorological Service. The time interval 1961–2016 was split into two (1961–1990 and 1991–2016) in order to compare nearly two climate cycles statistically. We analyzed the 56-year trends of the last frosty day of spring and the first frosty day of autumn as well as the length of the longest yearly frost-free period. As for the winter period (October 16 – February 28), the frequencies of four different strengths of frosty days were examined. We analyzed how often an uninterrupted frost-free period (Tmin>0 °C) longer than 12 days developed between two frosty periods in spring and in autumn, exactly when it occurred (Julian day), and how many days it lasted for. Finally, we investigated the trends of the yearly numbers of spring frosty days and their variances.
Amongst others, we show that the length of the longest uninterrupted frost-free periods has increased significantly over the past 56 years, with 70% of years in the recent climate cycle (1991–2016) having frost-free periods of more than 200 days. As an average change per 10 years, the last spring frost period ended four days earlier, while the onset of autumn frost shifted 2 days towards the end of the year. The number of days with minimum temperatures below -15 °C, -10 °C, -5 °C, and below 0 °C decreased significantly during the dormant period. These changes mean a prolongation of the growing season, partly a reduction of the winter regeneration period, and the potential higher overwintering success of the pests. The number of spring frost days also decreased significantly, while their variability has grown markedly.
Key-words: frost risk, grapevine, climate change, indicator analysis, spring refrost
1. Introduction
Extreme weather conditions caused by the change of the climate system can show up in different ways. Extreme events can be different in every region around the Earth as well as in Hungary. That is why it is expedient to analyze the changes in the climate system and the regional effects of global warming.
The statistical examination of risk factors due to extreme weather conditions is crucial in order to prepare, adapt, and mitigate the vulnerability of certain regions (Unterberger et al., 2018).
The most vulnerable sector to the potential consequences of changes is agriculture, while agriculture is responsible for producing food-ingredients.
According to Felkai and Varga (2010), the most important risk factor in agriculture – due to its unpredictability – is climate change, because its causes and effects are not yet fully learned.
In Hungary, regarding agriculture, frost is one of the greatest risk factors caused by weather (Kemény et al., 2011).
According to a study by Agricultural Economics Research Institute, the most serious damage in 2016 was caused by spring frost and hailstorm. 33% of all the registered damaged areas was caused by spring frost. In most reports of spring frost, the size of damaged areas was almost four times the size of that of the previous year, exceeding 43 thousand hectares (Keményné et al., 2017).
Therefore, managing and mitigating frost events presents a great challenge to farmers, particularly, if it happens during the spring.
We investigate the frequency and permanency of low temperature values which can cause frost risk. Inspecting these events has a special importance with regards to the bud burst and blooming phenophases, because in the case of grapevine, late spring frost can cause yield loss in the following year as well (Meier et al., 2018).
The research of grapevine growing possibilities has utmost importance.
According to Central Statistical Office data, in the year of 2016 from all the cultivated land in the country, grapevine was grown on more than 75 thousand hectares, and it contributed nearly 480 thousand tonnes of crop to the annual yield of agriculture.1 With these production conditions, Hungary falls into the category of moderate wine producing countries in the world with more than 3 million hectoliters of wine. For the abovementioned reasons, safe cultivation of this crop has great importance to the national economy.2
For a reference station, we chose Sopron. This region is a perfect example for traditional viticulture and wine production. In terms of the average yield of grapevine, this historical wine region is one of the best in the country.
1http://www.ksh.hu/docs/hun/xstadat/xstadat_eves/i_omn024b.html (donwloaded March 31, 2019)
2http://www.ksh.hu/docs/hun/xstadat/xstadat_eves/i_omn005.html (donwloaded March 31, 2019)
2. Literature review
By climate change, we mean the upward tendency of global mean annual temperature, together with the extreme weather conditions which are becoming more common in certain regions.
In viticulture, temperature is the most important aspect among environmental factors. Viticulture is mainly defined by the annual mean temperature. Low risk open field viticulture can be carried out only within 9–
21 °C annual mean temperature isotherms (Zanathy, 2008). The best regions lie within 10–16 °C isotherms (Oláh, 1979).
While in the Mediterranean region, grapevine can be grown safely due to the well-known balancing effects, the continental atmospheric conditions prevalent in the Carpathian Basin can cause such stress factors that lead to negative economic consequences both in quality and quantity (Szenteleki et al., 2011). One of these stress factors can be the frequency of extremely cold days (Dunkel and Kozma, 1981).
According to Hungarian Act CLXVIII of 2011 2§32, winter frost is defined as “temperature as low as -15 °C, measured during winter season at an altitude of 2 meters above ground level at the place of risk-taking”. According to Section 2 Point 32a, winter frost damage is defined as “necrosis of the crop in a plantation followed by a decline in yields”.
During the winter season, temperatures below -15 °C can cause serious damage to a wide variety of grapevine species. Late spring frost – even temperature as low as -1 °C – can cause a significant decline in yields (Szenteleki et al., 2012, Fila et al., 2014; Bois et al., 2015).
In spring, a cooling between 0 °C and -3 °C can seriously damage recently burst buds or intensively growing sprouts with inflorescences on them (Hajdu and Saskői Bné, 2009).
According to the second National Climate Change Strategy, the fact that due to mild winters, the resistance of perennials to the cold dwindles, causes another problem. In the case of an approximately 1–2.5 °C rise in temperature, bud burst happens 1-3 days earlier and the defoliation 1–2 days later per decade.
As a result of a change in the climate system, certain phenophases of grapevine happen earlier, and the periods between phenological phases become shorter (Jones and Davis, 2000, Leolini et al., 2018). The earlier appearance of phenological phases, for example the early flowering periods, poses greater risk with the return of the late spring frosts. Late spring frosts – mainly “carried”
frosts – can cause serious deformities in plants, thus leading to economic damage (Vitasse and Rebetez, 2018, Leolini et al., 2018).
For farmers, direct damage of frosts is the loss of revenue and consequent financing difficulties. Indirectly and in the short or long run, the following factors can cause serious problems: the increasing danger of alternation, the backlog of investments and developments required for maintaining competitiveness, and the loss of market as a consequence of commodity supply shortage (Apáti, 2013).
In Hungary, in year 2016, 62.6%, i.e., 3084.9 million HUF of the mitigating allowances were disbursed for frost damages. The majority of damage was inflicted among the plantations and field plants (Keményné et al., 2017).
In our study, we deal with quantifying frosty days and analyze the changes of extreme temperature values.
3. Methodology
We conducted our research with a focus on the Sopron wine region, between 1961 and 2016 with a time period of 56 years. For a reference station, we appointed Sopron with the adjacent wine region in a view of the fact that the city and its agglomeration have had a tradition in viticulture and winery for centuries.
The temperature data which we used for our study was provided by the monitoring station of the Hungarian Meteorological Service in Sopron.
We compared our results against two climatic cycles: the reference period between 1961–1990 and the more recent period from 1991 to 2016.
With respect to the 56-year-long period, we defined the Julian day (JD) of the last frosty day in spring and the first frosty day in autumn, and we analyzed the lengths of the longest annual frost-free periods. We calculated the slope of linear trends with their significance levels for the whole period (1961–2016), the reference period (1961–1990) and the more recent period (1991–2016).
We analyzed how often a frost-free period (Tmin > 0 °C) longer than 12 days developed between two frosty periods in spring and in autumn, exactly when (JD) and how many days it lasted for.
With respect to the 56-year-long period, for the dormancy period (October 16 – February 28), we defined the frequency of occurrence of four types of frost with different intensities, when the minimum daily temperature was lower than -15 °C, -10 °C, -5 °C, and 0 °C, respectively.
Furthermore, we analyzed the continuous length of frosty days, that is, how long do frosts with certain intensity happen in spring and in autumn year after year.
Finally, we analyzed the number of frosty days during spring in the last 56 years, together with their moving variances with a 9-year window.
For the comparison of the changes that happened during the reference period (1961–1990) and the more recent period (1991–2016), we calculated linear trends and applied a two-sample ratio test (Z-test) and a Student’s t-test.
In the latter case we proved the normality by d’Agostino test (p > 0.05). We checked the assumption of homogeneity of variances by F-test; in case it was violated, Student’s t-test was corrected by Welch’s degrees of freedom.
4. Results
4.1. The beginning, the end, and the length of the longest frost-free period
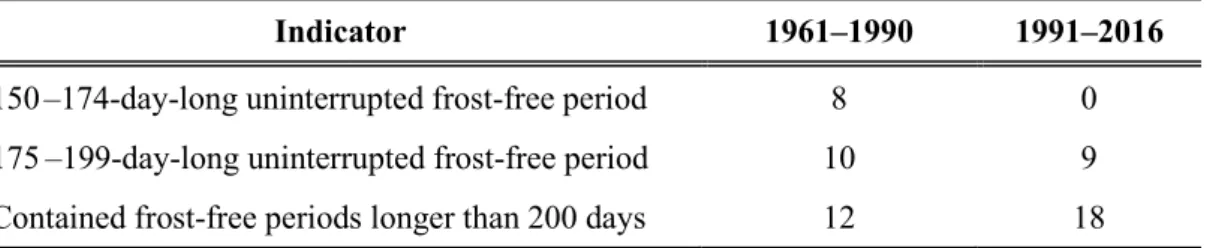
In the last two climate cycles (1961–2016), in the area of Sopron, the longest uninterrupted frost-free period (Tmin < 0 °C) was longer than 150 days in every year (Table 1).
Between 1961 and 2016, a 150–174-day-long frost-free period happened in 8 years, while during the more recent period, the number of such years was zero.
The number of years with frost-free periods longer than 200 days was 13 in the reference period, while in the more recent period (1991–2016) it was 18. This means that more than two-thirds of the 26-year period contained frost-free periods longer than 200 days (Table 1).
Table 1. Frequency of the longest frost-free periods in the two climate cycles studied (1961–1990 and 1991–2016) in Sopron
Indicator 1961–1990 1991–2016
150–174-day-long uninterrupted frost-free period 8 0 175–199-day-long uninterrupted frost-free period 10 9 Contained frost-free periods longer than 200 days 12 18
The length of frost-free periods has significantly increased in the past 56 years (slope of linear trend=m=0.62; p < 0.01). However, in the period between 1961 and 1990, the increase was not significant (m=0.81; p=0.14), while the change between 1991 and 2016 was significant (m=1.16; p < 0.02).
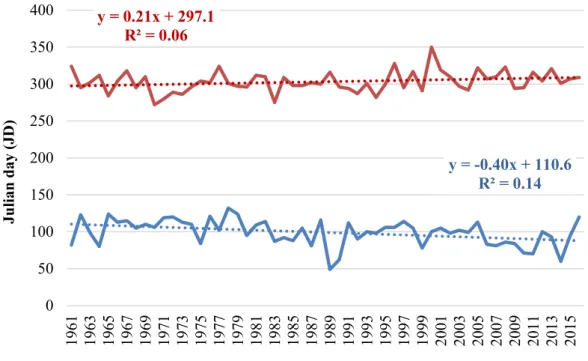
The linear, 56-year trend of the Julian day of the last frosty day in spring is significant (m=-0.40; p < 0.01), that is, these days are coming earlier (Fig. 1).
The linear trend of the first frosty days in autumn is not significant (m=0.21;
p=0.07), although the date of the onset of frosts shifted towards the end of the year.
Fig. 1 illustrates the Julian days of the last frosty days in spring (blue) and the first frosty days in autumn (red) between 1961 and 2016. According to the slope of the linear trends, the onset of autumn frost shifted forwards by 2 days (although the change is not significant), while the period of frost in spring ended an average of 4 days earlier per decade. The results of the comparison of the two time periods (1961–1990 and 1991–2016) done by a two-sample Student’s t-test regarding the last frosty day in spring (JD), the first frosty day in autumn (JD), and the days that passed between the two events are shown in Table 2.
Fig. 1. Julian days of the last days of frost days in spring (blue) and the first days of frost days in autumn (red) between 1961 and 2016 in Sopron.
Table 2. The average of the last spring frost, the first autumn frost days, and the longest frost-free period (JD), and the comparison of these indicators with a two-sample Student’s t-test between 1961-1990 and 1991–2016 in Sopron
Indicator Average
t (df=54) p 1961–1990 1991–2016
Julian day (JD) of the last frost in spring 103 95 1.66 0.10 Julian day (JD) of the first frost in autumn 300 307 -1.71 0.09 The length of the longest uninterrupted frost-free period
(day) 197 211 -2.27 0.03
McCabe et al. (2015) got the same result by examining the temperature data collected from more than 500 stations throughout the United States.
According to this data, in the past decades (1920–2012), the last frosty day in spring occurred earlier, while the first frosty day in autumn occurred later.
y = -0.40x + 110.6 R² = 0.14 y = 0.21x + 297.1
R² = 0.06
0 50 100 150 200 250 300 350 400
1961 1963 1965 1967 1969 1971 1973 1975 1977 1979 1981 1983 1985 1987 1989 1991 1993 1995 1997 1999 2001 2003 2005 2007 2009 2011 2013 2015
Julian day (JD)
Years
Although neither the Julian day (JD) of the last frost in spring, nor the Julian day (JD) of the first frost in autumn differ significantly (p>0.05) according to the two-sample Student’s t-test, the length of the longest uninterrupted frost-free period within a year is significantly longer (p<0.05) by approximately two weeks in the more recent period (1991–2016) compared to the period 1961–1990.
In the following, we introduce three indicators regarding the returning frost in spring and three indicators in autumn.
Spring indicators:
− the starting point of a frost-free period (JD) longer than 12 days preceding a period of frost (frost-free (spring)>12-start);
− the length of a frost-free period (day) longer than 12 days preceding a period of frost (frost-free (spring)>12-lenght);
− the frequency and length of a period of frost (day) following a frost- free period longer than 12 days.
Autumn indicators:
− the starting point of a frost-free period (JD) longer than 12 days following a period of frost (frost-free (autumn)>12-start);
− the length of a frost-free period (day) longer than 12 days following a period of frost (frost-free (autumn)>12-lenght);
− the frequency and length of a period of frost (day) preceding a frost- free period longer than 12 days.
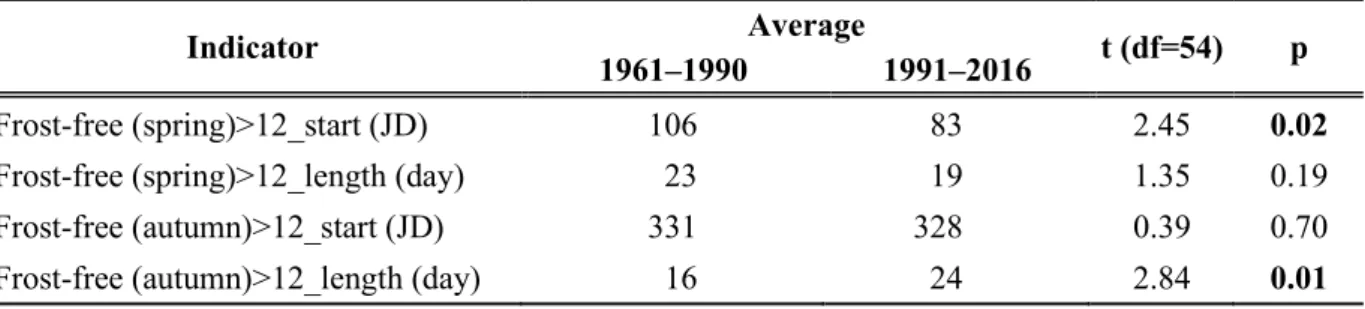
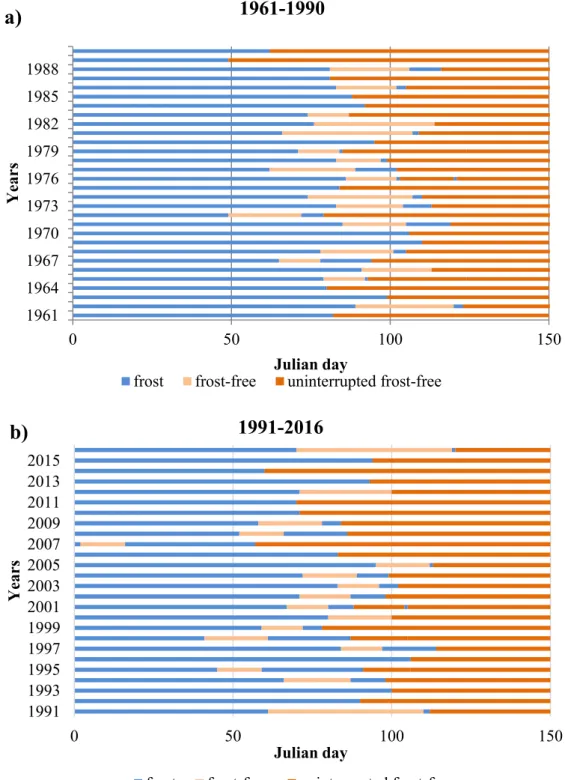
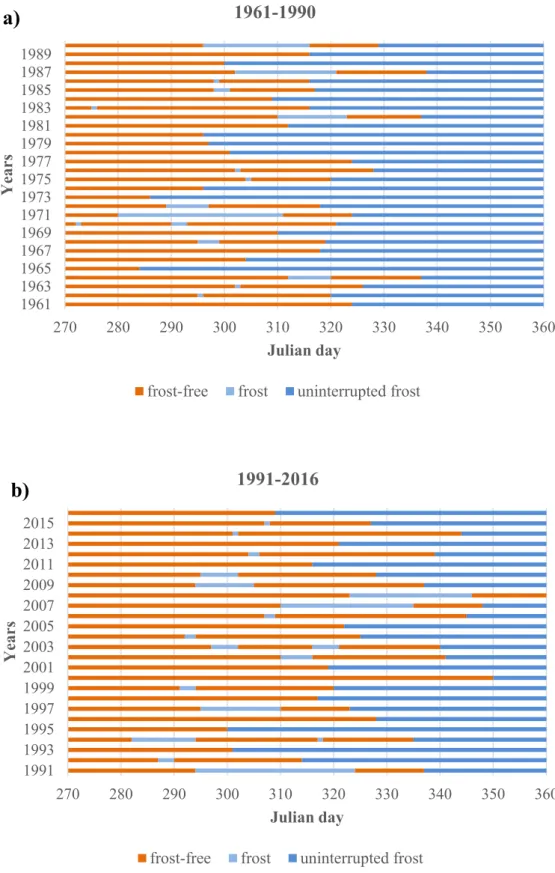
In the first 30 years of the examined period (Fig. 2a), the first frost-free period longer than 12 days happened after the 105th Julian day on average, (which was followed by another frosty period), while in the 26 years of the more recent period (Fig. 2b), the first frost-free period happened right after the 82nd Julian day on average. The difference is significant (p<0.05, Table 3). The lengths of frost-free periods (day) longer than 12 days following a period of frost did not change significantly (p=0.19).
Table 3. The average of the start and length of the frost-free period longer than 12 days prior to the spring frost period; the average of the start and length of the frost-free period longer than 12 days after the autumn frost period; and the comparison of these indicators with a two-sample Student’s t-test for the 1961-1990 and 1991–2016 periods
Indicator Average
t (df=54) p 1961–1990 1991–2016
Frost-free (spring)>12_start (JD) 106 83 2.45 0.02
Frost-free (spring)>12_length (day) 23 19 1.35 0.19
Frost-free (autumn)>12_start (JD) 331 328 0.39 0.70
Frost-free (autumn)>12_length (day) 16 24 2.84 0.01
Fig. 2. Frost-free periods longer than 12 days preceding frost in spring period in Sopron:
a) between 1961–1990 and b) 1991–2016.
In the spring time of the reference period, returning frost occurred six times after a second frost-free period longer than 12 days. The lengths of these frosty periods were 1, 1, 1, 2, 7, and 16 days, respectively. In the more recent period,
0 50 100 150
1961 1964 1967 1970 1973 1976 1979 1982 1985 1988
Julian day
Years
1961-1990
frost frost-free uninterrupted frost-free
a)
0 50 100 150
19911993 19951997 19992001 20032005 20072009 20112013 2015
Julian day
Years
1991-2016
frost frost-free uninterrupted frost-free
b)
the number of such periods were 4 and the length of these periods were 8, 26, 32, and 41 days, respectively. Although the frequency of these periods does not differ significantly (z=0.5; p=0.65), their lengths in the recent period exceeded one week every time, so they pose a more serious risk.
In case of plantations, a persistently low temperature below zero after a frost-free period longer than 12 days can cause frost damage, which may lead to a decline in crop quantity, crop quality and increased production costs due to prolonged use of anti-frost methods (Dami et al, 2015). According to Warmund et al. (2008), a disruption of plant growth caused by spring frost is not only detrimental to the plant growth and reproduction, but it can also lead to a huge economic loss.
Note that in Figs. 2 and 3, preceding the periods of refrost, we only indicated the frost-free periods longer than 12 days. In the case of shorter frost- free periods, we depicted them as the uninterrupted frosty days.
As for the autumn period, the starting point of a frost-free period (JD) longer than 12 days following a period of frost did not change significantly (p=0.70), however, the lengths of such frost-free periods changed significantly compared to the reference period (1961–1990, Table 3, p<0.05).
The periods of frost in the more recent period (Fig. 3b) have shifted towards the end of the year and, compared to the reference period between 1961 and 1990 (Fig. 3a), the frost-free periods disrupt the continuity of the periods of frost typically in the last two months (after Julian Day 300) of the year.
Although the extent of frost damage is significantly more frequent in spring than in autumn, it is important to analyze the days of frost in autumn, because the frost resistance of crops depends on the number and intensity of frosty days occurring during the long endodormancy phenophase (Lakatos et al., 2017).
By quantifying the changes that happened during the past two climate cycles, we detected that, while in the reference period the beginning of the frost- free periods longer than 12 days is on the 331st day of the year on average, in the more recent period it is on the 328th day of the year (Table 3). The change is not significant (p>0.05). The average length of a frost-free period longer than 12 days in the reference period (16 days) became longer (24 days) in the more recent period, and the difference is significant (p<0.05, Table 3).
In autumn, considering the periods of frost between two frost-free periods longer than 12 days, we detected no significant differences between the two climatic cycles regarding their lengths and frequencies.
The frequency of frost-free periods longer than 12 days prior in spring (1961–1990: 18; 1991–2016: 17) do not differ significantly in the two climate cycles (z=0.42; p=0.68).
Fig. 3. Frost-free periods longer than 12 days following frost in autumn period in Sopron (between 1961–1990 and 1991–2016).
270 280 290 300 310 320 330 340 350 360
19611963 19651967 19691971 19731975 19771979 19811983 19851987 1989
Julian day
Years
1961-1990
frost-free frost uninterrupted frost
a)
270 280 290 300 310 320 330 340 350 360
1991 19931995 1997 19992001 2003 20052007 2009 20112013 2015
Julian day
Years
1991-2016
frost-free frost uninterrupted frost
b)
4.2. Winter frosts with different intensities
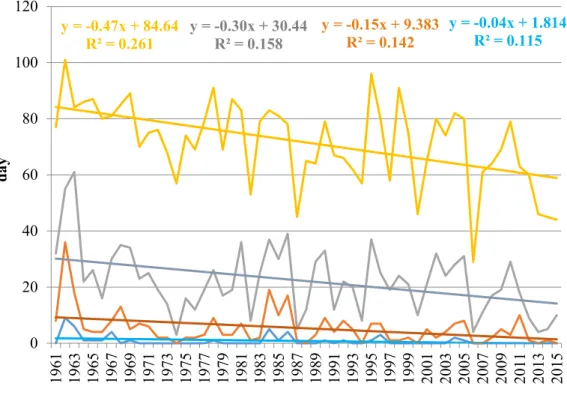
During the analyzed 56 years, with regards to the frequency of frosty days, a significant difference was detected in the winter season (between October 16 and February 28): the decrease of the number of frosty days with a minimum temperature below -15 °C is significant (p<0.05) in the past 56 years, the number of such days decreased by 0.5 day per decade (Fig. 4; Table 4). The number of days with a minimum temperature below -10 °C decreased more dramatically, the number of such days decreased by 1.5 days per decade, the change is significant (p<0.05; Fig. 4; Table 4). The number of days with a minimum temperature below -5 °C decreased significantly (p<0.05), by 3 days per decade, while the number of frosty days with a minimum temperature below 0 °C decreased significantly (p<0.01), by 4.5 days per decade (Fig. 4; Table 4).
These changes can partly lead to longer growing seasons, the decrease of length of the dormancy period and the decrease of mortality rates of pests. The significantly increasing temperature in winter can set out new conditions for Hungarian farmers (Horváth et al., 2017).
Fig. 4. Frequency of frosts with different intensities (day) (1961–2016).
y = -0.04x + 1.814 R² = 0.115 y = -0.15x + 9.383
R² = 0.142 y = -0.30x + 30.44
R² = 0.158 y = -0.47x + 84.64
R² = 0.261
0 20 40 60 80 100 120
1961 1963 1965 1967 1969 1971 1973 1975 1977 1979 1981 1983 1985 1987 1989 1991 1993 1995 1997 1999 2001 2003 2005 2007 2009 2011 2013 2015
day
Years
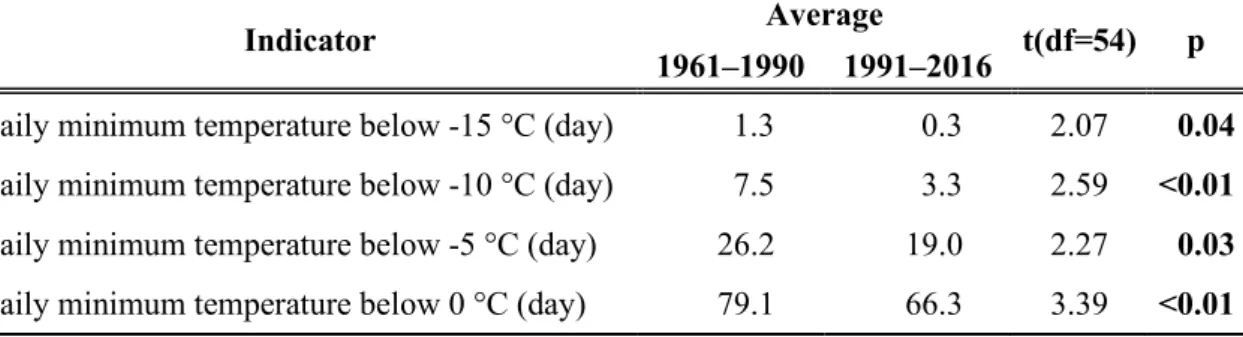
Table 4. The average of the frequency of frost of different intensities in winter (between October 16 and February 28) (1961–2016) and the comparison of these indicators with a two-sample Student’s t-test for the 1961–1990 and 1991–2016 periods.
Indicator Average
t(df=54) p 1961–1990 1991–2016
daily minimum temperature below -15 °C (day) 1.3 0.3 2.07 0.04 daily minimum temperature below -10 °C (day) 7.5 3.3 2.59 <0.01 daily minimum temperature below -5 °C (day) 26.2 19.0 2.27 0.03 daily minimum temperature below 0 °C (day) 79.1 66.3 3.39 <0.01
4.3. Spring frosts
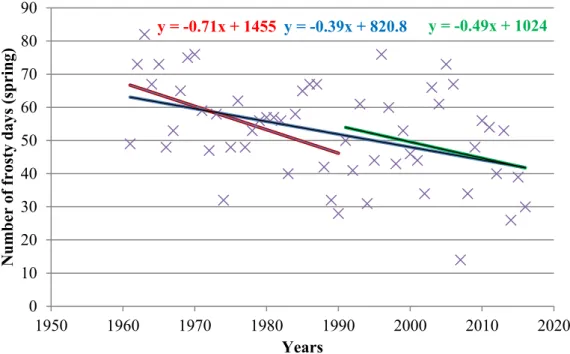
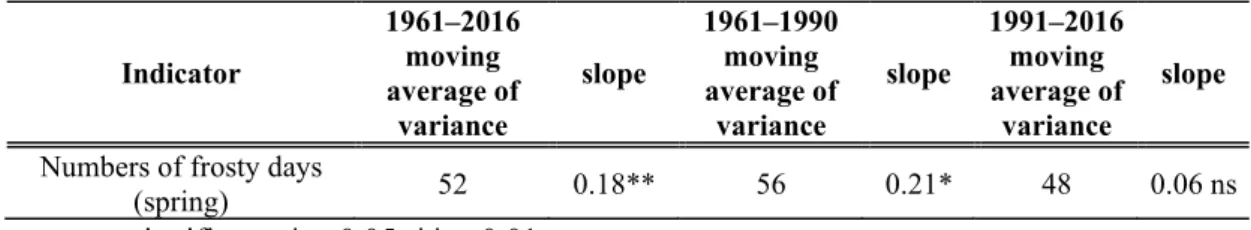
The frequency of frosty days in spring decreased significantly in the period between 1961 and 2016 (p<0.01; Table 1, Figs. 5 and 6). The moving averages of the variance of the numbers of frosty days in spring with a 9-day window shows a significant increase in the analyzed 56-year-long time period (p<0.01;
Table 5) with a scale of 1.5 days per decade (Fig. 6). This tendency can be seen in the case of both (reference and more recent) climate cycles with significant trend in the reference period (p<0.05) while with not significant trend in the recent time interval, although the increase is not significant (p>0.05; Table 5). These results mean increasing uncertainty of annual frequency of frosts and, as a consequence, the difficulties of plant protection.
This means that, according to the changes that happened during the two climate cycles, the number of frosty days decreased (blue) by nearly 4 days per decade in the spring period. This change means a 7-day (red) per decade decrease in the reference period and a 5-day (green) per decade decrease in the more recent period. These changes can be seen in Fig. 5.
Fig. 5. The number of frosty days in the spring period under the three examined time zones (1961–2016, 1961–1990, 1991–2016) in Sopron.
Fig. 6. The moving averages of the variances of the numbers of frosty days in spring with a 9-day window (1961–2016) in Sopron.
y = -0.71x + 1455 y = -0.39x + 820.8 y = -0.49x + 1024
0 10 20 30 40 50 60 70 80 90
1950 1960 1970 1980 1990 2000 2010 2020
Number of frosty days (spring)
Years
y = 0.15x + 9.681 R² = 0.346
0 2 4 6 8 10 12 14 16 18 20
1965 1967 1969 1971 1973 1975 1977 1979 1981 1983 1985 1987 1989 1991 1993 1995 1997 1999 2001 2003 2005 2007 2009 2011
Variance of frosty days (nap)
Years
Table 5. The moving averages and the variances of the numbers of frosty days in spring with a 9-day window (1961–2016, 1961–1990, 1991–2016) in Sopron, together with their linear trends
Indicator
1961–2016 moving average of
variance
slope
1961–1990 moving average of
variance
slope
1991–2016 moving average of
variance
slope Numbers of frosty days
(spring) 52 0.18** 56 0.21* 48 0.06 ns
ns: not significant; *p<0.05, **p<0.01
5. Conclusions
In our study, first the lengths of uninterrupted frost-free periods were discussed, and it was found that in two-thirds of the past 26 years, they have increased to more than 200 days per year. The change during the two analyzed climate cycles is significant. This increase is in relation to the shift of the last frosty day to earlier in spring and the shift of the first frosty day to later in autumn. Although we have not seen any significant changes in the alteration of these two indicators, the difference is still unfavorable, taking other signs of climate change into consideration; i.e., the so-called “false spring” at the end of the winter, which can cause the early development of plants followed by a frost, thus leading to problems in development and loss of crops (Ma et al., 2019).
In this context, Unterberger et al. (2018) draws attention to the vulnerability of crops, according to which an early blooming followed by a cold period (spring frost) can disrupt the growing season in the early spring.
We also considered the frost-free periods both in spring and autumn.
Considering the examined climate cycles, we could see a significant change during the spring. According to our results, it can be concluded that in the past few decades, frost formed often after gradually longer frost-free periods, thus causing disruption in the plant development.
There is also a significant difference in the appearance of frost-free periods longer than 12 days preceding a refrost between the two climate cycles, that is, in the more recent climate cycle, a long frost-free period often appeared even in March. However, there is no significant difference in the frequencies of periods of frost longer than 12 days, so the frequency of such periods in the more recent period is similar to that of the reference period.
As for the number of frosty days with different intensities, it can be generally stated that over the past 56 years, the number of days with
temperatures below
-15 °C, -10 °C, -5 °C, and 0 °C has decreased. In the winter period, the change is significant in every case.
At the same time, it can be concluded that the number of frosty days in spring shows a decreasing tendency. That change, with regards to the two climate cycles, is significant. However, this declining rate does not exclude the possibility of major hazard events (i.e., late spring frosts). Our expectations coincide with the conclusion of Mosedale et al. (2015) that, according to the HadCM3 climate model, the risk of late spring frosts will increase before bud burst.
Our results are supported by the results of the National Climate Change Strategy of Hungary, according to which, the number of frosty days will decrease significantly in the future due to the warming tendency: from an average of 96 days in the reference period (1961–1990), by 18–19 days until
2021–2050, by 32–55 days until 2071–2100. The decrease of the frequency of frosty days will
likely affect every region of Hungary.3
A northward shift of the zone limit can be expected in viticulture and in the wine industry, meanwhile negative climatic effects (frost, water stress, sunburn, infections), decrease of grapevine lifetime, and decline in quantity and quality of wine may occur. In order to prevent the above-mentioned problems, the role of forecasts in meteorology with plant protection warning becomes more important in the future. Modifications in the variety structure may also become necessary in the future (Szenteleki et al., 2012).
Aknowledgement: This work was supported by the Human Resources Development Operational Program under grant number EFOP-3.4.3-16-2016-00012.
References
Apáti, F., 2013: A tavaszi fagykárok elleni védekezés lehetőségei a gyümölcstermesztésben, Gyümölcsösök védelme. Agrofórum Extra 24: 48. 56–60. Paper: 1, 5. (In Hungarian)
https://www.farmit.hu/sites/default/files/documents/agroforum/ApatiF_2013jan_gyumi.pdf Bois B., Moriondo M., and Jones, G.V., 2014: Thermal risk assessment for viticulture using monthly
temperature data. Xth International Terroir Congress, Tokaj, Eger, Hungary, 227-232.
Dami, I.E., Li, S., Bowen, P.A., Bogdanoff, C.P., Shellie, K.C., and Willwerth, J., 2015: Foliar Applied Abscisic Acid Increases ‘Chardonnay’ Grapevine BudFreezing Tolerance during Autumn Cold Acclimation. Hort Technol. 25, 293–305.https://doi.org/10.21273/HORTTECH.25.3.293 Dunkel, Z. and Kozma, F., 1981: A szőlő téli kritikus hőmérsékleti értékeinek területi eloszlása és
gyakorisága Magyarországon. Légkör 26 (2), 13–15. (In Hungarian)
Felkai, B.O. and Varga, T. (szerk.), 2010,: Az Egyedi- és Összkockázatú Agrárbiztosítások Hazai és Nemzetközi Gyakorlata. Agrárgazdasági Információk 2010. 5.
Fila, G., Gardiman, M., Belvini, P., Meggio, F. and Pitacco, A., 2014: A comparison of different modelling solutions for studying grapevine phenology under present and future climate scenarios. Agric.Forest Meteorol. 195–196, 192–205.
3http://www.kormany.hu/download/f/6a/f0000/N%C3%89S_2_strat%C3%A9gia_2017_02_27.pdf
Hajdu, E. and Saskői B.-né, 2009: Abiotikus stresszhatások a szőlő életterében Agroinform Kiadó, Budapest.
Horváth, D., Fazekas I., and Keszthelyi, S., 2017: Phthorimaea operculella (Zeller, 1873), first record of an invasive pest in Hungary (Lepidoptera, Gelechiidae). Acta Phytopathologica et Entomologica Hungarica, 52, 117–122. https://doi.org/10.1556/038.52.2017.006
Jones, G.V. and Davis R.E., 2000: Climate influences on grapevine phenology, grape composition, and wine production and quality for Bordeaux, France. Am. J. Enol. Vitic. 51, 249–261.
Kemény, G., Varga, T., Fogarasi, J., Kovács, G., and Tóth, O., 2011: A hazai mezőgazdasági biztosítási rendszer problémái és továbbfejlesztésének lehetőségei. Agrárgazdasági Könyvek.
Agrárgazdasági Kutató Intézet, Budapest. http://repo.aki.gov.hu/296/1/ak_2010_07.pdf (In Hungarian)
Keményné, Horváth Z., Péter, K., Zubor-Nemes, A., Kiss, A., Lőrincz, K., and Kóti, A., 2017: Az agrár- kockázatkezelési rendszer működésének értékelése 2016. (in Hungarian)
http://repo.aki.gov.hu/2734/1/2017_06_AI_Kockazat%20web_pass.pdf
Lakatos, L., Molják, S., and Nagy, R., 2017: Analyzes of autumnal, winter and spring frost damage at the wine regions of Hungary. Aerulsi Apa. Componenteale Mediului, 69–76.
https://doi.org/10.24193/AWC2017_09
Leolini, L., Moriondo, M., Fila, G., Costafreda-Aumedes, S., Ferrise, R. and Bindi, M., 2018: Late spring frost impacts on future grapevine distribution in Europe. Field Crops Res. 222, 197–208.
Ma, Q., Huang, J.G., Hänninen, H., and Berninger, F., 2019: Divergent trends in the risk of spring frost damage to trees in Europe with recent warming. Glob. Change Boil. 25, 351–360.
https://doi.org/10.1111/gcb.14479
McCabe, G.J., Betancourt, J.L., and Feng, S., 2015: Variability in the start, end, and length of frost‐
free periods a cross the conterminous United States during the past century. Int. J. Climatol. 35, 4673–4680.https://doi.org/10.1002/joc.4315
Meier, M., Fuhrer, J., and Holzkämper, A., 2018: Changing risk of spring frost damage in grapevines due to climate change? A case study in the Swiss Rhone Valley. Int. J. Biometeorol. 62, 991–
1002. https://doi.org/10.1007/s00484-018-1501-y
Mosedale, J.R., Wilson, R.J., and Maclean, I.M., 2015: Climate change and crop exposure to adverse weather: changes to frost risk and grapevine flowering conditions. PloSone 10(10), e0141218.
https://doi.org/10.1371/journal.pone.0141218
Ministry of National Development, 2017: The Second Climate Change Strategy of Hungary (NCCS-2) https://www.kormany.hu/download/f/6a/f0000/N%C3%89S_2_strat%C3%A9gia_2017_02_27.pdf Oláh, L., 1979: Szőlészek zsebkönyve. Mezőgazdasági Kiadó, 38–42. (In Hungarian)
Szenteleki, K., Gaál, M., Ladányi, M., Mézes, Z., Szabó, Z., Zanathy, G., and Bisztray, Gy., 2011: A klímaváltozás hatásai a Közép-magyarországi régió szőlő-, meggy- és cseresznyetermesztésére és a termésbiztonságra. Agrárinformatikai tanulmányok III. 3, 113–150. (In Hungrian)
Szenteleki, K., Gaál, M., Mézes, Z., Szabó, Z., Zanathy, G., Bisztray, Gy., and Ladányi, M., 2012:
Termésbiztonsági elemzések a Közép-magyaroroszági régióban a klímaváltozás tükrében. A szőlő-, a cseresznye-, és a meggytermelés helyzete és jövőképe. In: Fenntartható fejlődés, élhető régió, élhető települési táj 1. Budapesti Corvinus Egyetem, Budapest, 173–203. (In Hungarian) Unterberger, C., Brunner, L., Nabernegg, S., Steininger, K.W., Steiner, A.K., Stabentheiner, E., and
Truhetz, H., 2018: Spring frost risk for regional apple production under a warmer climate.
PloSone, 13(7).https://doi.org/10.1371/journal.pone.0200201
Vitasse, Y. and Rebetez, M., 2018: Unprecedented risk of spring frost damage in Switzerland and Germany in 2017. Climatic Change, 149, 233–246. https://doi.org/10.1007/s10584-018-2234-y Warmund, M.R., Guinan, P., and Fernandez, G., 2008: Temperatures and cold damage to small fruit crops
a cross the eastern United States associated with the April 2007 freeze. Hort Sci. 43, 1643–1647.
https://doi.org/10.21273/HORTSCI.43.6.1643
Zanathy, G., 2008: Gondolatok a klímaváltozás szőlőtermesztésre gyakorolt hatásáról, Agro napló 12(2) 92–94. (In Hungarian)