DOI:10.28974/idojaras.2020.4.1
IDŐJÁRÁS
Quarterly Journal of the Hungarian Meteorological Service Vol. 124, No. 4, October – December, 2020, pp. 427–445
Projected temperature changes in Kolašin (Montenegro) up to 2100 according to EBU-POM and ALADIN regional
climate models
Dragan Burić* and Miroslav Doderović
Department of Geography Faculty of Philosophy, Niksic
University of Montenegro
Cetinjski put 2, 81000 Podgorica, Montenegro
*Corresponding author E-mail: buric.d@ucg.ac.me (dragan.buric@meteo.co.me) (Manuscript received in final form January 30, 2020)
Abstract This paper deals with the temperature projections of two regonal climate models, actually three scenarios by 2100: the A2 scenario of the EBU-POM model and the RCP4.5 and RCP8.5 scenarios, the latest projections of the ALADIN model. Kolašin was chosen, because the altitude of the place is the average height of the northern region of Montenegro (about 1000 m). A total of 22 temperature parameters for the period 2011–
2100 were analyzed. The upward trend of projected seasonal and annual (TY, TYx, and TYn) mean, mean maximum, and mean minimum temperatures by 2100 is very significant.
According to the RCP4.5 and RCP8.5 scenarios, in 2011-2100, the trend of projected mean winter (TW) temperatures will be from 0.2to 0.37 °C per decade, and the trend of projected mean summer (TSu) temperatures will be from 0.24 to 0.54 °C per decade. Compared to the base period (1981–2010), the average annual temperature in 2071–2100 is expected to be higher than 2.2 (RCP4.5) to 3.6 °C (A2 and RCP8.5). Also, by the end of the 21st century, a significant increase in the number of summer and tropical days (SD and TD) together with a decrease in the number of frost and ice days (FD and ID) are expected.
During the instrumental period, a temperature higher than 37°C was not recorded.
According to projections, in the late 21st century, in summer, maximum temperatures of 40 °C are possible, even in the milder variant (RCP4.5) scenario. According to projections of the used models, Kolašin and the northern region of Montenegro expect a warmer future with more frequent extreme temperatures in a positive direction.
Key-words: temperature, projections, EBU-POM, ALADIN, scenarios A2, RCP4.5, RCP8.5, Kolašin, Montenegro
1. Introduction
Since the mid-20th century, the Mediterranean region has recorded a significant rise in air temperature. Also the Mediterranean Sea registers an increase in the surface water temperature. Satellite data indicate that from 1985 to 2006, the increase in surface water temperature was slightly more intense in the eastern than in the western regions of the Mediterranean Sea. The maximum increase in water temperature, 0.16 °C per year, was recorded in June in the Adriatic, Ligurian, and Tyrrhenian Seas (Nykjaer, 2009). The increase in temperature has led to greater evaporation causing an increase in dryness in the Iberian Peninsula in the last five decades (Vicente-Serrano et al., 2014).
Projections for the 21st century indicate that the Mediterranean (Mostafa et al., 2019) and southeastern parts of Europe (Hochman et al., 2018a) will be affected by significant warming and precipitation. According to the RCP8.5 scenario for the Eastern Mediterranean, it is projected that at the end of the 21st century, the duration of the synoptic summer will be 49% longer, and the synoptic winter will be shorter by 56% (Hochman et al., 2018b). As a result of the many contrasts (the collision of air masses from the north and the south, land-sea-atmosphere interactions, relief disaggregation), the Mediterranean region is often chosen to test new regional climate modeling tools (Sevault et al., 2014; Nabat et al., 2015).
Based on the model ensemble, both scenarios (RCP4.5 and RCP8.5) predict that Mediterranean Europe and the northeastern parts of the continent will heat up most intensively during the 21st century. In the Mediterranean area, annual rainfall is expected to decrease by up to 25% (Jacob et al., 2014). However, studies show that in Western Europe, the trend of temperature rise in 1950-2008 was much faster than projected by individual models (Van Oldenborgh et al., 2009). The expected rise in temperature and the likely increase in dryness in the Mediterranean region are thought to have serious consequences on ecosystems and local populations (Lelieveld et al., 2016; Bucchignani et al., 2018).
The Intergovernmental Panel on Climate Change (IPCC, 2014) points out that the human impact on climate is clear, primarily in the form of increased concentrations of greenhouse gases in the atmosphere. The fifth IPCC report, as previous reports, says that many regions of the world have recorded changes in the intensity and frequency of extreme weather events such as: droughts, floods, extreme temperatures, heat waves, stormy weather followed by the hail, heavy short-term rains, etc. It is also noted that the increased incidence of extreme weather events should also be possible during the 21st century, but significant regional variations are expected, especially with regard to precipitation.
According to the IPCC, among other things, the entire Mediterranean region, the
According to an extensive study by the French National Alliance for the Environment (Alliance nationale de recherche pour l'environnement – AllEnvi), the Mediterranean is one of the most vulnerable regions to climate change in the world. GCM and RCM simulations for the Mediterranean region indicate that the trend of warming and drying is likely to continue in the future, but that there are uncertainties in the spatial distribution, especially in precipitation (AllEnvi, 2016). That is why the mentioned study emphasizes the importance of research on smaller spatial units – subregions and individual locations of the Mediterranean. A similar observation is made in the study by Giorgi (2006) and Adloff et al. (2015).
The first four reports of the Intergovernmental Panel on Climate Change (IPCC) used SRES emission scenarios (Nakicenovic et al., 2000). The IPCC Fifth Assessment Synthesis Report (IPCC, 2014) uses the results of regional climate models. RCMs use the so-called representative concentration pathways (RCPs), which take climate change mitigation and adaptation into account and define the increase in radiation energy depending on the CO2 concentration trend by 2100 (Moss et al., 2010).
RCPs take into account different mixtures of greenhouse gas and aerosol emissions on the one hand and climate protection measures on the other.
Scenarios RCP2.6, RCP4.5, RCP6.0, and RCP8.5 are in use, and the number in the suffix indicates the radiation sensitivity with respect to the pre-industrial period. RCP2.6 is a scenario indicating a slight variant of energy gain (2.6 W/m2), RCP4.5 is a moderate scenario (energy increase of 4.5 W/m²), RCP6.0 is a moderately high variant (6.0 W/m²), and RCP8 .5 is an extreme or very high variant that takes into account the heating of an 8.5 W/m² air-conditioning system. The main difference between the extreme scenarios is that the RCP8.5 variant implies economic growth based on fossil fuel combustion, while the RCP2.6 is optimistic as it takes into account global climate protection efforts.
According to the RCP4.5 scenario, which is in line with the 2015 Paris Agreement, the average global temperature will rise by 1.6 °C by the end of the century (range between 1.1 and 2.6 °C), and according to RCP8.5, which takes into account the current trend CO2, the average rise in global temperature will be around 3.7 °C (2.6–4.8 °C). A comparative overview of the SRES and RCP emission scenarios is in Table 1 (Chimani et al., 2016).
The main objective of this research is to analyze several temperature parameters according to the projections of two regional climate models (RCMs), the EBU-POM and ALADIN models for scenarios A2, RCP4.5, and RCP8.5.
The used models will be discussed in more detail in subtitle 2.2. After the introductory part (Section 1), the research area, databases, and methodology (Section 2) are described, the results of the EBU-POM model for A2 scenario and of the ALADIN model for RCP4.5 and RCP8.5 simulations are presented in Section 3, followed by the discussion (Section 4) and conclusion (Section 5).
Table 1. Comparison of SRES and RCP emission scenarios (Source: Chimani et al., 2016)
SRES RCP Description (by 2100):
A2 RCP8.5 A2: Constant population increase, further economic growth, regional, slower technological change than in other scenarios.
RCP8.5: Over 1370ppm CO2 equivalent concentration by 2100.
A1B RCP6.0 A1B: Increased economic growth, slower population growth, usage of new and more efficient technologies, reduction of regional income disparities, balanced usage of all energy sources (not too dependent on a particular energy source), etc.
RCP6.0: Slower greenhouse radiation effect growth, around 850 ppm CO2
equivalent concentration by 2100
B1 RCP4.5 B1: Global population peak in the mid-21st century, followed by a decrease, rapid change in economic structures towards the development of services and information technologies, introduction of a clean economy and clean energy sources, global environmental, economic, and social sustainability, etc.
RCP4.5: The rise in CO2 emissions peaks around 2040, then the emission decreases, and in 2100 the atmospheric concentration of greenhous gases will be about 650 ppm CO2-equivalent.
2. Research area, models used, databases and methodology 2.1. Research area
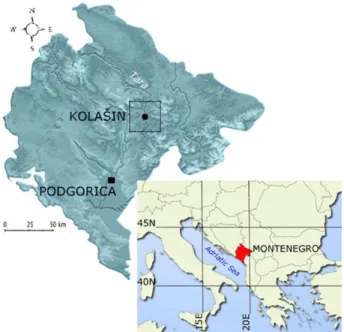
Montenegro is a Mediterranean country. Covering an area of 13 812 km2 it belongs to Southeastern Europe (Western Balkans), extending over 100 km (air distance) to the Adriatic Sea. The study covers the area of Kolašin, a town which belongs to the northern region of Montenegro. The main factors that influence the formation of the Kolašin climate are: its latitude, air currents, and relief.
The urban area is located at 1000 m above sea level while the weather station is at 944 m above sea level (Burić et al., 2013). According to the Köppen climate classification, the urban areas and lower terrains have characteristics of moderately continental climate (climate formula Csbx '), while higher mountain areas have characteristics of moderately cold climate(climate formula D) (Burić et al., 2014). Kolašin is located in the upper part of the Tara River valley, surrounded by mountain ranges of Sinjajevina and Bjelasica, whose peaks exceed 2000 m (Fig. 1).
Fig. 1. Location of Montenegro in the Mediterranean region and Kolašin in Montenegro (Kolašin: latitude = 42049'22''N, longitude = 19031'4''E, altitude = 944 m)
2.2. Models used
Djurdjevic and Rajkovic (2010) developed a dynamically adapted RCM for the Mediterranean region of Europe, EBU-POM model. It is a fully coupled atmospheric-ocean model. The atmospheric part of the model is a version of the state-of-the-art atmospheric model ETA of tje National Centers for Environmental Protection (NCEP), and the ocean part is the Princeton Ocean Model (POM). Based on the results of future climate change scenarios obtained by EBU-POM, a database was created for individual parts and locations for Mediterranean Europe. The oceanic part of the model covers the area of the Mediterranean Sea, but without the Black Sea. The horizontal resolution of EBU-POM model is 25 km, while in the vertical direction the model has 32 levels. The EBU-POM model for initial and boundary simulation conditions uses the results of the ECHAM5 global climate model (GCM) (Roeckner et al., 2003), together with the MPI-OM ocean model. Professor Đurđević completed the correlation for the A2 scenario and gave us the data for the grid field to which Kolašin belongs.
The Institute of Meteorology and Climatology of the University of Natural Resources and Life Sciences, Vienna (BOKU-Met) evaluated the available regional climate change projections (EURO-CORDEX, MED-CORDEX) comparing them with observational data, and generated an ensemble of bias- corrected climate change scenarios for the Western Balkan Region. For bias
correction BOKU-Met developed and used a program called ICC-OBS Tool (Formayer et al., 2019). Bias correction algorithms are based on observations, and the model data is modified so that its statistical properties become the same as those of observations. The climate change signals are calculated with reference to the period 1981–2010. After numerous corrections, from June 2019, data for the Western Balkans National Meteorological Services are available through the Climate Change Center Austria (CCCA).
Studies have shown that ALADIN-Climat v5, developed in CNRM/Météo- France, can be successfully used for Central and Eastern Europe, and for temperature and precipitation simulations in the Balkans, where Bulgaria were considered as an evaluation area (Farda et al., 2010). It can also be used for the Balkans and the Apennines (Spiridonov and Valcheva, 2019), as well as for the Morocco area (Tramblay et al., 2013). Related to that and for the purposes of this study, RCM ALADIN data, which uses the GCM CNRM-CM5 results as boundary and lateral conditions, were also analyzed. The resolution of the Aladin model is 0.11° (about 12.5 km).
2.3. Database and methodology
For the purposes of this study, the data of two RCMs and three scenarios were considered. The data for Kolašin's EBU-POM model for scenario A2 were obtained from Professor Djurdjevic (author of the model).The ALADIN model data for RCP4.5 and RCP8.5 scenarios for Kolašin were obtained from the Climate Change Center Austria (CCCA). Based on historical observational data for Kolasin, simulations were made for the base period 1981–2010, and projections were given for the period 2011–2100 based on these simulations. In accordance with the horizontal resolution of the models used, the projected data refer to the grid field to which Kolašin belongs.
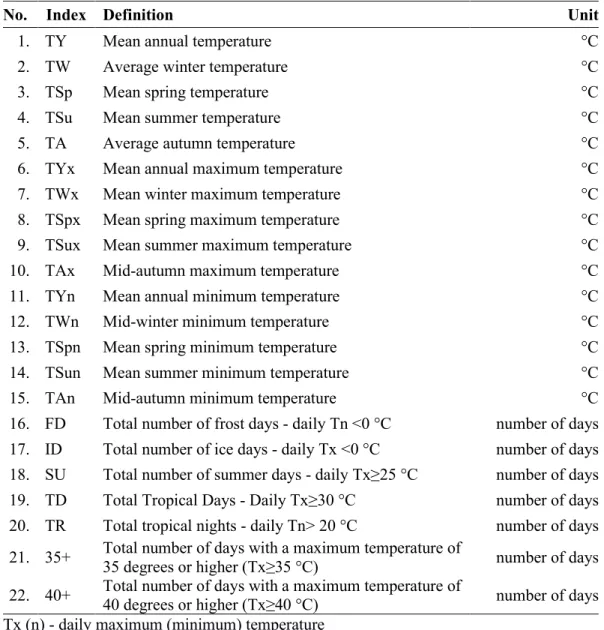
The trend was calculated by the Sen method, and its significance was tested by the Mann-Kendall test. Importance of tendency was tested at the risk level of p<0.001, p<0.01, p<0.05, and p<0.1 (the degree of accuracy of the hypothesis of 99.9%, 99%, 95% and 90%). A total of 22 temperature parameters were considered in this study (Table 2).
The climatic period 1981–2010 was taken as reference (base) period, and the results of simulation of the projected temperature in Kolašin were given for the period 2011–2100. The 30-year periods for the 21st century were separated, and for each the mean value, i.e., the deviation from the base period (1981–
2010) was calculated. In addition the trend for the period 2011–2100 was also calculated.
Table 2. Abbreviations, definitions, and units of the used temperature parameters
No. Index Definition Unit
1. TY Mean annual temperature °C
2. TW Average winter temperature °C
3. TSp Mean spring temperature °C
4. TSu Mean summer temperature °C
5. TA Average autumn temperature °C
6. TYx Mean annual maximum temperature °C
7. TWx Mean winter maximum temperature °C
8. TSpx Mean spring maximum temperature °C
9. TSux Mean summer maximum temperature °C
10. TAx Mid-autumn maximum temperature °C
11. TYn Mean annual minimum temperature °C
12. TWn Mid-winter minimum temperature °C
13. TSpn Mean spring minimum temperature °C
14. TSun Mean summer minimum temperature °C
15. TAn Mid-autumn minimum temperature °C
16. FD Total number of frost days - daily Tn <0 °C number of days 17. ID Total number of ice days - daily Tx <0 °C number of days 18. SU Total number of summer days - daily Tx≥25 °C number of days 19. TD Total Tropical Days - Daily Tx≥30 °C number of days 20. TR Total tropical nights - daily Tn> 20 °C number of days 21. 35+ Total number of days with a maximum temperature of
35 degrees or higher (Tx≥35 °C) number of days 22. 40+ Total number of days with a maximum temperature of
40 degrees or higher (Tx≥40 °C) number of days Tx (n) - daily maximum (minimum) temperature
3. Results
3.1. Results of the EBU-POM model for A2 scenario
According to the A2 projections of the EBU-POM model scenario, the mean annual temperature (TY) will be higher by 0.5 °C in the period 2011–2040, by 1.7 °C in 2041–2070, and by 3.6 °C in 2071–2100 compared to the base period (1981–2010). At the seasonal level, the most intense increase of mid-winter (TW) and mid-summer (TSu) temperatures is expected. In qualitative terms, the same results were obtained for both the annual mean maximum (TYx) and minimum (TYn) temperatures. According to these projections, a more intense increase of the maximum than the minimum temperature is expected. It is noted that the further the future goes, the more intensively the temperature increases.
Thus, the most intense increase in temperature is expected for the last 30-year period (2071–2100). Compared to the base period (1981–2010), projections indicate that TYn will be 3.8 °C higher, while TYx will be 5.0 °C higher in 2071–2100. The expected increase in the summer temperature parameters in Kolašin in the period 2071–2100, according to the A2 scenario, will be the following: TSu will be higher by 3.6 °C, TSun by 3.5 °C, and TSux by 5.4 °C (Table 3). If these projections do come true, by the end of the 21st century, Kolašin will be extremely hotter than nowadays.
Table 3. Projections of mean annual and seasonal temperatures (°C) for 2100 in Kolašin, relative to the 1981–2010 base period, based on the A2 scenario of the EBU-POM model
T (°C) Base period A2 scenario
Avg.T 1981–2010 2011–2040 2041–2070 2071–2100
TY 7.4 +0.5 +1.7 +3.6
TW –1.1 +1.1 +2.1 +3.8
TSp 6.5 +0.6 +1.2 +3.0
TSu 14.9 +0.8 +1.6 +3.6
TA 7.7 +0.4 +1.4 +3.2
Avg.Tn 1981–2010 2011–2040 2041–2070 2071–2100
TYn 2.3 +0.6 +1.8 +3.8
TWn –5.0 +1.3 +2.5 +4.2
TSpn 1.3 +0.5 +1.1 +2.9
TSun 8.5 +0.9 +1.6 +3.5
TAn 2.8 +0.5 +1.6 +3.5
Avg.Tn 1981–2010 2011–2040 2041–2070 2071–2100
TYx 14.0 +0.6 +2.2 +5.0
TWx 3.5 +1.3 +2.3 +4.3
TSpx 12.7 +0.8 +1.6 +4.1
TSux 22.9 +1.1 +2.3 +5.4
TAx 14.7 +0.6 +1.8 +4.4
Avg.T – average; Avg.Tn(Tx) – average max (min) temperature
Also, days with characteristic temperatures indicate a warmer future. In 2011–2040, the annual number of summer days (SU) will be 9.1 days higher than in the base period. During 2041–2070, the projected average annual number
base period. In the last 30-year period (2071–2100), there will be about 50 tropical days (50.3 TD), more than in the base period. After 2070, tropical nights (TR) are possible in Kolašin, which is 1 tropical night in certain years. During the instrumental period, days with a maximum temperature above 35 °C were rarely recorded. However, the projected number of days with a maximum temperature above 35 °C (35+) in 2071–2100 is about 12–13 days a year.
During the instrumental measurement period (1949–present), no temperature of 40 °C or higher (40+) was recorded in Kolašin. However, projections show that after 2070, summer maximum daily temperatures above 40 °C will be possible, one day per year. On the other hand, frost and ice days (FD and ID) will occur less frequently by 2100. In the average year, Kolašin registers about 122 FD, and projections for the period 2071–2100 indicate that this number will decrease by as much as 59.5 days (Table 4).
Table 4. Projections of the annual number of days with temperatures above fixed thresholds by 2100 in Kolašin, relative to the 1981–2010 base period, based on the A2 scenario of the EBU–POM model
Number Base period A2 scenario
days 1981–2010 2011–2040 2041–2070 2071–2100
SU 44.3 +9.1 +29.2 +66.9
TD 5.1 +4.6 +17.7 +50.3
TR 0.0 0.0 0.0 +0.5
ID 17.6 –0.4 –7.4 –12.7
FD 122.1 –14.0 –29.9 –59.5
35+ 0.2 0.0 +1.4 +12.7
40+ 0.0 0.0 0.0 +0.5
The trend component is the basic direction of movement of a given climate element and an excellent indicator of changes over a longer period of time.
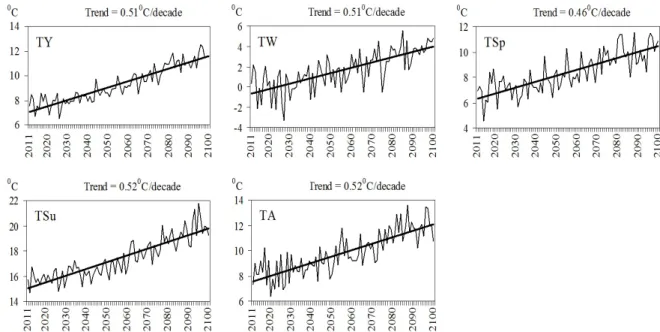
Therefore, the trend of individual air temperature parameters was calculated for the purposes of the study. The calculations show that the trend of temperature increase is fairly uniform: from 0.46 °C (TSp) to 0.52 °C (TSu and TA) per decade. The tendency for an increase in projected mean temperature during the 21st century is significant at the highest level of confidence (p<0.001): 99.9% of the level of acceptance of the hypothesis, both annually and seasonally (Fig. 2).
By the end of the 21st century, the expected trend of increase in the mean annual temperature (TY) mean winter temperature (TW)is 0.51 °C per decade.
Fig. 2. Trend of the mean temperatures: annual (TY), winter (TW), spring (TSp), summer (TSu) and autumn (TA), at the significance level of p<0.0001, in Kolašin in the period 2011–2100 based on the A2 scenario of the EBU-POM model.
A trend project for the average annual minimum and maximum temperatures (TYn and TYx) in 2011–2100 is statistically very significant (risk of accuracy 0.001). The trend of increasing TYx (0.72 °C per decade) is more pronounced than TYn (0.52 °C per decade) (Fig. 3).
Fig. 3. Trend of the projected average annual minimum (TYn) and maximum (TYx)
3.2. Results of the ALADIN model for RCP4.5 and RCP8.5 scenarios
Recently, RCMs have been using RCP scenarios. Following current trends, the results of the ALADIN model are given below for the same temperature parameters, which were examined by the EBU-POM model in the previous section. A moderate variant (RCP4.5) was also considered, not only an extreme (RCP8.5) as in the previous model (A2). According to the RCP4.5 scenario, all temperature parameters show a warmer future. Therefore, even in a moderate scenario, the temperature in Kolašin is expected to increase by the end of the 21st century. In the period 2071–2100, the projected mean spring temperature (TSp) will be 2.4 °C higher than in the base period and the mean autumn (TA) will be higher by 1.9 °C (Table 5, left). For the same period (2071–2100), projections indicate that both maximum and minimum temperatures will rise the fastest in spring – TSpn by 2.6 °C and TSpx by 2.3 °C compared to the base period (1981–2010).
Table 5. Projections of the mean annual and seasonal temperatures (0C) by 2100 in Kolašin, relative to the 1981–2010 base period, based on the RCP4.5 and RCP8.5 scenarios of the CNRM-ALADIN53 model
T (0C) Base
period Scenario RCP4.5 Scenario RCP8.5
Avg.T 1981–
2010 2011–
2040 2041–
2070 2071–
2100 2011–
2040 2041–
2070 2071–
2100
TY 9.3 +0.7 +1.4 +2.2 +0.8 +2.1 +3.6
TW 0.8 +0.8 +1.2 +2.0 +0.9 +2.0 +3.2
TSp 8.0 +0.9 +1.2 +2.4 +1.0 +2.2 +3.7
TSu 18.0 +0.9 +1.9 +2.2 +0.9 +2.1 +4.2
TA 10.4 +0.3 +1.2 +1.9 +0.5 +2.0 +3.2
Avg.Tn 1981–2010 2011–
2040 2041–
2070 2071–
2100 2011–
2040 2041–
2070 2071–
2100
TYn 4.6 +0.7 +1.4 +2.2 +0.8 +2.1 +3.7
TWn –3.0 +0.8 +1.2 +1.9 +0.7 +1.8 +2.9
TSpn 3.4 +0.9 +1.2 +2.6 +0.8 +2.4 +3.9
TSun 12.4 +0.9 +1.9 +2.3 +1.0 +2.3 +4.4
TAn 5.7 +0.2 +1.2 +1.9 +0.7 +2.0 +3.3
Avg.Tn 1981–2010 2011–
2040 2041–
2070 2071–
2100 2011–
2040 2041–
2070 2071–
TYx 13.9 +0.7 +1.4 +2.1 +0.9 +2.0 2100+3.5
TWx 4.6 +0.9 +1.3 +2.1 +1.0 +2.1 +3.4
TSpx 12.5 +0.8 +1.1 +2.3 +1.1 +2.1 +3.6
TSux 23.6 +0.9 +1.8 +2.2 +0.9 +1.9 +3.9
TAx 15.0 +0.3 +1.2 +1.9 +0.4 +1.9 +3.1
T- Avg.T - average temperature; Avg.Tn(Tx) - average max (min) temperature
The more extreme variant (RCP8.5) is expected to have a more intense temperature rise in Kolašin. In 2071–2100, according to the estimates of the RCP8.5 scenario, the summer temperature will grow the most rapidly: TSu will be higher by 4.2°C, TSun by 4.4 °C, and Tsux by 3.9 °C compared to the base period (Table 5, right). Thus, estimates indicate that the minimum temperature will grow more intensively than the maximum temperature. The only exception is the mean winter maximum temperature (TWx), which will under this scenario than that of increase (+3.4 °C) have a higher the mean winter minimum (TWn) temperature (+2.9 °C) in 2071–2100.
Comparing the results of A2 and RCP8.5 scenarios for the period 2071–
2100, the projections of the EBU-POM model give a higher increase in the mean maximum temperatures (TYx, TWx, TSpx, TSux, and TAx) compared to the ALADIN model. When it comes to the mean and average minimum temperature for the mentioned period (2071–2100), the EBU-POM model gives a slight increase only in spring and summer compared to the ALADIN RCP8.5 scenario.
At annual level, as well as in winter and autumn, the situation is reversed.
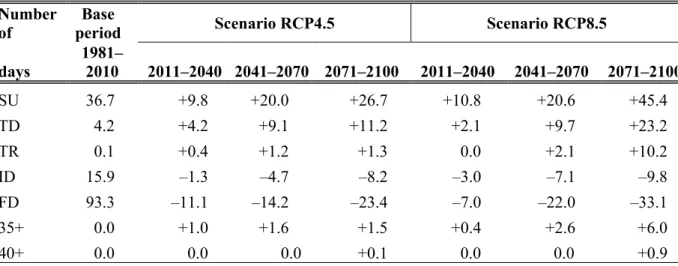
Specific day projections also indicate a warmer future, even under the RCP4.5 scenario. The moderate scenario (RCP4.5) estimates that in 2011–2040, the average number of summer days (SUs) will increase by 9.8 days compared to the base period (1981–2010). In 2041–2070, the number of SUs will be increased by about 20, and in the period 2071–2100 by 26.7 days. The number of tropical days and nights (TD and TR) is also expected to increase, followed by days with a maximum temperature above 35 °C and 40 °C (35+ and 40+).
The expectation of a warmer future is also indicated by the decrease in the number of ice and frost days (ID and FD). According to the RCP4.5 scenario, for the period 2071–2100, the average annual FD number will be 23.4 days lower than in the base period (Table 6).
Table 6. Projections of the annual days with temperatures above fixed thresholds by 2100 in Kolašin, relative to the 1981–2010 baseline period, based on the RCP4.5 and RCP8.5 scenarios of the CNRM-ALADIN53 model
Number
of Base
period Scenario RCP4.5 Scenario RCP8.5
days 1981–
2010 2011–2040 2041–2070 2071–2100 2011–2040 2041–2070 2071–2100
SU 36.7 +9.8 +20.0 +26.7 +10.8 +20.6 +45.4
TD 4.2 +4.2 +9.1 +11.2 +2.1 +9.7 +23.2
TR 0.1 +0.4 +1.2 +1.3 0.0 +2.1 +10.2
ID 15.9 –1.3 –4.7 –8.2 –3.0 –7.1 –9.8
ALADIN's more extreme RCP8.5 scenario predicts more intense changes to the days mentioned. According to this scenario, in the last 30–year period of the 21st century (2071–2100), the number of SUs is expected to be 45.4 days more than in the base period. In the period 2071–2100, RCP4.5 predicts 1–2 days with a temperature of 35+ per year, and RCP8.5 predicts about 6 such days. It has already been mentioned that for the period 2071–2100, according to the A2 scenario, the average annual number of days with a temperature of 35+ is expected to be twofold of the number calculated by the RCP8.5 projections. In most other specific days, more intensive changes are expected under the A2 scenario than under RCP8.5.
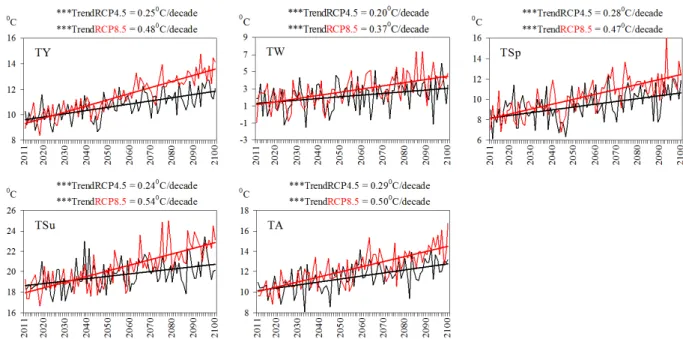
In 2011–2100, the average annual temperature increase is expected to be 0.25 °C per decade according to the RCP4.5 scenario, or 0.48 °C per decade according to RCP8.5. At the seasonal level, according to the RCP4.5 scenario, a more intense trend of increasing mean temperatures is expected in spring and autumn (TSp and TA) than in winter and summer (TW and TSu). For the period 2011–2100, the expected trend is 0.28 °C increase for TSp and 0.29 °C for TA per decade, while the projected TW and TSu are 0.20 °C and 0.24°C per decade, respectively (Fig. 4). According to the more extreme variant (RCP8.5), by the end of the 21st century, a more intense upward trend in TSu and TA (0.54 °C and 0.50 °C per decade) is expected than in TW and TSp (0.37 °C and 0.47 °C per decade). The projections of both scenarios (RCP4.5 and RCP8.5), according to the Mann-Kendall test, indicate that we should expect a significant trend of temperature increase for the observed period (2011–2100), both on annual and seasonal levels. Even the RCP4.5 scenario projects a 99.9% (p<0.001) positive momentum level by the end of the 21st century.
Fig. 4. Trend of average temperatures:: annual (TY), winter (TW), spring (TSp), summer (TSu), and autumn (TA), at the significance level of p<0.0001, in Kolašin in the period 2011–2100 based on the RCP4.5 and RCP8.5 scenario of CNRM-ALADIN53 model.
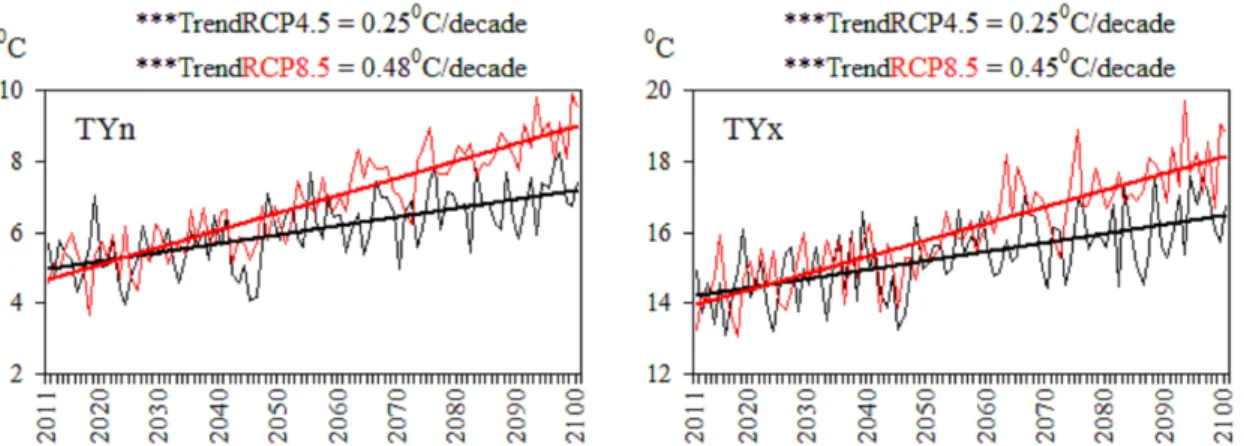
Also, projections of both scenarios indicate that a significant upward trend in mean annual maximum and minimum temperatures should be expected by 2100. According to the milder variant (RCP4.5), the mean annual minimum (TYn) and maximum (TYx) temperatures increase at a trend rate of 0.25 °C per decade (Fig. 5). A more extreme scenario (RCP8.5) predicts a slightly more intense increase in TYn than TYx (0.48 °C and 0.45 °C per decade, respectively). In this case too, the A2 scenario predicts a more intense upward trend in TYn and TYx relative to RCP8.5, which was not to be expected given that RCP8.5 is a slightly more extreme variant than A2 SRES scenario.
Fig. 5. Trend of projected average annual minimum (TYn) and maximum (TYx) temperatures in Kolašin, period 2011–2100, (Significance: ***p<0.001), RCP4.5 and RCP8.5 scenario CNRM-ALADIN53 model
The recorded absolute maximum temperature in Kolašin during the instrumentation period (1949–2019) is 37.1 °C and it was measured on August 23, 2012. According to A2 projections of the EBU-POM model scenario, the maximum temperature up to 43.8°C is possible by the end of the 21st century.
The measured absolute minimum is –29.8 °C (registered January 13, 1985) and can be reduced to –32.1 °C by A2 scenario estimates. RCP scenarios give minor changes in temperature. According to RCP8.5, the projected absolute maximum temperature is 41.8°C and the absolute minimum is –19.1 °C (Table 7).
Table 7. Absolutely lowest and highest temperature in Kolašin registered and projected Registered Projections to 2100
T (°C) (1949–2019) A2 RCP4.5 RCP8.5
4. Discussion
Surveys for Montenegro, a spatially and population-small country belonging to the Mediterranean, show that in the second half of the 20th and the beginning of the 21st century, there was a significant trend of temperature increase (Burić et al., 2018; 2019). The results of the temperature projection in Kolašin (northern part of Montenegro) presented in this paper indicate a warmer future.
The results for neighboring Serbia show that the period 2071–2100 will be warmer by 2 and 4°C for the A1B and A2 scenarios with respect to 1971–2000, respectively. It is likely that the number of TD will increase, while the total number of FD will decrease in the future. A shorter duration of the frost period and a longer duration of dry and vegetation periods over the Serbian region is expected (Kržič et al., 2011).
Not only in Serbia, but throughout the Western Balkans, temperatures are expected to increase during the 21st century. Djurdjevic et al. (2019) point out that at the end of the 21st century (2071–2100), the projected average annual temperature in the Western Balkans will be higher than 2 to 5.5 °C in relation to the 1971–2000 base period, depending on the selected scenario and part of the region. According to the NMMB model projections for the RCP8.5 scenario, the average increase in mean annual temperature over the period 2071–2100 is approximately 5.5 °C in most of the Western Balkans. Concerning precipitation, the results obtained by the aforementioned authors show that annual precipitation will have a negative tendency by the end of the 21st century in most of the Western Balkans, and in some areas the expected decrease may be up to –40% compared to the 1971 reference period –2000.
The uncertainty of climate models, both global (GCM) and RCM, has been considered in many papers (Michaels et al., 2002; Laprise et al., 2008;
Holtanová et al., 2010, 2014; Kirtman et al., 2013; Solman, 2016; Sanderson et al., 2017; Belda et al., 2017; Ongoma et al., 2018). Holtanová et al. (2019) point out that projections and interpretations of past and future climate change will be increasingly complicated, as there are significant differences in the results of both GCM and RCM between the two scenarios. When it comes to modeling, perhaps the best is Box's (1979) interpretation i.e., there is no exact model, but they are all useful.
In other words, modeling the climate future based on its current state is the only tool that indicates what can happen if we do not take care of the environment. That is why projections should be taken seriously. Modeling is improving day by day, different models and scenarios give different results. That is why our aim was to present the results of the latest climate simulations for the Western Balkans in this paper, using the example of temperature projections for the grid field to which Kolasin belongs (referring to RCP scenarios).
5. Conclusion
Montenegro is part of the Mediterranean and Southeastern Europe, that is, the Western Balkans, regions and subregions that are among the most vulnerable to climate change. This paper aimed to determine the magnitude and significance of the potential temperature change in Kolašin (north of Montenegro) according to projections of two models (EBU-POM and ALADIN), respectively, of three scenarios (A2, RCP4.5 and RCP8.5). All three scenarios give a significant increase in temperature by the end of the 21st century. Compared to the base period (1981–2010), projections indicate that the average annual temperature in 2071–2100 will be higher than +2.2 (RCP4.5) to + 3.6 °C (A2 and RCP8.5).
RCP8.5 is a slightly more extreme variant compared to the A2 SRES scenario. However, with the many temperature parameters considered for Kolašin, the A2 scenario predicts more intense changes than RCP8.5, which was not expected. For example, in 2071–2100, according to the A2 scenario, the annual average of SU and TD numbers will be +66.9 and +50.3 days higher than the base period, while RCP8.5 projects +45.4 and +23.2 days.This suggests that RCP scenarios are more reliable than SRES, which is logical because they have twice the resolution (better) than A2 (RCP = 12.5 km, A2 = 25 km).
In any case, the results of the study of several temperature parameters presented in this paper show that the Kolašin climate tends to become warmer with more frequent higher both maximum and minimum temperatures. These results can help decision makers take some mitigation and adaptation measures to potential climate change in the future, and generally environmental intervention. Montenegro is a small country and small economy, which has no impact on the global climate. But the slogan '' work locally, think global '' should be kept in mind. Therefore it is necessary to reduce the use of fossil fuels and switch to clean energy sources. As a Mediterranean country, Montenegro has significant potential for the use of solar energy.
Acknowledgements: The authors thank Professor Djurdjevic and IHMSM, or CCCA Data Center for the necessary data for this study.
References
Adloff, F., Somot, S., Sevault, F., Jordà, G., Aznar, R., Déqué, M., Herrmann, M., Marcos, M., Dubois, C., Padorno, E., Alvarez-Fanjul, E. and Gomis, D., 2015: Mediterranean Sea response to climate change in an ensemble of twenty first century scenarios. Clim. Dyn. 45, 2775–2802.
https://doi.org/10.1007/s00382-015-2507-3
AllEnvi, (ed.), 2016: The Mediterranean region under climate change. Paris: IRD Editions, https://horizon.documentation.ird.fr/exl-doc/pleins_textes/divers16-11/010068463.pdf
Bucchignani, E., Mercogliano, P., Panitz, H.J., and Montesarchio, M., 2018: Climate change
Burić, D., Ducić, V., and Mihajlović, J., 2013: The climate of Montenegro: Modificators and types – part one. Bull. Serbian Geograph. Soc. 93(4), 83–102. https://doi.org/10.2298/GSGD1304083B
Burić, D., Ducić, V. and Mihajlović, J., 2014: The climate of Montenegro: Modificators and types – part two. Bull. Serbian Geograph. Soc. 94(1), 73–90.
https://doi.org/10.2298/GSGD1401073B
Burić, D.B, Dragojlović, J.M, Milenković, M.Đ, Popović, Lj.Z., and Doderović, M.M., 2018: Influence of variability of the East Atlantic Oscillation on the air temperature in Montenegro. Thermal Sci.
22(1 Part B), 759–766.https://doi.org/10.2298/TSCI170710211B
Burić, D., Dragojlović, J., Penjišević-Sočanac, I., Luković, J., and Doderović, M., 2019: Relationship Between Atmospheric Circulation and Temperature Extremes in Montenegro in the Period 1951–2010. In: (eds. Leal Filho W., Trbic G., Filipovic D.) Climate Change Adaptation in Eastern Europe. Climate Change Management. 29–42. Springer.
https://doi.org/10.1007/978-3-030-03383-5_3
Belda, M., Holtanová, E., Kalvová, J., and Halenka, T., 2017: Global warming-induced changes in climate zones based on CMIP5 projections. Clim. Res. 71, 17–31. https://doi.org/10.3354/cr01418
Box, G.E.P., 1979: Robustness in the strategy of scientific model building. In (Ed. Robert L. Launer and G.N. Wilkinson). Robustness in Statistics, Army Research Office in Research Triangle Park, North Carolina: Elsevier, 201–236. https://doi.org/10.1016/B978-0-12-438150-6.50018-2 Chimani, B., Heinrich, G., Hofstätter, M., Kerschbaumer, M., Kienberger, S., Leuprecht, A., Lexer, A.,
Peßenteiner, S., Poetsch, M.S., Salzmann, M., Spiekermann, R., Switanek, M., and Truhetz, H., 2016: ÖKS15 – Klimaszenarien für Österreich. Daten, Methoden und Klimaanalyse.
Projektendbericht, CCCA, Wien. https://hdl.handle.net/20.500.11756/06edd0c9
Djurdjevic, V. and Rajkovic, B., 2010: Development of the EBU-POM coupled regional climate model and results from climate change experiments. In (Eds: T.D. Mihajlovic and Lalic B) Advances in Environmental Modeling and Measurements, Nova Publishers.
http://haos.ff.bg.ac.rs/climatedb-srb/model.html
Djurdjevic, V., Trbić, G., Krzic, A. and Bozanic, D., 2019: Projected changes in multi-day extreme precipitation over the Western Balkan region. In (eds. Leal Filho W, Trbic G, Filipovic D.) Climate change adaptation in Eastern Europe. Climate Change Management. 15–28. Springer, Cham. https://doi.org/10.1007/978-3-030-03383-5_2
Farda, A., Déué, M., Somot, S., Horányi., A, Spiridonov., V. and Tóth, H., 2010: Model ALADIN as regional climate model for Central and Eastern Europe. Studia Geophysica et Geodaetica, 54, 313–332. https://doi.org/10.1007/s11200-010-0017-7
Formayer, H., Wind, M., and König B., 2019: ClimaProof - Ensemble of Bias-Corrected Climate Change Scenarios. Methodical Background V2.0. Project ClimaProof - Deliverable 1.2.2.
https://github.com/boku-met/climaproof-docs/find/master
Giorgi, F., 2006: Climate change hot-spots. Geophys. Res. Lett. 33(8), L08707.
https://doi.org/10.1029/ 2006gl025734
Hochman, A., Harpaz, T., Saaroni, H., and Alpert, P., 2018a: Synoptic classification in 21st century CMIP5 predictions over the Eastern Mediterranean with focus on cyclones. Int. J. Climatol. 38, 1476-1483. https://doi.org/10.1002/joc.5260
Hochman, A., Harpaz, T., Saaroni, H., and Alpert, P., 2018b: The seasons’ length in 21st century CMIP5 projections over the eastern Mediterranean. Int. J. Climatol. 38, 2627–
2639. https://doi.org/10.1002/joc.5448
Holtanová, E., Kalvová, J., Mikšovský, J., Pišoft, P. and Motl, M., 2010: Analysis of uncertainties in regional climate model outputs over the Czech Republic. Studia Geoph. Geod. 54, 513–
528. https://doi.org/10.1007/s11200-010-0030-x
Holtanová, E., Kalvová, J., Pišoft, P., and Mikšovský, J., 2014. Uncertainty in regional climate model outputs over the Czech Republic: the role of nested and driving models. Int. J. Climat. 34, 27–
35. https://doi.org/10.1002/joc.3663
Holtanová, E., Mendlik, T., Koláček, J., Horová, I., and Mikšovský, J., 2019: Similarities within a multi-model ensemble: functional data analysis framework. Geosci. Model Dev. 12, 735–747.
https://doi.org/10.5194/gmd-12-735-2019
IPCC, 2014: Climate Change 2014: Synthesis Report. Contribution of Working Groups I, II and III to the Fifth Assessment Report of the Intergovernmental Panel on Climate Change (Core Writing Team, RK Pachauri and LA Meyer (eds.)). IPCC, Geneva, Switzerland, 151 pp.
Jacob, D., Petersen, J., Eggert, B., Alias, A., Christensen, O.B., Bouwer, L.M., Braun, A., Colette, A., Déqué, M., Georgievski, G., Georgopoulou, E., Gobiet, A., Menut, L., Nikulin, G., Haensler, A., Hempelmann, N., Jones, C., Keuler, K., Kovats, S., Kröner, N., Kotlarski, S., Kriegsmann, A., Martin, E., van Meijgaard, E., Moseley, C., Pfeifer, S., Preuschmann, S., Radermacher, C., Radtke, K., Rechid, D., Rounsevell, M., Samuelsson, P., Somot, S., Soussana, J.F., Teichmann, C., Valentini, C., Vautard, R., Weber, B., and Yiou, P., 2014: EURO-CORDEX: new high- resolution climate change projections for European impact research. Reg. Environ. Change 14, 563–578.https://doi.org/10.1007/s10113-013-0499-2
Kržič, A., Tošić, I., Djurdjević, V., Veljović, K., and Rajković, B., 2011: Changes in climate indices for Serbia according to the SRES-A1B and SRES-A2 scenarios. Clim. Res. 49, 73–86.
https://doi.org/10.3354/cr01008
Kirtman, B., S.B. Power, J.A. Adedoyin, G.J. Boer, R. Bojariu, I. Camilloni, F.J. Doblas-Reyes, A.M.
Fiore, M. Kimoto, G.A. Meehl, M. Prather, A. Sarr, C. Schär, R. Sutton, G.J. van Oldenborgh, G.J., Vecchi, G. and Wang, H.J., 2013: Near-term Climate Change: Projections and Predictability. In: Climate Change 2013: The Physical Science Basis. Contribution of Working Group I to the Fifth Assessment Report of the Intergovernmental Panel on Climate Change.
Cambridge University Press, Cambridge, United Kingdom and New York, NY, USA. 953-1028.
https://www.ipcc.ch/site/assets/uploads/2018/02/WG1AR5_Chapter11_FINAL.pdf
Laprise, R., de Elía, R., Caya, D., Biner, S., Lucas-Picher, P., Diaconescu, E., Leduc, M., Alexandru, A., and Separovic, L., 2008: Challenging some tenets of Regional Climate Modelling, Meteorol. Atmos.
Phys. 100, 3–22. https://doi.org/10.1007/s00703-008-0292-9
Lelieveld, J., Proestos, Y., Hadjinicolaou, P., Tanarhte, M., Tyrlis, E. and Zittis, G., 2016: Strongly increasing heat extremes in the Middle East and North Africa (MENA) in the 21st century. Climatic Change 137, 245–260. https://doi.org/10.1007/s10584-016-1665-6
Mostafa, A.N., Wheida, A., El Nazer, M., Adel, M., El Leithy, L., Siour, G., Coman, A., Borbon, A., Magdy, A.W., Omar, M., Saad-Hussein, A. and Alfaro, S.C., 2019: Past (1950–2017) and future (-2100) temperature and precipitation trends in Egypt. Weather Climate Extr. 26 (In pres).
https://doi.org/10.1016/j.wace.2019.100225
Moss, R.H., Edmonds, J.A., Hibbard, K.A., Manning, M.R., Rose, S.K., van Vuuren, D.P., Carter, T.R., Emori, S., Kainuma, M., Kram, T., Meehl, G.A., Mitchell, F.F.B., Nakicenovic, N., Riahi, K., Smith, S.J., Stouffer, R.J., Thomson, A.M., Weyant, J.P., and Wilbanks, T.J., 2010: The next generation of scenarios for climate change research and assessment. Nature 463, 747–756.
https://doi.org/10.1038/nature08823
Michaels, P.J., Knappenberger, P.C., Frauenfeld, O.W., and Davis, R.E., 2002: Revised 21st century temperature projections. Climat. Res. 23, 1–9.
https://www.int-res.com/articles/cr2003/23/c023p001.pdf
Nabat, P., Somot, S., Mallet, M., Sevault, F., Chiacchio, M., and Wild, M., 2015: Direct and semi- direct aerosol radiative effect on the Mediterranean climate variability using a coupled Regional Climate System Model. Climate Dynamics 44, 1127–1155.
https://doi.org/10.1007/s00382-014-2205-6
Nakicenovic, N., Alcamo, J., Davis, G., de Vries, B., Fenhann, J., Gaffin, S., Gregory, K., Griibler, A., Jung, T.Y., Kram, T., La Rovere, E.L., Michaelis, L., Mori, S., Morita, T., Pepper, W., Pitcher, H., Price, L., Riahi, K., Roehrl, A., Rogner, H.H., Sankovski, A., Schlesinger, M., Shukla, P., Smith, S., Swart, R., van Rooijen, S., Victor, N., and Dadi, Z., 2000: Special Report on Emissions Scenarios (SRES): A Special Report of Working Group III of the Intergovernmental Panel on Climate Change, Cambridge University Press, Cambridge, U.K., 599 pp., ISBN 0-521- 80493-0. Available at:http://pure.iiasa.ac.at/id/eprint/6101/1/emissions_scenarios.pdf
Nykjaer, L., 2009: Mediterranean Sea surface warming 1985-2006. Climate Res. 39, 11–17.
Roeckner, E., Bäl, G., Bonaventura, L., Brokopf, R., Esch, M., Giorgetta, M., Hagemann, S., Kirchner, I., Kornblueh, L., Manzini, E., Rhodin, A., Schlese, U., Schulzweida, U., and Tompkins, A., 2003: The atmospheric general circulation model ECHAM 5. Part I: Model description. Max Planck Institute for Meteorology, Report No. 349, 140 pp.
http://www.mpimet.mpg.de/fileadmin/publikationen/Reports/max_scirep_349.pdf
Sanderson, B.M., Wehner. M., and Knutti, R., 2017: Skill and independence weighting for multi-model assessments. Geosci. Model Dev. 10, 2379–2395.
https://doi.org/10.5194/gmd-10-2379-2017
Solman, S.A., 2016: Systematic temperature and precipitation biases in the CLARIS-LPB ensemble simulations over South America and possible implications for climate projections. Climate Res.
68, 117–136. https://doi.org/10.3354/cr01362
Sevault, F., Somot, S., Alias, A., Dubois, C., Lebeaupin-Brossier, C., Nabat, P., Adloff, F., Déqué, M., and Decharme, B., 2014: A fully coupled Mediterranean regional climate system model: design and evaluation of the ocean component for the 1980–2012 period. Tellus A: Dynam. Meteorol.
Oceanogr. 66, 23967.https://doi.org/10.3402/tellusa.v66.23967
Spiridonov, V. and Valcheva, R., 2019: A new index for climate change evaluation – An example with the ALADIN and RegCM regional models for the Balkans and the Apennines. Időjárás 123, 551–576. https://doi.org/10.28974/idojaras.2019.4.9
Tramblay, Y., Ruelland, D., Somot, S., Bouaicha, R., and Servat, E., 2013: High-resolution Med- CORDEX regional climate model simulations for hydrological impact studies: a first evaluation of the ALADIN-Climate model in Morocco. Hydrol. Earth Syst. Sci. 17, 3721–3739.
https://doi.org/10.5194/hess-17-3721-2013
van Oldenborgh, G.J., Drijfhout, S., van Ulden, A., Haarsma, R., Sterl, A., Severijns, C., Hazeleger, W., and Dijkstra, H., 2009: Western Europe is warming much faster than expected. Clim. Past.
5, 1–12. https://doi.org/10.5194/cp-5-1-2009
Vicente-Serrano, S.M., Lopez-Moreno, J.I., Beguería, S., Lorenzo-Lacruz, J., Sanchez-Lorenzo, A., García-Ruiz, J.M., Azorin-Molina, C., Morán-Tejeda, E., Revuelto, J., Trigo, R., Coelho, F. and Espejo, F., 2014: Evidence of increasing drought severity caused by temperature rise in southern Europe. Environ. Res. Lett., 9(4), 044001.
https://doi.org/10.1088/1748-9326/9/4/044001