DOI:10.28974/idojaras.2020.2.5
IDŐJÁRÁS
Quarterly Journal of the Hungarian Meteorological Service Vol. 124, No. 2, April – June, 2020, pp. 227–251
Changing climatic sensitivity and effects of drought frequency on the radial growth of Fagus sylvatica
at the xeric frontiers of Central Europe
Balázs Garamszegi*,1, Miklós Kázmér2, László Kolozs3, and Zoltán Kern 4
1Forest Research Institute
National Agricultural Research and Innovation Centre Várkerület 30/A, 9600 Sárvár, Hungary
2Department of Palaeontology and MTA-ELTE Geological Geophysical and Space Science Research Group
Eötvös Loránd University
Pázmány Péter sétány 1/C, 1117 Budapest, Hungary
3Forestry Directorate National Food Chain Safety Office Frankel Leó út 42-44, 1023 Budapest, Hungary
4Institute for Geological and Geochemical Research Research Centre for Astronomy and Earth Sciences
MTA Centre for Excellence; Budaörsi út 45, 1112 Budapest, Hungary
*Corresponding Author e-mail: balazs.garamszegi@gmail.com (Manuscript received in final form July 26, 2019)
Abstract⎯ The influence of climate on the vitality and growth of European beech (Fagus sylvatica L.) has become a focus of forest research over the last decade. Beech locally reaches its continental xeric limit in Hungary within its European distribution area, giving a unique opportunity to study the climatic sensitivity of the species, based on tree-ring analysis. A comparison of four geographically and climatically different sites is presented from Hungary, combining data collected on stand level with systematic forest inventory plots. Tree-ring width chronologies covering the past 90–100 years of the lifetime of mature and middle-aged trees and different climatic variables were used to evaluate the growth-climate relationships and recent growth trends of the selected beech stands by multivariate regression analysis. Strong relationships were found between annual radial growth and (mainly water availability related) meteorological variables of the vegetation season, exceeding previous results from elsewhere in Europe. A clear spatiotemporal variability of the growth sensitivity was also revealed, following a (climatic) gradient from the northern to the southwestern parts of the country. In the northern sites, climatic sensitivity was found to be more fluctuating, while southwestern sites facing more continuous effects of changing climatic conditions seem to show weakening correlation over time. Trends of relative basal area increments and climatic
sensitivity of growth over the past decades may be due to unfavorable climatic changes, though extreme and recurrent drought events superimposed on the long-term trends seem to have a decisive impact on growth patterns and associated resilience of beech.
Key-words: beech, climate change, drought index, tree-ring, basal area increment, xeric edge
1. Introduction
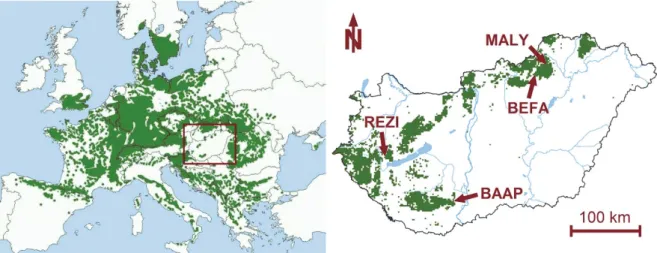
Among various other ecosystem services, forests play a decisive role in the regulation of their own environment and habitat factors, including climate on a scale ranging from stand to global (Bonan, 2008). Forests, therefore, are of key importance in the mitigation of and adaptation to climate change (e.g., Smith et al., 2014), however, they are not static systems – similarly to the climate itself –, but undergo continuous change, closely interacting with their environment (e.g., Meier et al., 2012). Changing environmental (climatic) conditions are currently posing a great challenge to forests, especially to those located at the margins of their distribution and/or with reduced ecological functionality (Mátyás, 2010). In the face of climate change induced xeric limit shifting, predicting distribution changes of beech (Fagus sylvatica L.) became a great interest to European forest science. Being a widely dominant tree species across the (intensively managed) forests of the continent (Fig. 1), a possible loss in competitiveness could raise significant ecological concerns (Geßler et al., 2007; Mátyás et al., 2010).
Although decline had already been demonstrated at places from its southern edge of distribution (Jump et al., 2006b; Peñuelas et al., 2007), the topic gained further attention following severe droughts in the early 2000s affecting major parts of Europe (Czajkowski et al., 2005; van der Werf et al., 2007; Fotelli et al., 2009; Mátyás et al., 2010; Jezík et al., 2011).
Fig. 1. Location of study sites within the range of distribution of beech (Fagus sylvatica L.) in Europe (left) and Hungary (right). The rectangle on the European distribution map marks the crop area corresponding to the country scale map. (Map sources: EUFORGEN 2009, NÉBIH 2015).
Different studies have reached different conclusions and opinions concerning the future and adaptability of beech, approaching the subject from various perspectives, including modeling, monitoring, and field experiments.
Many of the modeling results predicted a widespread beech decline in Central and Southern Europe (e.g., Czúcz et al., 2011; Stojanović et al., 2013), while others suggested a more decisive resilience to climate change and adaptive capacity (e.g., Jump et al., 2006a; van der Maaten, 2012; Tegel et al., 2014).
More complex models dealing with species migration and genetic adaptability gave more complex results, indicating a mosaic of habitats in the future at the continental xeric margins of distribution (e.g., Kramer et al., 2010).
Incorporating extreme climatic events (e.g., droughts) and their frequency in bioclimatic models can also lead to a better understanding of future beech persistence at its distribution limit (Rasztovits et al., 2014). More recent studies showed the importance of stand characteristics, associated with different forest management techniques, such as effects of species composition on stand-level drought tolerance (Mölder and Leuschner, 2014; Metz et al., 2016). Field experiments and monitoring studies, artificial drought experiments and provenance trials also provide important data to quantify the climatic adaptability of beech (e.g., Mátyás et al., 2009; Thiel et al., 2014).
Tree-ring analysis is also considered as a powerful research tool for tracking the effects of the changing habitat conditions on tree biomass production of temperate tree species. In the case of beech, these methods are particularly useful on account of the usually clear relationships between tree- ring widths and climatic factors (Dittmar et al., 2003; Lebourgeois et al., 2005). Climate sensitivity of beech has been studied on several scales in time and space also with conclusions referring to the issue of climate change and regional aspects (e.g., Čufar et al., 2008; van der Maaten, 2012; Weber et al., 2013; Garamszegi and Kern, 2014; Tegel et al., 2014; Cavin and Jump, 2016;
Hacket-Pain et al., 2016; Roibu et al., 2017). Besides interannual climatic impact on growth, longer term effects of ecological and climatic changes on radial growth were usually investigated (e.g., Piovesan et al., 2008; Gillner et al., 2013).
Contributing to the several on-going researches, the primary aims of our study were to evaluate, compare, and track any shift in growth-climate relationships over the last century and trends of growth associated with climatic changes and drought frequency in four Hungarian forest sites dominated by beech as a (mixing) tree species. Considering the special locations close to a local continental xeric edge within the European beech distribution area, an emphasized climatic sensitivity was supposed to find among the sample sites. Nevertheless, as documented changes in environmental conditions vary from site to site even within the relatively small and integrated geographical region represented by Hungary, we also searched for possible differences. We also tried to find relations to reported decisive
mortality events of beech prior to our study (Lakatos and Molnár, 2009; Janik et al., 2016) and emerging trends of drought damages in Hungarian forests (Hirka et al., 2018), including an outlook to climate indices defining the climatic needs of the species, as well.
2. Materials and methods 2.1. Study areas and climate data
Two submontane beech stands from northern Hungary (MALY, BEFA), and two sites at lower elevations in western and southern Hungary (REZI, BAAP) were selected as core study areas (Fig. 1). At all but one of the investigated stands, beech is dominant, and possible disturbances on growth due to other species are weak. At the southernmost BAAP site, the species was present only as a rare mixing species, though still in form of dominant individuals. Site characteristics, such as soil type and hydrological conditions were similar among all four sites (Table 1). Due to the modest water retention capacity of soils and limited water availability, each site depends on balanced intra-annual distribution of precipitation.
Table 1. Location of the investigated beech stands and comparison of selected site and stand characteristics
MALY BEFA REZI BAAP
coordinates 48.14°N 20.54°E 48.02°N 20.36°E
46.87°N
17.25°E 46.20°N 18.61°E
elevation a.s.l. 500 m 500 m 200 m 200 m
slope, aspect 5-20°, N 10-15°, NW 5-10°, NE 10-15°, SW soil type Cambisol/Luvisol Cambisol Cambisol Cambisol/Luvisol
soil texture loam loam sand loam
soil depth 0.5-0.9 m 0.4-0.6 m 0.6-1.0 m 0.6-1.0 m
beech mixing
ratio 85-100% 80% 70%
(overstory) <5%
main mixing
species Quercus petraea
Quercus petraea, Carpinus
betulus
Quercus cerris, Carpinus
betulus
Tilia sp., Quercus cerris, stand age
(2014) 93±15 yr 65±5 yr 86±10 yr n.a.
avg. tree height 31 m 21 m 28 m n.a.
Site climate was evaluated using gridded meteorological datasets, first of all, monthly precipitation and temperature data and 3-month standardized precipitation evaporation index (SPEI; Vicente-Serrano et al., 2010) from the CARPATCLIM project (Szalai et al., 2013). This dataset, with a spatial resolution of 0.1°x0.1°, is currently considered as the most representative gridded climate data source available for the region, but on the other hand, it covers only a relatively short, 50-year period from 1961 to 2010. For longer term investigations, the CRU TS4.01 temperature (Harris et al., 2014) and the GPCC V8 analysis precipitation (Schneider et al., 2018) datasets served with basic meteorological information for the period 1901–2016, though at a coarser (0.5°x0.5°) spatial resolution.
Besides the climatic variables above, two further types of drought indices were used to visualize long-term changes in stand climate, namely the Ellenberg quotient (EQ; Ellenberg, 1988) and the simplified forest aridity index (FAI;
Führer et al., 2011). Both indices were developed for evaluating the main climatic forest type distribution zones within Central Europe and Hungary, respectively. EQ is computed from the precipitation sum of the entire year and July mean temperature, while FAI combines monthly precipitation and temperature of the main vegetation season. Higher values of both indices represent more arid conditions. The associated climatic limit for beech is usually considered to be 30 by EQ (Ellenberg, 1988; Standovár and Kenderes, 2003) and 4.75 based on FAI (Führer et al., 2011).
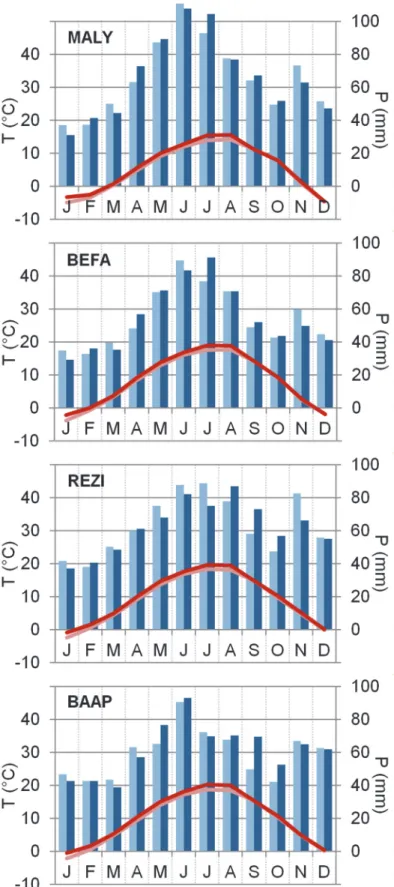
Climate diagrams of the study areas (including changes between 1961–
1985 and 1986–2010) are presented in Fig. 2 based on the CARPATCLIM data;
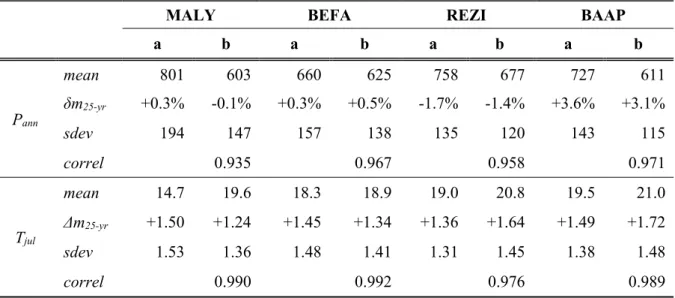
alternatively, EQ and FAI moving average time series are shown in Fig.3 comparing a climatically representative site from northern (BEFA) and western Hungary (REZI) from the beginning of the previous century (1901–2016) based on the joint CRU/GPCC data. The use of different climate datasets raises the question about representativeness and homogeneity of the results. High covariance and correlation between the two data sources (CARPATCLIM and joint CRU/GPCC; Table 2) allowed parallel use of them for well-defined purposes, though. Major differences between the mean values in the case of MALY site can be explained by bias originating in the mean elevation difference between the grid cells compared to the actual target site.
Consequently, precipitation is very likely overestimated in CARPATCLIM and underestimated in GPCC for the MALY site, while temperature is, conversely, under- and overestimated by them.
Fig. 2. Climate diagrams for the study sites, based on the CARPATCLIM dataset. Intra- annual patterns of changing climate can be tracked by comparison of the periods 1961- 1985 (light colored bars and line) and 1986-2010 (darker colors). Minimum and maximum monthly mean temperature and annual precipitation sum during the second period 1986-2010 were -4.5 °C, 15.7 °C, 803 mm at MALY; -2.2 °C, 19.0 °C, 661 mm at BEFA; -0.8 °C, 19.7 °C, 751 mm at REZI, and -0.5 °C, 20.3 °C, 741 mm at BAAP.
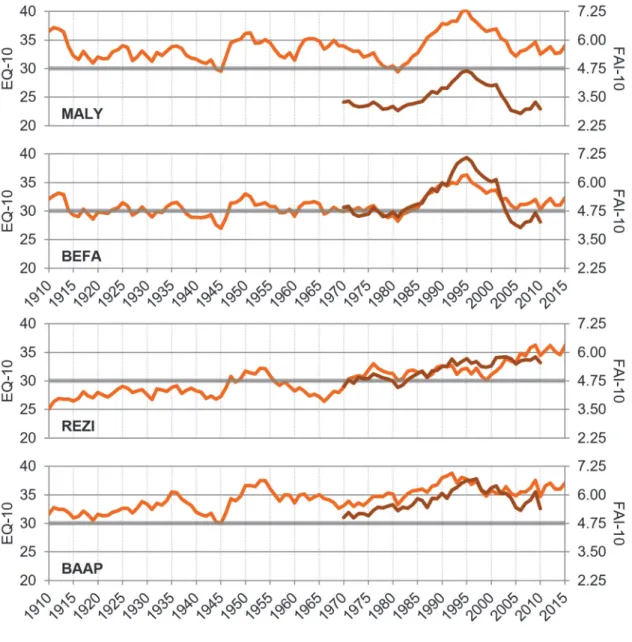
Fig. 3. Trends of EQ from the beginning of the last century (Ellenberg, 1988;
CRU/GPCC) and of the FAI index for the shorter period of 1961–2010 (Führer et al.
2011; CARPATCLIM), both smoothed by 10-year moving averages. Shaded horizontal grey line represents the hypothetical xeric limit of beech habitats, associated with each index.
Table 2. Comparison of the CARPATCLIM (a) and CRU/GPCC (b) climate datasets for the four study sites during the period 1961-2010. Basic climate variables such as annual precipitation sum (Pann; in mm) and mean temperature of July (Tjul; in °C) are compared with the use of the statistics of mean value (mean), (relative) difference between sub- periods 1961-1985 and 1986-2010 (δm25-yr/Δm25-yr), standard deviation (sdev), and the correlation (correl) between the datasets
MALY BEFA REZI BAAP a b a b a b a b
Pann
mean 801 603 660 625 758 677 727 611
δm25-yr +0.3% -0.1% +0.3% +0.5% -1.7% -1.4% +3.6% +3.1%
sdev 194 147 157 138 135 120 143 115
correl 0.935 0.967 0.958 0.971
Tjul
mean 14.7 19.6 18.3 18.9 19.0 20.8 19.5 21.0
Δm25-yr +1.50 +1.24 +1.45 +1.34 +1.36 +1.64 +1.49 +1.72
sdev 1.53 1.36 1.48 1.41 1.31 1.45 1.38 1.48
correl 0.990 0.992 0.976 0.989
2.2. Tree sampling, measurement, and data standardization
At BEFA, MALY, and REZI sites, 7–7 disc samples from freshly-cut logs and additional increment cores from 3–4 (co-)dominant trees were collected between 2010 and 2015 in multiple collection campaigns, while two disc samples and increment cores from ten dominant individuals (2 per tree) were collected at BAAP site, earlier, in 2002. Part of the REZI samples originated from a sanitary felling following drought damages, which effect will be discussed later.
Extending the sample taken from the central study areas and also to further mitigate possible bias due to differences in tree age and other unknown local disturbances, some additional cores from (co-)dominant trees were also assorted from the regular fieldwork plots coinciding with beech dominated stands of the National Forest Inventory (NFI; NÉBIH, 2016). This extension was spatially adjusted to the grid cell size of the used climate data. The increment cores were extracted at breast height (~1.3 m above ground level), while the disk samples were collected from fallen tree trunks typically from part of the log representing the 0.5 to 1.5 m height segment above the original ground level.
Samples were processed following standard dendrochronological protocols (Stokes and Smiley, 1968) and ring-width measurements were made at a resolution of 0.01 mm along two radii per each sample tree, using LINTAB measuring table and TSAP-Win 4.67 software (Rinn, 2005). Ring-width series
were cross-dated, first by visual comparison and finally checked using the COFECHA program (Holmes, 1983). The measuring and cross-dating were largely performed using the facilities of the Budapest Tree-Ring Laboratory (Kázmér and Grynaeus, 2003). Parameters of sample trees and measured variables are shown in Table 3.
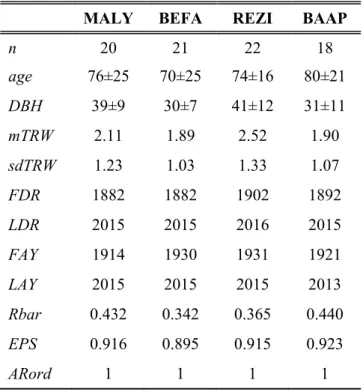
Table 3. Information on sample trees and derived tree-ring chronologies: sample depth (n); mean age (age; yrs) and breast-height stem diameter of sample trees (DBH; in cm) with their standard deviation; mean tree-ring width (mTRW; in mm) and standard deviation of tree-ring widths (sdTRW); first (FDR) and last (LDR) dated ring and first (FAY) and last (LAY) accepted years to final chronologies. FAY and LAY indicate the length of the used standard chronologies with the given mean interseries correlation (Rbar) and expressed population signal (EPS) and selected autoregression order (ARord)
MALY BEFA REZI BAAP
n 20 21 22 18
age 76±25 70±25 74±16 80±21
DBH 39±9 30±7 41±12 31±11
mTRW 2.11 1.89 2.52 1.90
sdTRW 1.23 1.03 1.33 1.07
FDR 1882 1882 1902 1892
LDR 2015 2015 2016 2015
FAY 1914 1930 1931 1921
LAY 2015 2015 2015 2013
Rbar 0.432 0.342 0.365 0.440
EPS 0.916 0.895 0.915 0.923
ARord 1 1 1 1
In order to remove age-related trend and growth disturbances due to forest dynamics, tree-ring width (TRW) measurements were detrended (Cook et al., 1990). Based on earlier comparison of multiple detrending methods (Garamszegi and Kern, 2014), we chose a 30-year cubic smoothing spline to model the growth trend of the individual series (Cook and Peters, 1981). This flexible model of non-parametric regression retains any expected interannual- subdecadal variation of the radial increments. Detrending and index calculation were processed by ARSTAN software (Cook and Krusic, 2006), deriving
individual TRW indices as a ratio between the raw measurement and modeled growth. Pre-whitened, residual versions of the produced TRW chronologies were used, with the order of the autoregressive model being selected via the Akaike information criterion (AIC) (Table 3). Variance adjustment, adapting the running window approach was applied to the derived chronologies to minimize variance bias due to changing sample replication and effects of fluctuating interseries correlation (Frank et al., 2007). The final chronologies were calculated as bi- weight robust mean of individual series. Mean basal area increments (BAI) were also derived from the raw TRW measurements, using the TSAP software. BAI was estimated for the core sites directly from tree-ring measurements along the two representative radii for stem diameter including the pith, and it was derived back from measured breast height diameter in case of NFI trees.
Signal strength of the TRW index chronologies was checked using the expressed population signal (EPS) statistics (Wigley et al., 1984; Buras, 2017).
Mean interseries correlation (Rbar) and EPS were calculated within 30-year running windows. The periods of further analysis were set between when a minimum replication of 5 sample trees occurs and where the running EPS statistics exceed the traditional 0.85 acceptance level (Wigley et al., 1984). By these means, juvenile growing phrases were also coarsely excluded from the analysis. Signal-strength statistics of the accepted periods suggest a robust signal (Table 3). The significant cross-correlations found between the site chronologies also confirm this and reveal a macroclimatic connection even between the contrasting eco-regions (Table 4).
Table 4. Cross correlation between each site tree-ring index chronologies for the common period 1931-2013. Each correlation is at p<0.01 significance level
MALY BEFA REZI BEFA 0.841
REZI 0.672 0.625
BAAP 0.528 0.581 0.666
2.3. Data processing and analysis
The evaluation of the site conditions and processing of climate indices and tree ring chronologies were followed by a preliminary Pearson correlation analysis between climatic variables of the more local CARPATCLIM dataset and TRW chronologies of core study areas. Here, monthly climate elements of the
preceding and the growing year were involved in the analysis, as suggested by previous studies (e.g., Di Filippo et al., 2007), namely monthly precipitation sums, mean temperatures and SPEI values from the previous year’s April to the growing year’s September. Statistical significance of the relationships was tested by the bootstrap response method using the ‘bootRes’ package (Zang and Biondi, 2013) under the R statistical program environment (R Development Core Team, 2014).
To identify shifts in growth-climate relationships, multivariate linear regression analysis with 31-year windows and 10-year steps was done, modeling TRW indices of the entire growth series with monthly climate records from CRU/GPCC datasets. Potential monthly climatic determinants were selected via the preliminary correlation analysis, focusing also on hypothetical main growing months, besides checking statistical significance. Coefficient of determination (R2) of the regression model was used for evaluation of decadal shifts in climate influence on growth, while (moving) partial correlation coefficients between climatic predictors and TRW indices served as indicators of intra-annual meteorological dependence of increment formation. By using the same climatic predictors for each site and periods, overparameterization of the regression models may have happened, however, this enabled a uniform handling of data and an easier direct comparison of the results. With the use of partial correlations, potential biases due to a notable degree of autocorrelation in the mean temperature of consecutive months and a frequently occurring negative correlation between temperature and precipitation during summer months were also tried to eliminate.
Finally, changing site climate and frequency of drought events were assessed using the SPEI indices (CARPATCLIM), in search of possible relations to the basal area growth in the studied four stands since 1981 and with a special focus on the REZI beech mortality case. Here, BAI chronologies were used instead of TRW, since those were found to be better approximators of total annual tree growth and so of the vitality and competitivity of trees (e.g., Jump et al., 2006b; Gillner et al., 2013). For a better comparison, relative BAI ratios were calculated for the period 1980–2010 with a reference period of 1971–1990 by each series and sites. Slopes of the individually fitted linear trends of each period were also compared.
3. Results 3.1. Changing stand climate
During the latter half of the 20th and first decade of the 21st century, mean annual temperatures rose by 0.6–0.8 °C at the study sites, with the highest rate in mid-summer (1.2–1.6 °C), comparing the periods 1961-1985 and 1986–2010.
Meanwhile, annual precipitation stayed practically unchanged. Only the REZI
site faced a slight precipitation decrease of ~1.5% and the BAAP site an increase of ~3–3.5% (Table 2). More detailed intra-annual patterns of changing climate can be seen in the climate diagrams (Fig. 2). At the northern sites (BEFA, MALY), a notable increase was detected in the July precipitation, while in case of REZI, a clear shift to the late summer and autumn months was visible in the distribution of annual precipitation. At the southern BAAP site, autumn precipitation also increased, but without significant decrease or even slight increase in late spring and in the summer months.
These patterns also mark the differences between EQ and FAI climate indices (Fig. 3). The REZI site clearly faced the most monotonous trend of aridification, already beyond the hypothetical xeric distribution limit of beech during the latter decades, agreed by both indices and climate datasets. BAAP and BEFA sites were continuously over and near to these xeric limits, respectively. Taking the more site-specific CARPATCLIM based FAI time series into consideration, MALY was the most humid habitat, even though the larger scale climate data indicated this region controversially as more arid.
However, as noted before, any values should be handled with caution for this area, due to the inconsistency of climate datasets. Both northern sites (MALY, BEFA) faced a peak of driest conditions during the early 1990s.
3.2. Climate influence on the radial growth
Regarding the basic climatic variables (precipitation and temperature), the strongest correlations were found with precipitation, particularly with the rainfall of late spring and early summer months (Fig. 4). Mean temperatures showed a slight non-significant negative influence on growth during the same period. Apparent correlations with weather conditions of the early previous autumn were also observed usually with similar sign as in the growing period.
The four study sites showed similar patterns of monthly correlation coefficients, though some differences can be observed, as well (e.g., the lack of August precipitation’s relationship with REZI and BAAP site’s growth). Combining effects of temperature, evaporation and precipitation within SPEI in a 3-month window resulted in higher correlation with growth, increasing correlation coefficients up to 0.72 during July in case of MALY.
Fig. 4. Growth-climate correlations between CARPATCLIM monthly precipitation and temperature as well as 3-month standardized precipitation evaporation index (SPEI) data and TRW site chronologies for period 1961-2000. Months from the previous year’s April to the growing year’s September are employed in the correlation analysis. Precipitation and temperature of months April-August in the growing year were selected for further investigations; * marks significant relationships tested by the bootstrap method.
A group of growing months from April to August was selected for the more detailed multiple regression analysis with temperature and precipitation data (Fig. 5), even when mean temperature values did not show significant correlations with the growth during the entire period of 1961–2000. By the longer-term analysis, positive effects of precipitation were emphatically present, with the dominance of June rainfall highlighted. The limiting role of temperature was described as more influential by partial correlations. Negative relationships
were confirmed in general, with significant months of May and July at MALY and BEFA, and April at REZI and BAAP sites during several periods. In a single case at BEFA, a significant positive correlation with July temperature was also found during the earliest period of the previous century. The limiting role of late spring temperatures compared to effects of precipitation was most pronounced at the southernmost, climatically marginal BAAP site, although with the highest rate of unexplained variance. Relationships of the marginal months of the growing season (April and August) showed sometimes greater fluctuations and clearer trends, though varying to a great degree from site to site.
Significance of temperature determination was changing much more remarkably, than those of precipitation.
Fig. 5. Results of the multiple regression analysis of TRW site chronologies with April- August climate variables. R2 value of regression strength represents changing climate influence (black curves with diamonds), while relative magnitudes of partial correlation coefficients (in absolute values; |ρi|) imply the distribution of the annual increment’s formation in months of the main growing season in 31-year windows with 10-year overlap, using climate data of CRU/GPCC. Horizontal axis labeling indicates the mid- year of 31-year periods.
In case of the two northern sites (MALY, BEFA), an overall strengthening climatic determination of growth was visible over the last decades, involving also several monthly variables as significant determinants (Table 5), however, stronger relationships could be observed during the earlier periods of the last century, followed by an intermediate depression around the mid-20th century. In contrary, at the REZI and BAAP sites, the climatic influence was stronger around the mid-last century with a more recent slight fallback (Fig. 5). Despite this weakening in the total explained variance, many individual monthly variables were identified as significant in case of REZI, as well, for the period of 1985–2015 (Table 5). The overall climatic determination of growth was strongest in case of MALY (R2=0.69 during 1985–2015) and REZI (R2=0.69 during 1945–1975), but it was also similarly high in case of BEFA for the last period of analysis (R2=0.68 during 1985-2015). Regression coefficients, their significance and R2 statistics of the used multivariate linear models are summarized in Table 5 for the latter mid-20th century (1945–1975) and the last available period for each site.
Table 5. Estimates of the regression coefficients for each monthly climatic variable (with indicating their p<0.05 significance) and R2 and adjusted R2 statistics of the used regression models for the period 1945–1975 (a) and the last available period for each site (b; 1975–2005 for BAAP and 1985–2015 for the other three sites)
MALY BEFA REZI BAAP
a b a b a b a b P(APR) 0.0016 -0.0027* 0.0006 -0.0016 0.0014 0.0011 0.0007 0.0004 P(MAY) 0.0005 0.0012 0.0005 0.0010 0.0016* 0.0041* 0.0012 0.0037 P(JUN) 0.0014* 0.0025* 0.0016* 0.0026* 0.0018* 0.0037* 0.0012 0.0037*
P(JUL) -0.0002 0.0015 0.0001 0.0016* 0.0007 0.0029* -0.0007 0.0023 P(AUG) 0.0010 0.0020* 0.0003 0.0021* 0.0004 -0.0008 0.0002 0.0007 T(APR) -0.0307 -0.0111 -0.0292 -0.0134 -0.0282 0.0275 -0.0766* 0.0196 T(MAY) -0.0255 -0.1132* -0.0277 -0.0823* 0.0036 0.0654* -0.0491 0.0223 T(JUN) 0.0078 -0.0225 -0.0268 -0.0438 -0.0178 -0.0288 -0.0017 0.0302 T(JUL) 0.0142 -0.0684* 0.0369 -0.0662* -0.0046 0.0558 0.0250 -0.0584 T(AUG) -0.0065 0.0498 -0.0215 0.0506 0.0177 0.0193 -0.0080 -0.0304 Intercept 1.0978 3.2369* 1.5647 2.9229* 0.8974 -2.2116* 2.1191 1.0102
R2 0.502 0.693 0.446 0.681 0.691 0.555 0.477 0.420
adj. R2 0.252 0.540 0.170 0.522 0.536 0.332 0.215 0.130
3.3. Trends of basal area increments
Radial growth slowed down in the 1990s at the core sites, regardless of age and site conditions (relative BAI<1, Fig. 6). Note here that growth rates at drier habitats (BEFA, BAAP) having lower yield potential were initially lower (Table 6). Increments also became more unstable with age and higher BAI rates, both intra-series and between individual sample trees, with higher relative interannual variability and diverging quartiles of individual series (Fig. 6, Table 6). The mean increment curve of some REZI trees, those were affected by a drought induced mortality event beginning with the early 2000s, even turned into a strong decrease with some of them already stopping xylem formation 5–6 years prior to their sanitary harvesting in 2015. Most of the other trees from this site (both stand and NFI) also showed a clear growth decline for the corresponding years. The other three sites faced a slight growth release during the last years of the investigated period. Number of available BAI series generally represent almost full sample depth (MALY: n=20, BEFA: n=19, REZI: n=20, BAAP: n=17), however, in case of BAAP there was a fast reduction in available series after 2001 with only n=5 sample trees remaining in 2010, which could cause bias in possible conclusions for the last decade at this single site. The other study sites faced only a minor sample reduction in the very last year of 2010, with a decrease in available individual series by 4 and 2 samples at MALY and REZI, respectively.
Fig. 6. Relative basal area increments (rel. BAI; shaded area indicates interquartile range) with the reference period of 1971–1990 and time series of the July 3-month standardized precipitation evaporation index (SPEI-3 July; CARPATCLIM) during the period 1980- 2010. Sample depth at BAAP site reduces monotonously after 2001 to 5, while it is stable and represents almost the whole available sample size at the other three sites.
Table 6. Mean basal area increment (BAI) of the sample trees and mean slope of the linear trend (regression beta parameter; BAI trend) fitted on individual trees for the reference period of 1971–1990 (a) and the investigated decades of 1980–2010 (b); with interquartile range indicated in brackets
mean BAI (mm2) BAI trend (mm2/yr)
a b a b
MALY 1972
(1053–2732)
2248 (1374–2971)
59.1 (17.2–72.6)
3.9 (-27.1–20.1)
BEFA 1226
(822–1532)
1260 (1054–1565)
6.1 (5.5–31.4)
9.9 (-11.6–18.2)
REZI 2856
(1874–3660)
2370 (1632–2547)
25.8 (-5.7–52.7)
-63.0 (-100.6–-33.9)
BAAP 1453
(708–1705) 1613
(1104–1958) 19.5
(-1.0–23.4) 27.1
(-19.3–44.6)
Looking behind the general trends of BAI curves, effects and severity of particular drought periods of the past decades can be also differentiated (Fig. 6).
Major drought events were selected by the July values of the 3-month SPEI index (showing previously the closest relationship with growth variations) and checked also by pointer year analysis. Extreme droughts were associated to SPEI values lower than -1. A return periodicity of such events seemed to be usually 5–10 years. The severest country-scale summer droughts were identified during the years 1992–1994, affecting first of all the norther region (MALY, BEFA). Here, individual years of less extreme, but notable additional droughts were 1990, (1996), 2000, and 2007. At the southwestern sites, individual years with drier summers were already present (1983, 1988), and they were also affected by several extreme droughts beginning with 2000. In case of BAAP, however, these happened mostly in individual years with breaks in-between, while REZI faced continuous summer droughts between 2001–2003, meaning that altogether this site was affected by the most frequent and prolonged extreme drought periodicity.
The relative BAI values followed rather well the SPEI indices (Fig. 6).
After the 1992–1994 droughts, growth at most sites recovered relatively fast, exceeding the 1971–1990 average BAI values with exception of the REZI trees, where a slower recovery of growth was noticeable. With the beginning of the new drought period in 2000 (severest at BAAP site in that year) increments at all sites dropped in the same year all over the country. After that, in the northern region, MALY and BEFA started to recover again, while in case of REZI, a clear and lasting growth decline started, affecting most of the sample trees.
4. Discussion and conclusion
Forest tree species, close or in a changing climate getting closer to their xeric (retreating) range edge, are generally facing increased sensitivity to climatic conditions (Jump et al., 2010; Mátyás et al., 2010). This phenomenon is generally revealed by our case study, in terms of regression analysis between climatic variables and radial growth traits and by the course of basal area increments compared to recurrent droughts. Higher sensitivity at the originally more mesic sites, compared to the drier ones can be evinced due to the naturally higher resistance of the more drought-adapted marginal populations (Dittmar et al., 2003; Weber et al., 2013; Cavin and Jump, 2016). This could be confirmed by the growth decline at the originally beech-favored REZI or probably also by the stronger correlations found at the most humid MALY site. The partial correlation analysis in 31-year windows, however, also showed that the expected strengthening impact of climate on growth was not uniform among trees from different sites and considering monthly climate elements, but a varying sensitivity to climatic factors over time can be also concluded for all sites (Weber et al., 2013). Another study pointed out recent decreased climatic determination of Scots pine growth on the edge of its climatic tolerance in the vicinity of the REZI site (Misi and Náfrádi, 2017), that might be also applicable in case of REZI trees (and partially BAAP) during the last 31-year period, assuming the same climatic trends. This attribute of decreasing interannual growth-climate correlation does not necessarily contradict high climatic sensitivity in other terms though (cf., decreased drought resistance of REZI trees).
Similarly to a range of previous findings, strong correlation of radial growth was found with precipitation data, in particular with the rainfall of the late spring and early summer months (e.g., Geßler et al., 2007; van der Werf et al., 2007; Hacket-Pain et al., 2016), sometimes also referred to as the main growing season (Führer et al., 2011). Mean temperature in this same period also seemed to have a negative influence on radial growth, most probably as a consequence of the stimulation of transpirative water loss (Čufar et al., 2008;
Führer et al., 2016; Hacket-Pain et al., 2016). Therefore, the more complex climatic variable of the 3-month SPEI, showed the strongest relationships with growth, is widely used in other studies, as well (e.g., Hacket-Pain et al., 2016).
Concluding the results from each site, usually very high correlation coefficients were found with climatic variables (up to r=0.67 in case of June precipitation and r=0.72 in case of July SPEI), exceeding growth-climate correlations of most previous analyses from Europe (e.g., Čufar et al., 2008; van der Maaten, 2012;
Tegel et al., 2014; Cavin and Jump, 2016; Roibu et al., 2017; Stojanović et al., 2018). Apparent and significant correlations with the meteorological conditions of previous autumn and late summer could be also observed (Fig. 4), reported by other studies (e.g., Hacket-Pain et al., 2016; Roibu et al., 2017), probably also
due to the connections to physiological processes of the storage period and with a possible relation to reproductive traits (Drobyshev et al., 2010; Hacket-Pain et al., 2015). Differences in climatic sensitivity between study sites may be also due to the natural genetic diversity and high phenological plasticity of beech (Jump et al., 2006a; Prislan et al., 2013; Thiel et al., 2014), but differences in climatic conditions of the study sites might be seen as a principal driver combined with effects of other site factors (Table 1; Figs. 2 and 3 and 6).
Climate change usually results in an earlier leaf unfolding and beginning of the vegetation season (Čufar et al., 2012; Prislan et al., 2013), but a possible elongation of the growing season on the other cutting edge with increment formation delayed to late summer months is widely reported, as well (van der Werf et al., 2007; Jezík et al., 2011; Tegel et al., 2014; Führer et al., 2016).
Moving partial correlations of the multivariate analysis could reveal both tendencies at some extent by increasing importance of April-May, July-August in the total climatic determination of growth.
Multidecadal trends of basal area increments indicate more stagnating growth rates or even decline (REZI) for the investigated sites during the past 30- 40 years (Fig. 6). This finding is similar to reports from Mediterranean countries (Jump et al., 2006b; Piovesan et al., 2008), but also from Southern Germany (Dulamursen et al., 2017) and another site in western Hungary (Führer et al., 2016). Under optimal conditions, basal area growth curves increase almost monotonously, but later asymptotically with age. Decreasing trend usually appears when approaching the end of the individual beech tree’s lifetime, therefore, clearly reduced stem growth rates can be a (predictive) sign of a long- term decline (Piovesan et al., 2008; Gillner et al., 2013; Delaporte et al., 2016).
In comparison to other, especially to norther sites, some of the REZI trees underwent a drastic growth reduction, that could be interpreted as a predictive sign of vitality loss, which lead to drought-induced mortality event accounting also for the later sanitary interventions. This event was also well-linked to a reported mass mortality affecting widespread beech stands of western Hungary (Lakatos and Molnár, 2009). Beech decline in the region also raised the question of accurate projection of favorable beech habitats by time-averages of specific climate indices. The use of more complex indices may bring considerable benefits (Führer et al., 2011; Mellert et al., 2016), meanwhile, the common lack of knowledge of precise stand level climatic conditions should also be noted.
Drought is an important extreme climate phenomenon that can strongly affect physiology and growth of temperate tree species even on the longer term (Bréda et al., 2006). In case of beech, these stress effects could be even more notable (Scharnweber et al., 2011; Rasztovits et al., 2014; Roibu et al., 2017).
Including extreme and more importantly recurrent drought events in the analysis improved the understanding of growth reduction and decline, also in our case.
When talking about effects of drought on the vitality and growth of beech, most of the studies usually refer to the 2003 drought, that was widely reported and
investigated in many parts of Europe (e.g., Czajkowski et al., 2005; Bréda et al., 2006; van der Werf et al., 2007). However, looking at the time series of the SPEI indices (Fig. 6), the impression is that the abiotic side of tree mortality events in/after 2003 was more like a denouement in a chain of recurrent drought events of different severity. This observation is in line with the coincidence between biotic damages and mortality of beech and droughts in Hungary (Janik et al., 2016). Early-1990s droughts affected northern Hungary more strongly (represented by MALY and BEFA), while the early-2000s drought period was more expressed over western Hungary, causing significant damages there (Lakatos and Molnár, 2009; Janik et al., 2016). It should be also noted that the (south)western sites (REZI and BAAP) seemed to face some years of severe droughts already during the 1980s. Timing, frequency, and severity of dry periods combined with soil properties seemed to play a key role in determining the resilience capacity of individual forest stands (e.g., Móricz et al., 2018). The drought-induced tree decline phenomenon in the closer region of the REZI site was not limited to only beech trees either. After another severe drought later in 2012, extensive damages took also place among black pine stands in this region (Móricz et al., 2018). In addition to the higher exposure to droughts, this site was the only one with sandy soil texture, thus, with lowest water retention capacity, amplifying further the effects of the discussed drought events. Small- scale mosaics of remaining standing trees in sanitary felling patches at REZI site showed regained vitality during a later field visit, despite of the disrupted stand structure leading to higher exposure. The marginal habitats of south Hungary interestingly avoided major abiotic and associated biotic damages, also due to the different climatic impact and the lack of the continuous multiannual drought period of 2000–2003 (Fig. 6). Management plans and reforestation activity at the BAAP site, however, neglected beech in the more recent regeneration periods.
Our findings altogether confirm the pronounced climate sensitivity of beech growth at the continental xeric limit, but also reveal its variability both in interannual patterns comparing the different sites and over the investigated periods. Recent trends of climate change and additional extreme events could be also tracked along the changing climatic sensitivity of growth and in basal area growth decline, however, some of the sites faced recently less remarkable effects, and periods of more pronounced climatic sensitivity can be found also in the earlier part of the 20th century. Since tree rings are unique indicators of growth in respect of both time frequency and spatial availability, their application to more precise and dynamic forest growth estimation and forest inventories could be also significant (Rohner et al., 2016), in which context our results also gave evidence for a working and useful merge of regular NFI plot sampling with a more traditional dendrochonological sampling design. On the other hand, this combination of data revealed the relatively young average age of Hungarian beech forests, which may limit research attempts on long-term
beech dendroclimatology. Nevertheless, under the projected climate change, growth sensitivity assessments performed on a wider scale can also serve with useful information for future species and reproductive material selection for forest regeneration, including the search for potentially better adapted provenances from the xeric-marginal habitats (Mátyás, 2016).
Acknowledgements: We acknowledge the Eger, Mályinka, Keszthely, and Bátaszék State Forestry Offices and Dr. László Palcsu (Institute for Nuclear Research, MTA) for tree samples and site information. Special thanks to colleges of the National Food Chain Safety Office (NÉBIH) for contribution of core samples and the national beech distribution map along with the National Forest Inventory Program. We acknowledge the kind help of Dr. István Gábor Hatvani (Institute for Geological and Geochemical Research, MTA) in parts of the statistical analysis and the useful comments of Dr. Ernő Führer (Forest Research Institute, NARIC). The research was supported by the
‘Lendület’ program of the Hungarian Academy of Sciences (LP2012-27/2012). This is contribution No.64 of ‘2ka Palæoclimatology’ Research Group and No.33 of Budapest Tree-Ring Laboratory.
References
Bonan, G.B., 2008: Forests and climate change: forcings, feedbacks, and the climate benefits of forests. Science 320, 1444–1449. https://doi.org/10.1126/science.1155121
Bréda, N, Huc, R., Granier, A., and Dreyer E, 2006: Temperate forest trees and stands under severe drought: a review of ecophysiological responses, adaptation processes and long-term consequences. Ann For Sci 63, 625–644. https://doi.org/10.1051/forest:2006042
Buras, A., 2017: A comment on the expressed population signal. Dendrochronologia 44, 130–132.
https://doi.org/10.1016/j.dendro.2017.03.005
Cavin, L., and Jump, A.S., 2017: Highest drought sensitivity and lowest resistance to growth suppression are found in the range core of the tree Fagus sylvatica L. not the equatorial range edge. Glob Change Biol 23, 362–379. https://doi.org/10.1111/gcb.13366
Cook, E.R., Briffa, K., Shiyatov, S., and Mazepa, V., 1990: Tree-ring standardization and growth-trend estimation. In (eds: Cook, E., and Kairiukstis, L.) Methods of Dendrochronology. Applications in the Environmental Sciences;. Kluwer Academic Publishers
Cook, E.R., and Krusic, P.J., 2006: ARSTAN4.1b_XP. http://www.ldeo.columbia.edu
Cook, E.R., and Peters K, 1981: The smoothing spline: a new approach to standardizing forest interior tree-ring width series for dendroclimatic studies. Tree Ring Bull 41, 45–53.
Čufar, K., De Luis, M., Saz, M.A., Črepinšek, Z., and Kajfež-Bogataj, L., 2012: Temporal shifts in leaf phenology of beech (Fagus sylvatica) depend on elevation. Trees 26, 1091–1100.
https://doi.org/10.1007/s00468-012-0686-7
Čufar, K., Prislan, P., de Luis, M., and Gričar, J., 2008: Tree-ring variation, wood formation and phenology of beech (Fagus sylvatica) from a representative site in Slovenia, SE Central Europe.
Trees 22, 749–758. https://doi.org/10.1007/s00468-008-0235-6
Czajkowski, T., Kühling, M., and Bolte, A., 2005: Einfluss der Sommertrockenheit im Jahre 2003 auf das Wachstum von Naturverjüngungen der Buche (Fagus sylvatica L.) im nordöstlichen Mitteleuropa. Allg Forst Jagdztg 176, 133–143. (In German)
Czúcz, B., Gálhidy, L., and Mátyás, C., 2011: Present and forecasted xeric climatic limits of beech and sessile oak distribution at low altitudes in Central Europe. Ann For Sci 68, 99–108.
https://doi.org/10.1007/s13595-011-0011-4
Delaporte, A., Bazot, S., and Damesin, C., 2016: Reduced stem growth, but no reserve depletion or hydraulic impairment in beech suffering from long-term decline. Trees 30, 265–279.
https://doi.org/10.1007/s00468-015-1299-8
Di Filippo, A., Biondi, F., Čufar, K., De Luis, M., Grabner, M., Maugeri, M., Saba, E.P., Schirone, B., and Piovesan, G., 2007: Bioclimatology of beech (Fagus sylvatica L.) in the Eastern Alps:
spatial and altitudinal climatic signals identified through a tree-ring network. J Biogeogr 34, 1873–1892. https://doi.org/10.1111/j.1365-2699.2007.01747.x
Dittmar, C., Zech, W., and Elling, W., 2003: Growth variations of common beech (Fagus sylvatica L.) under different climatic and environmental conditions in Europe – a dendroecological study.
For Ecol Manage 173, 63–78. https://doi.org/10.1016/S0378-1127(01)00816-7
Drobyshev, I., Övergaard, R., Saygin, I., Niklasson, M., Hickler, T., Karlsson, M., and Sykes, M.T., 2010: Masting behaviour and dendrochronology of European beech (Fagus sylvatica L.) in southern Sweden. For Ecol Manage 259, 2160–2171.
https://doi.org/10.1016/j.foreco.2010.01.037
Dulamsuren, C., Hauck, M., Kopp, G., Ruff, M., and Leuschner, C., 2017: European beech responds to climate change with growth decline at lower, and growth increase at higher elevations in the center of its distribution range (SW Germany). Trees 31, 673–686.
https://doi.org/10.1007/s00468-016-1499-x
Ellenberg H, 1988: Vegetation ecology of Central Europe. Cambridge University Press EUFORGEN, 2009: Distribution map of Beech (Fagus sylvatica). www.euforgen.org
Fotelli, M.N., Nahm, M., Radoglou, K., Rennenberg, H., Halyvopoulos, G., and Matzarakis, A., 2009:
Seasonal and interannual ecophysiological responses of beech (Fagus sylvatica) at its south- eastern distribution limit in Europe. For Ecol Manage 257, 1157–1164.
https://doi.org/10.1016/j.foreco.2008.11.026
Frank, D., Esper, J., and Cook, E.R., 2007: Adjustment for proxy number and coherence in a large- scale temperature reconstruction. Geophys Res Lett 34, L16709.
https://doi.org/10.1029/2007GL030571
Führer, E., Edelényi, M., Horváth, L., Jagodics, A., Jereb, L., Kern, Z., Móring, A., Szabados, I., and Pödör, Z., 2016. Effect of weather conditions on annual and intra-annual basal area increments of a beech stand in Sopron Mountains in Hungary. Időjárás 120, 127–161.
Führer, E., Horváth, L., Jagodics, A., Machon, A., and Szabados, I., 2011: Application of new aridity index in Hungarian forestry practice. Időjárás 115, 205–216.
Garamszegi, B., and Kern, Z., 2014: Climate influence on radial growth of Fagus sylvatica growing near the edge of its distribution in Bükk Mts., Hungary. Dendrobiology 72, 93–102.
https://doi.org/10.12657/denbio.072.008
Geßler, A., Keitel, C., Kreuzwieser, J., Matyssek, R., Seiler, W., and Rennenberg, H., 2007: Potential risks for European beech (Fagus sylvatica L.) in a changing climate. Trees 21, 1–11.
https://doi.org/10.1007/s00468-006-0107-x
Gillner, S., Rüger, N., Roloff, A., and Berger, U., 2013: Low relative growth rates predict future mortality of common beech (Fagus sylvatica L.). For Ecol Manage 302, 372–378.
https://doi.org/10.1016/j.foreco.2013.03.032
Hacket-Pain, A.J., Cavin, L., Friend, A.D., and Jump, A.S., 2016: Consistent limitation of growth by high temperature and low precipitation from range core to southern edge of European beech indicates widespread vulnerability to changing climate. Eur J For Res 135, 897–909.
https://doi.org/10.1007/s10342-016-0982-7
Hacket-Pain, A.J., Friend, A.D., Lageard, J.G., and Thomas, P.A., 2015: The influence of masting phenomenon on growth–climate relationships in trees: explaining the influence of previous summers' climate on ring width. Tree Physiol 35, 319–330.
Harris, I., Jones, P.D., Osborn, T.J., and Lister, D.H., 2014: Updated high-resolution grids of monthly climatic observations–the CRU TS3. 10 Dataset. Int J Climatol 34, 623–642.
https://doi.org/10.1002/joc.3711
Hirka, A., Pödör, Z., Garamszegi, B., and Csóka, G., 2018: A magyarországi erdei aszálykárok fél évszázados trendjei (1962-2011). Erdészettudományi Közlemények 8, 11–25. (In Hungarian) https://doi.org/10.17164/EK.2018.001
Holmes, R.L., 1983: Computer-assisted quality control in tree-ring dating and measurement. Tree Ring Bull 43, 69–75.
Janik, G., Hirka, A., Koltay, A., Juhász, J., and Csóka, G., 2016. 50 év biotikus kárai a magyar bükkösökben. Erdészettudományi Közlemények 6, 45–60. (In Hungarian)
https://doi.org/10.17164/EK.2016.005
Ježík, M., Blaženec, M., Střelcová, K., and Ditmarová, Ľ., 2011: The impact of the 2003-2008 weather variability on intra-annual stem diameter changes of beech trees at a submontane site in central Slovakia. Dendrochronologia 29, 227–235. https://doi.org/10.1016/j.dendro.2011.01.009 Jump, A.S., Cavin, L., and Hunter, P.D., 2010: Monitoring and managing responses to climate change
at the retreating range edge of forest trees. J Environ Monitor 12, 1791–1798.
https://doi.org/10.1039/b923773a
Jump, A.S., Hunt, J.M., Martínez-Izquierdo, J.A., and Peñuelas, J., 2006a: Natural selection and climate change: temperature-linked spatial and temporal trends in gene frequency in Fagus sylvatica. Mol Ecol 15, 3469–3480. https://doi.org/10.1111/j.1365-294X.2006.03027.x
Jump, A.S., Hunt, J.M., and Peñuelas, J., 2006b: Rapid climate change-related growth decline at the southern range edge of Fagus sylvatica. Glob Change Biol 12, 2163–2174.
https://doi.org/10.1111/j.1365-2486.2006.01250.x
Kázmér, M., and Grynaeus, A., 2003. The Budapest Tree-Ring Laboratory. Association for Tree-Ring Research Newsletter 1, 5–6.
Kramer, K., Degen, B., Buschbom, J., Hickler, T., Thuiller, W., Sykes, MT., and de Winter, W., 2010:
Modelling exploration of the future of European beech (Fagus sylvatica L.) under climate change – Range, abundance, genetic diversity and adaptive response. For Ecol Manage 259, 2213–2222. https://doi.org/10.1016/j.foreco.2009.12.023
Lakatos, F., and Molnár, M., 2009: Mass mortality of beech (Fagus sylvatica L.) in South-West Hungary. Acta Silv Lign Hung 5, 75–82.
Lebourgeois, F., Bréda, N., Ulrich, E., and Granier, A., 2005: Climate-tree-growth relationships of European beech (Fagus sylvatica L.) in the French Permanent Plot Network (RENECOFOR).
Trees 19, 385–401. https://doi.org/10.1007/s00468-004-0397-9
van der Maaten, E., 2012: Climate sensitivity of radial growth in European beech (Fagus sylvatica L.) at different aspects in southwestern Germany. Trees 26, 777–788.
https://doi.org/10.1007/s00468-011-0645-8
Mátyás, C., 2010: Forecasts needed for retreating forests. Nature 464, 1271.
https://doi.org/10.1038/4641271a
Mátyás, C., 2016. Guidelines for the choice of forest reproductive material in the face of climate change. FORGER Guidelines 2016, www.fp7-forger.eu
Mátyás, C., Berki, I., Czúcz, B., Gálos, B., Móricz, N., and Rasztovits, E., 2010: Future of beech in Southeast Europe from the perspective of evolutionary ecology. Acta Silv Lign Hung 6, 91–110.
Mátyás, C., Božič, G., Gömöry, D., Ivanković, M., and Rasztovits, E., 2009: Transfer analysis of provenance trials reveals macroclimatic adaptedness of European beech (Fagus sylvatica L.).
Acta Silv Lign Hung 5, 47–62.
Meier, E.S., Lischke, H., Schmatz, D.R., and Zimmermann, N.E., 2012: Climate, competition and connectivity affect future migration and ranges of European trees. Global Ecol Biogeogr 21, 164–178. https://doi.org/10.1111/j.1466-8238.2011.00669.x
Mellert, K.H., Ewald, J., Hornstein, D., Dorado-Liñán, I., Jantsch, M., Taeger, S., Zang, C., Menzel, A., and Kölling, C., 2016: Climatic marginality: a new metric for the susceptibility of tree species to warming exemplified by Fagus sylvatica (L.) and Ellenberg’s quotient. Eur J For Res 135, 137–152. https://doi.org/10.1007/s10342-015-0924-9
Metz, J., Annighöfer, P., Schall, P., Zimmermann, J., Kahl, T., Schulze, ED., and Ammer, C., 2016:
Site-adapted admixed tree species reduce drought susceptibility of mature European beech.
Glob Change Biol 22, 903–920. https://doi.org/10.1111/gcb.13113
Misi, D., and Náfrádi, K., 2017: Growth response of Scots pine to changing climatic conditions over the last 100 years: a case study from Western Hungary. Trees 31, 919–928.
https://doi.org/10.1007/s00468-016-1517-z
Mölder, I., and Leuschner, C., 2014: European beech grows better and is less drought sensitive in mixed than in pure stands: tree neighbourhood effects on radial increment. Trees 28, 777–792.
https://doi.org/10.1007/s00468-014-0991-4
Móricz, N., Garamszegi, B., Rasztovits, E., Bidló, A., Horváth, A., Jagicza, A., Illés, G., Vekerdy, Z., Somogyi, Z., and Gálos, B., 2018: Recent Drought-Induced Vitality Decline of Black Pine (Pinus nigra Arn.) in South-West Hungary – Is This Drought-Resistant Species under Threat by Climate Change? Forests 9, 414.
NÉBIH, 2015: Forest resources and forest management in Hungary, 2014. National Food Chain Safety Office, Directorate of Forestry, Budapest
NÉBIH, 2016: Forest Inventory 2010-2014. National Food Chain Safety Office, Directorate of Forestry, Budapest. portal.nebih.gov.hu/en/erdoleltar/
Peñuelas, J., Ogaya, R., Boada, M., and Jump, A.S., 2007: Migration, invasion and decline: changes in recruitment and forest structure in a warming-linked shift of European beech forest in Catalonia (NE Spain). Ecography 30, 829–837. https://doi.org/10.1111/j.2007.0906-7590.05247.x
Piovesan, G., Biondi, F., Di Filippo, A., Alessandrini, A., and Magueri, M., 2008: Drought-driven growth reduction in old beech (Fagus sylvatica L.) forests of the central Apennines, Italy. Glob Change Biol 14, 1265–1281. https://doi.org/10.1111/j.1365-2486.2008.01570.x
Prislan, P., Gričar, J., de Luis, M., Smith, K.T., and Čufar, K., 2013: Phenological variation in xylem and phloem formation in Fagus sylvatica from two contrasting sites. Agr Forest Meteorol 180, 142–151. https://doi.org/10.1016/j.agrformet.2013.06.001
Rasztovits, E., Berki, I., Mátyás, C., Czimber, K., Pötzelsberger, E., and Móricz, N., 2014: The incorporation of extreme drought events improves models for beech persistence at its distribution limit. Ann For Sci 71, 201–210. https://doi.org/10.1007/s13595-013-0346-0
R Development Core Team, 2014: R: A Language and Environment for Statistical Computing, R Foundation for Statistical Computing. Vienna, Austria
Rinn, F., 2005. TSAP reference manual. Heidelberg, Germany
Rohner, B., Weber, P., and Thürig, E., 2016: Bridging tree rings and forest inventories: How climate effects on spruce and beech growth aggregate over time. For Ecol Manage 360, 159–169.
https://doi.org/10.1016/j.foreco.2015.10.022
Roibu, C.C., Popa, I., Kirchhefer, A.J., and Palaghianu, C., 2017: Growth responses to climate in a tree-ring network of European beech (Fagus sylvatica L.) from the eastern limit of its natural distribution area. Dendrochronologia 42, 104–116.
https://doi.org/10.1016/j.dendro.2017.02.003
Scharnweber, T., Manthey, M., Criegee, C., Bauwe, A., Schröder, C., and Wilmking, M., 2011:
Drought matters – declining precipitation influences growth of Fagus sylvatica L. and Quercus robur L. in north-eastern Germany. For Ecol Manage 262, 947–961.
https://doi.org/10.1016/j.foreco.2011.05.026
Schneider, U., Becker, A., Finger, P., Meyer-Christoffer, A., and Ziese, M., 2018: GPCC Full Data Monthly Product Version 2018 at 0.5°: Monthly Land-Surface Precipitation from Rain-Gauges built on GTS-based and Historical Data. Global Precipitation Climatology Centre.
http://gpcc.dwd.de/
Smith, P., Bustamante, M., Ahammad, H., Clark, H., Dong, H., Elsiddig, E.A., Haberl, H., Harper, R., House, J., Jafari, M., et al., 2014: Agriculture, Forestry and Other Land Use (AFOLU). In (eds:
Edenhofer, O., Pichs-Madruga, R., Sokona, Y., Farahani, E., Kadner, S., Seyboth, K., Adler, A., Baum, I., Brunner, S., Eickemeier, P., et al.). Climate Change 2014: Mitigation of Climate Change. Contribution of Working Group III to the Fifth Assessment Report of the Intergovernmental Panel on Climate Change; Cambridge University Press
Standovár, T., and Kenderes, K., 2003: A review on natural stand dynamics in beechwoods of East Central Europe. Appl Ecol Environ Res 1, 19–46. https://doi.org/10.15666/aeer/01019046 Stojanović, D.B., Kržič, A., Matović, B., Orlović, S., Duputié, A., Djurdjević, V., and Stojnić, S., 2013:
Prediction of the European beech (Fagus sylvatica L.) xeric limit using a regional climate model: An example from southeast Europe. Agr Forest Meteorol 176, 94–103.
https://doi.org/10.1016/j.agrformet.2013.03.009
Stojanović, B.D., Levanič, T., Matović, B., Stjepanović, S., and Orlović, S., 2018: Growth response of different tree species (oaks, beech and pine) from SE Europe to precipitation over time.
Dendrobiology 79, 97–110. https://doi.org/10.12657/denbio.079.009
Stokes, M.A., and Smiley, T.L., 1968: An introduction to tree-ring dating. The University of Chicago Press
Szalai, S., Auer, I., Hiebl, J., Milkovich, J., Radim, T., Stepanek, P., Zahradnicek, P., Bihari, Z., Lakatos, M., Szentimrey, T., et al., 2013: Climate of the Greater Carpathian Region. Final Technical Report. www.carpatclim-eu.org