DOI:10.28974/idojaras.2020.3.5
IDŐJÁRÁS
Quarterly Journal of the Hungarian Meteorological Service Vol. 124, No. 3, July – September, 2020, pp. 381–399
Assessment of air temperature trend in South and Southeast Bosnia and Herzegovina from 1961 to 2017
Dragan Papić*1, Nikola R. Bačević2, Aleksandar Valjarević², Nikola Milentijević², Milivoj B. Gavrilov3, Milenko Živković1,
andSlobodan B. Marković3
1University of Banja Luka
Faculty of Natural Sciences and Mathematics Department of Geography
78000 Banja Luka, Republic of Srpska, Bosnia and Herzegovina
²University of Priština
Faculty of Natural Sciences and Mathematics 38220 Kosovska Mitrovica, Serbia
3 University of Novi Sad, Faculty of Sciences Department of Geography
Tourism and Hotel Management 21000 Novi Sad, Serbia
*Corresponding author E-mail: dragan.papic@pmf.unibl.org (Manuscript received in final form September 3, 2019)
Abstract⎯ Recent climate change has been caused by interaction of natural processes and the anthropogenic factor. In turn, it incites the pronounced natural and socio- economic changes. It is the air temperature that plays a pertinent role in understanding the climate change problem. Southeast Europe, including Bosnia and Herzegovina (B&H), is highly relevant for the observations of regional differences in changes of air temperature regime. From the regional-geographical point of view, South and Southeast B&H cover 26.5% (13.568 km²) of B&H territory (51.209 km²). It is from south and southeast that the Mediterranean impacts from the Adriatic Sea penetrate into the defined region, which further affects the variability of climate conditions in B&H. The paper presents trends in three parameter categories: mean annual, mean maximum, and mean minimum air temperatures in the territory of South and Southeast B&H. The aim of the paper is to demonstrate the likely climate change based on air temperature trends. Methodologically, temperature trends were processed by using the Mann-Kendall trend test. For the purpose of the analysis, available data from four meteorological stations in South and Southeast B&H for a 56-year period were used. Based on the obtained results, a statistically relevant positive trend was observed in all twelve time series. According to the analyzed
trends, the increase of air temperature was dominant in the target area. The application of Geographical Information System (GIS) tools indicated the presence of regional differences in air temperature distribution. An evident phenomenon is the combined impact of the orography of the region and the maritime influence. The occurring climate change affects specific social sectors, so the problem must be addressed properly.
Another pertinent fact is that the climate change problem has not been adequately analyzed in the strategic documents in B&H.
Key-words: climate change, air temperature trends, Mann-Kendall trend test, GIS tools, South and Southeast Bosnia and Herzegovina
1. Introduction
According to highly reliable data from IPCC, the period from 1983 to 2012 was the warmest thirty-year period in Northern Hemisphere over the last 800 years (IPCC, 2014). The mean global surface temperature on Earth determined by the linear trend indicated the 0.85 °C increase during the period from 1880 to 2012.
Regional differences referring to the increase of mean global temperature range from 0.65 °C to 1.06 °C (Blunden, et al., 2018). Interactions between natural processes and human activities have caused the global air temperature values for the 2005–2015 decade to increase (0.87 °C) in comparison with the preindustrial values. If the current trend remains unchanged, projections of the global air temperature indicate a 1.5 °C increase for the period from 2030 to 2052 (Papalexiou, 2018; IPCC, 2018). There have been multiple attempts to reduce the anthropogenic impact on global climate. It was in 1989 that the Montreal Protocol was ratified by 197 countries in order to preserve the ozone layer (Downie, 2012). The 1997 Kyoto Protocol projected the reduction of gas emissions affecting the global warming (Breidenich, 1998). The current Paris Agreement on Climate Change ratified in 2015 has resulted in many controversies, as the signatory countries lack the uniformity in its implementation (Тeske, 2019). The mean annual air temperature in Europe was 1.6–1.7 °C higher over the last decade (2008–2017), which made this decade the warmest ever documented (EEA, 2018). Apart from reports, many authors have analyzed temperature trends. Klein Tank and Können (2003) used data from 168 European meteorological stations for the period 1946-1999 and specified the tendency of growth of mean European air temperature. From 1977 to 2000, the trends grew in Central and Northeast Europe. Mediterranean air temperature trends were lower and the temperature increase was more evident in winter than in summer (Alcamo et al., 2007). Therefore, the 20th century witnessed the air temperature increase in most Europe, and the changes were most evident in the 1990s (Kovats, et al., 2014). A similar trend continued in the years to follow as it was in the 21th century, that the four warmest years were registered ever since the first measurements started - 2015, 2016, 2017, and 2018 (WMO, 2019). Time-space interruptions and different methods of interpolation have been the main
shortcomings of all measurement results so they should be used carefully (Blunden and Arndt, 2015). Generally, there have been both annual and seasonal increases of mean air temperature in Europe (Brázdil et al., 1996; Brunetti et al., 2004; Feidas, et al., 2004; Brunet et al., 2007; Chen et al., 2015; Werz and Hoffman, 2016).
Earlier studies in Southeast Europe addressed the air temperature trends on regional levels (Jovanović et al., 2002; Đorđević, 2008; Unkašević and Tošić, 2013; Burić et al., 2014; Bajat et al., 2015; Tošić et al., 2016; Gavrilov et al., 2015, 2016, 2018; Trbić, et al., 2017; Bačević et al., 2018; Popov et al., 2018b, Vukoičić et al., 2018) and dealt with aridity as an indicator of climate change in higher regions (Bačević et al., 2017; Radaković et al., 2017; Milentijević et al., 2018).
This paper analyzes recent air temperature trends. Earlier studies in Bosnia and Herzegovina (Trbić et al., 2017; Popov et al., 2017, 2018a, 2018b) also established an increasing trend of mean annual air temperature.
Speaking of the impact of climate change onto specific economic areas in Bosnia and Herzegovina, there is a high risk of extreme climate events such as drought (Sheffield and Wood, 2007; Orlowsky and Senewiratne, 2013; Stagge et al., 2015; Spinoni et al., 2015, 2017). Future projections anticipate a growing frequency of this natural disaster in Europe, so it is crucial to undertake adequate measures. These measures are actually adaptation to the drought phenomenon, which is the cause of many socio-economic changes connected with nature, agriculture, and available water resources (Bressers et al., 2016).
This scientific paper comprises the following sections: 1) introduction; 2) description of research area; 3) used data and methodology; 4) obtained results;
5) discussion; 6) concluding remarks.
2. Study area
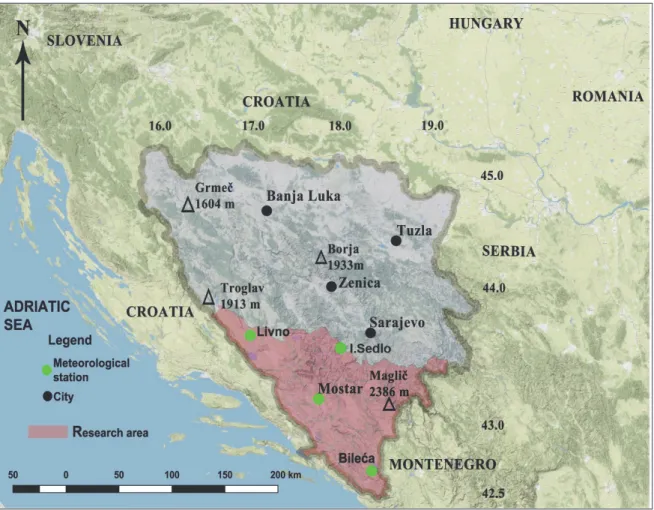
South and Southeast B&H share the borderline with Republic of Croatia in southwest and south and Republic of Montenegro in southeast, whereas the northern line of delineation follows the municipalities of Livno, Tomislavgrad, Prozor, Konjic, Kalinovik, Foch, and Čajniče (Republic of B&H) (Fig. 1). The research area is located between the 44°23' (the municipality of Livno) and 42°55' (the municipality of Trebinje) northern latitudes and 16°52' (the municipality of Livno) and 19°25' (the municipality of Čajniče) eastern longitudes. The following meteorological stations were used for the purpose of the research: Livno (43°49ʹ22ʹʹ N, 17°00ʹ04ʹʹ E, and 739 m altitude), Mostar (43°20ʹ53ʹʹ N, 17°47ʹ 38ʹʹ E, and 48 m altitude), Ivan Sedlo (43° 45ʹ04ʹʹ N, 18°02ʹ10ʹʹ E, and 955 m altitude), and Bileća (42°52ʹ04ʹʹ N, 18°25ʹ29ʹʹ E, and 480 m altitude) (Fig. 1, Table 1).
Fig. 1. Geographical position of South and Southeast B&H with landmarks of analyzed meteorological stations.
Table 1. Meteorological stations in South and Southeast Bosnia and Herzegovina
Station No. Station location Altitude Latitude Longitude
1 Livno 739 m 43° 49ʹ 22ʹʹ N 17° 00ʹ 04ʹʹ E
2 Bileća 480 m 42° 52ʹ 04ʹʹ N 18° 25ʹ 29ʹʹ E
3 Mostar 48 m 43° 20ʹ 53ʹʹ N 17° 47ʹ 38ʹʹ E
4 Ivan Sedlo 955 m 43° 45ʹ 04ʹʹ N 18° 02ʹ 10ʹʹ E
From physical-geographical aspects, the area is characterized by extreme holokarst located in the Outer Dinarides. The region covers watersheds of the Neretva and Trebišnjica rivers and their tributaries, as well as the upper Drina River. Holokarst largely affects the air temperature, particularly in summer, due to bare rocky ground which heats quickly (e.g., Mostar area). The climate is
diverse ranging from the pronounced Mediterranean climate on the Adriatic coast (Neum), the altered Mediterranean climate in the lower Neretva River (Mostar at 48 m altitude) suitable for early vegetable and Mediterranean fruit (this type of climate also occurs in Trebinje and Popovo Polje at around 280 m altitude), the continental climate in most of the region, and, finally, typical mountain climate at high mountain ranges (Marković, 1972; Rodić, 1975).
3. Data and methods
3.1. Data
The paper analyzed air temperature trends in the target area for the period from 1961 to 2017. Data from four meteorological stations published at Meteorological almanacs of the Hidrometeorological Institute of the Republic of Srpska (https://rhmzrs.com/?script=lat) and the Hidrometeorological Institute of the B&H Federation (https://www.fhmzbih.gov.ba) were used. There were interruptions in measurement at most meteorological stations, especially during the 1991–1995 war. The percentage of the missing data is 8.9% for Livno and Ivan Sedlo and 7.1% for Bileća. An exception is the Mostar meteorological station, at which there were intermittent measurements during the target time frame. Due to reasonable grounds, the missing data were compiled by using an interpolation method (Kilibarda et al., 2015). The paper uses linear interpolation which represents the simplest method for interpolation of a data set. It is defined as the arithmetic mean of linear interpolants between two neighboring data pairs (Hazewinkel, 1990). MICROSOFT OFFICE EXCEL was the program used for the interpolation of the missing data.
Geographical coordinates and altitudes of meteorological stations are given in Table 1. The hypsometry of selected stations differs. For instance, relative altitude difference between Mostar meteorological station (48 m) and the highest meteorological station at Ivan Sedlo (955 m) reaches 907 m, which indicates the diversity of climate conditions. The pronounced hypsometric differences among the stations generate a vertical thermal gradient – the average decline in air temperature is 0.65 °C/100 m altitude (Oliver, 2005). The terrain orography and the vicinity of the Adriatic Sea contribute to the climate diversity, so the analyzed data are presented for each meteorological station independently.
The paper displays results obtained through analysis of air temperature as a climate variable. The air temperatures are categorized in three classes: mean ( ), mean maximum ( ), and mean minimum air temperatures ( ). The mean air temperature values are available from meteorological yearbooks. The extreme temperature values are presented by using mean maximum and mean minimum air temperature values. These were calculated as a ratio of the sum of mean monthly air temperatures and interval duration, i.e., the number of months in a year (Milosavljević, 1990).
The total of twelve time series was determined through the analysis of the aforementioned parameters. Each of the series was assigned an adequate acronym combining the abbreviation of the meteorological station, the year, and the temperature type (Table 2).
Table 2. List of 12 time series to calculate surface air temperature trends in South and Southeast Bosnia and Herzegovina
Station Year ( )
Livno (L)
Bileća (B)
Mostar (M)
Ivan Sedlo (I)
−
−
−
−
−
−
−
−
−
−
−
−
3.2. Methods
Three statistical approaches were used in the air temperature trend analysis. The first approach refers to the linear trend equation (Draper and Smith, 1966), which was designed for each time series separately. Independent of the initial step, all trends were tested by using the non-parametric MK trend test (Mann, 1945; Kendall, 1938). The third step referred to the definition of trend magnitude determined through the trend equation (Gavrilov et al., 2016). The MICROSOFT OFFICE EXCEL program was used to determine air temperature trends. XLSTAT software (https://www.xlstat.com/en) was used to calculate the p reliability level and test our hypotheses. GIS is used as a potent tool for the analysis and numerical modeling of a whole range of climate data (Collins and Bolstad, 1996).
3.2.1. Trend equation
The linear trend method is an extremely relevant technique used in order to analyze, evaluate, and distribute both long-term and short-term changes in air temperature (Herrmann et al., 2005; Heim, 2015; Ghebrezgabher et al., 2016).
Its general form is:
= + , (1)
in which y is the air temperature expressed in °C, а is the gradient, x is the time series, and b is the initial temperature. The air temperature trend value correlates with the gradient. There are three possible scenarios: а) the gradient is higher than zero – the trend is positive (growing); b) the gradient is smaller than zero – the trend is negative (declining), or c) the gradient is equal to zero – there is no trend (without alterations).
3.2.2. Trend magnitude
The trend magnitude is determined by using the linear trend equation (Gavrilov et al., 2016) as follows:
∆ = 1961 − 2017 , (2)
in which is the trend magnitude expressed in °C, y (1961) is the air temperature at the beginning of the period, and y (2017) is the air temperature at the end of the period. There are three possible scenarios with the trend magnitude: а) is higher than zero – the trend is negative (declining); b) is smaller than zero – the trend is positive (growing), and c) is equal to zero – there is no trend (without alterations).
3.2.3. Mann-Kendall (MK) test
Apart from the regression analysis, the non-parametric Mann-Kendall test was used to additionally assess the presence or absence of the trend (Mann, 1945;
Kendall, 1938). The following two hypotheses were tested by using the MK test:
the zero hypothesis (H0), which indicates the absence of the trend in the time series and the alternative hypothesis Ha, in which there is a statistically relevant trend in the time series for the given relevance level (α). The p value has a central role in the MK test (Karmeshu, 2012; Razavi et al., 2016). The p value determines the hypothesis reliability level. If the p value is smaller than the selected α relevance level (commonly α=0.05 or 5%), the hypothesis H0 should be rejected and the hypothesis Ha should be adopted. As opposed, if p is larger than the α relevance level, then the hypothesis H0 is adopted (Mudelsee, 2010;
Hennemuth et al., 2013).
3.2.4. Geographical Information Sistem (GIS) numerical analysis
Geographical Information System (GIS) is a powerful tool for modeling climate data. The greatest advantage of the GIS numerical analysis is the analysis of the region itself with all its integrated climate data. Geostatistical methods of interpolation and semi-variogram are of primary pertinence in the numerical GIS analysis. These classical statistical methods combined with kriging methods provided outstanding results (Valjarević et al., 2018a; Petterson and Hoalst- Pullen, 2011). Other geostatistical methods used for the purpose of this research enabled a better distribution of climate data within a specific territory. The advantage of the Open Source software is the possibility of coding and decoding within the software itself, and the best-known instances of the software were used such as QGIS, SAGA, and GRASS GIS. The greatest benefit of the climate data processing in this software is a specific numerical methodology which adjusts to the target geospace. In this manner, each geospace is processed through a specific numerical analysis, and the errors are minimal as characteristics of both the geospace and the data are taken into account (Valjarević et al., 2018b; Pew and Larsen, 2001).
4. Results
4.1. Trend parameters
The paper provides results of mean annual air temperature values ( ). The data are categorized in line with temperature types. The analysis covers the total of four meteorological stations in Livno, Bileća, Mostar, and Ivan Sedlo, i.e., twelve time series. Figs. 2–5 display mean annual air temperatures (Y ), mean annual maximum air temperatures (Y ), and mean annual minimum air temperatures (Y ), as well as trend test equations and linear equations for each meteorological station in South and Southeast B&H for the observed period from 1961 to 2017. Trend magnitudes (°C) and trend probability for each time series and each meteorological station within the observed territory are provided in Tables 1 and 2. The results are displayed in Table 3 presenting both parameters and trend equations for all twelve time series.
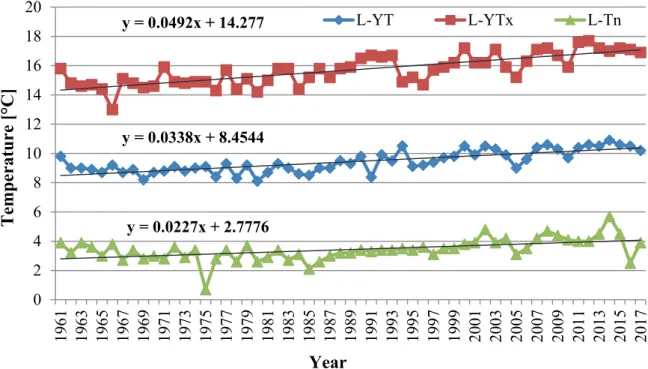
Fig. 2. Average annual mean, maximum, and minimum air temperatures, trend equations, and linear trend in Livno for the observed period 1961–2017.
Fig. 3. Average annual mean, maximum, and minimum air temperatures, trend equations, and linear trend in Bileća for the observed period 1961–2017.
y = 0.0338x + 8.4544 y = 0.0492x + 14.277
y = 0.0227x + 2.7776
0 2 4 6 8 10 12 14 16 18 20
1961 1963 1965 1967 1969 1971 1973 1975 1977 1979 1981 1983 1985 1987 1989 1991 1993 1995 1997 1999 2001 2003 2005 2007 2009 2011 2013 2015 2017
L-YT L-YTx L-Tn
Temperature [°C]
Year
y = 0.016x + 11.848 y = 0.0233x + 17.39
y = 0.0128x + 6.6241
0 5 10 15 20 25
1961 1963 1965 1967 1969 1971 1973 1975 1977 1979 1981 1983 1985 1987 1989 1991 1993 1995 1997 1999 2001 2003 2005 2007 2009 2011 2013 2015 2017
B-YT B-YTx B-YTn
Year
Temperature[°C]
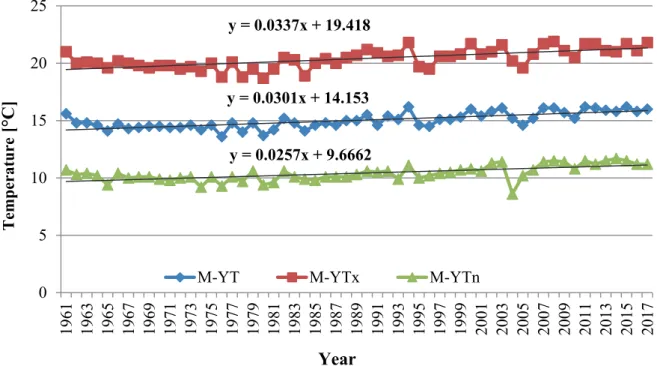
Fig. 4. Average annual mean, maximum, and minimum air temperatures, trend equations, and linear trend in Mostar for the observed period 1961–2017.
Fig. 5. Average annual mean, maximum, and minimum air temperatures, trend equations, and linear trend in Ivan Sedlo for the observed period 1961–2017.
y = 0.0301x + 14.153 y = 0.0337x + 19.418
y = 0.0257x + 9.6662
0 5 10 15 20 25
1961 1963 1965 1967 1969 1971 1973 1975 1977 1979 1981 1983 1985 1987 1989 1991 1993 1995 1997 1999 2001 2003 2005 2007 2009 2011 2013 2015 2017
M-YT M-YTx M-YTn
Temperature[°C]
Year
y = 0.0226x + 6.9172 y = 0.0404x + 11.176
y = 0.0208x + 3.0492
0 2 4 6 8 10 12 14 16
1961 1963 1965 1967 1969 1971 1973 1975 1977 1979 1981 1983 1985 1987 1989 1991 1993 1995 1997 1999 2001 2003 2005 2007 2009 2011 2013 2015 2017
I-YT I-YTx I-YTn
Temperature [°C]
Year
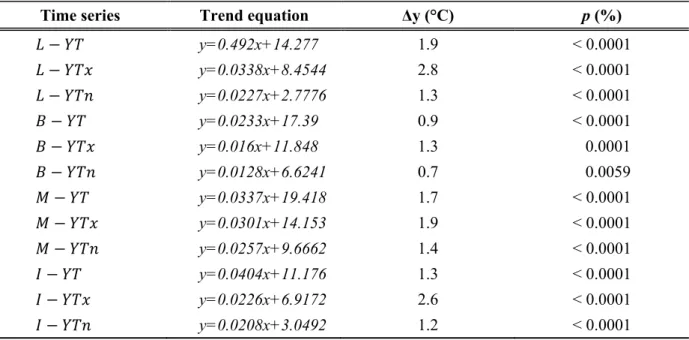
Table 3.Trend equation y, trend magnitude Δy, and probability p of the reliability for 12 time series
Time series Trend equation Δy (°C) p (%)
− y=0.492x+14.277 1.9 < 0.0001
− y=0.0338x+8.4544 2.8 < 0.0001
− y=0.0227x+2.7776 1.3 < 0.0001
− y=0.0233x+17.39 0.9 < 0.0001
− y=0.016x+11.848 1.3 0.0001
− y=0.0128x+6.6241 0.7 0.0059
− y=0.0337x+19.418 1.7 < 0.0001
− y=0.0301x+14.153 1.9 < 0.0001
− y=0.0257x+9.6662 1.4 < 0.0001
− y=0.0404x+11.176 1.3 < 0.0001
− y=0.0226x+6.9172 2.6 < 0.0001
− y=0.0208x+3.0492 1.2 < 0.0001
4.2. Trend estimation
Main results of the MK air temperature trend test displayed in Table 3 are supported by Figs. 2–5. Hence, the character and intensity of the analyzed air temperature trends in our target region are corroborated. Figs. 2–5 and Table 3 show that the trends for all twelve time series were positive. It is the MK test that helps us infer whether these claims were true.
If probability p for the time series , , and in the target territory is smaller than α, the hypothesis H0 (the trend does not exist) will be abandoned and the hypothesis Ha (the trend exists) will be adopted for all these time series.
The p value is < 0.0001 in time series , , and for the meteorological stations in Livno, Mostar, and Ivan Sedlo and in time series for the meteorological station in Bileća. The prevailing hypothesis is H0. The risk of abandoning the hypothesis H0 is smaller than 0.01%. The p value is 0.0001 for the time series for the meteorological station in Bileća. The risk of abandoning the hypothesis H0 is 0.02%. For the time series for the meteorological station in Bileća, the p value is 0.0059. The risk of abandoning the hypothesis H0 is 0.02%.
4.3. GIS numerical analysis
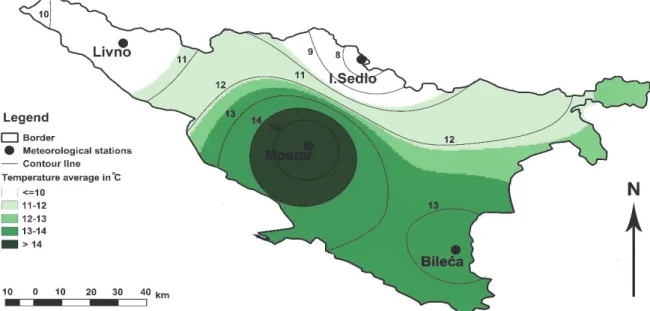
The mean annual air temperatures ( ) within the target territory from 1961 to 2017 are displayed in Fig. 6. The spatial distribution of isotherms indicates the
intraregional temperature differences resulting from the terrain orography. For instance, in Ivan Sedlo located within the mountain notch and Livno located in a typical karst field, varies from 8 °C to 10 °C. Mostar meteorological station is located at low altitude (48 m) and is under a direct maritime impact from the Adriatic Sea along the Neretva River valley; its varies from 11 °C to 14 °C and summer temperature is often higher than in the coastline. The temperature regime in Bileća is determined by different climate modifiers, especially in regards to altitude, continental, and maritime impacts, location within the basin and the Bilećko Lake. These are all factors which resulted in value of 12 °C.
The construction of the artificial accumulation of water in Bileća in 1968 caused the change of microclimate elements as the mean air temperature decreased, and the air humidity and mean precipitation sum increased (Marković, 1990).
Fig. 6. Distribution of in South and Southeast Bosnia and Herzegovina territory in the period 1961–2017.
Mean maximum annual air temperatures ( ) in the target territory from 1961 to 2017 are displayed in Fig. 7. For instance, in Ivan Sedlo is 13 °C and in Livno it is 16 °C. The lowland positioned station in Mostar has the of 20 °C, and in Bileća it is 19 °C.
Fig. 7. Distribution of in South and Southeast Bosnia and Herzegovina territory in the period 1961–2017.
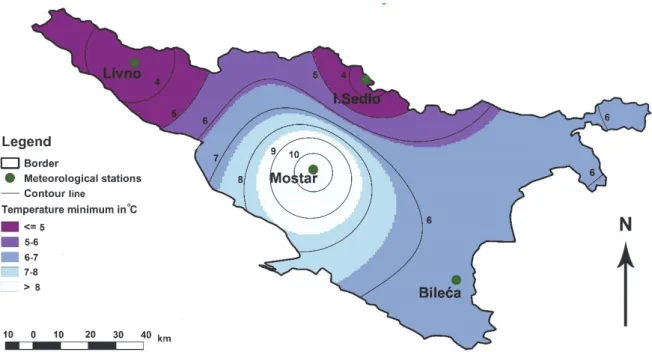
Mean minimum annual air temperatures ( ) in the target territory in the period 1961–2017 are displayed in Fig. 8. In line with the map, is 4 °C for Ivan Sedlo and Livno, whereas it is 10 °C in Mostar and 6 °C in Bileća.
Fig. 8. Distribution of in South and Southeast Bosnia and Herzegovina territory in the period 1961–2017.
5. Discussion
According to the obtained results, the air temperature increase prevails in South and Southeast Bosnia and Herzegovina. The trend magnitude (Table 3) identifies an evident increase of values of mean, mean maximum, and means minimum air temperatures. When it comes to individual instances, most pronounced changes occur with mean maximum air temperatures. The mean increase is 2.8 °C in Livno, 2.3 °C in Ivan Sedlo, 1.9 °C in Mostar, and 1.3 °C in Bileća. In cases of mean annual air temperatures, the results are as follows:
Livno 1.9 °C, Mostar 1.7 °C, Ivan Sedlo 1.3 °C, and Bileća 0.9 °C. The least pronounced changes occur with mean minimum air temperatures and these are registered in Ivan Sedlo (1.2 °C) and Bileća (0.7 °C). Identical results are difficult to find in the large body of works. The trend of increase of mean air temperature in Europe has been growing since 1979 both seasonally and annually (Klein-Tank and Können, 2003). Speaking of regional level, there have been similar trends. For instance, Brázdil et al., (1996) found that in ten states of Central and South Europe there was an increase in cases of mean maximum and mean minimum air temperatures (from 1951 to 1990). A study performed by Brunetti et al., (2004) identified a trend in mean annual air temperatures. The mean annual air temperature trend varies from 0.4 °C/100 years in North Italy to 0.7 °C/100 years in the south of the state. A statistically relevant increase of trends of mean, mean maximum, and mean minimum air temperatures was identified in all of Slovenian territory and it varied from 0.3 °C to 0.5 °C per decade (Milošević et al., 2013, 2017). In addition, Mamara et al., (2016) processed data from 52 meteorological stations in Greece and found a statistically negative trend between 1960 and 1976. On the other hand, a statistically positive trend was identified between 1977 and 2004. It was in northern parts of Greece that the warming was particularly intensive. Similarly, an air temperature increase was determined in Vojvodina (Gavrilov et al., 2015), Kosovo (Gavrilov et al., 2018), and Montenegro (Burić et al., 2014). A general conclusion is that there is a correspondence between air temperature changes in B&H and in the wider region.
6. Conclusions
The annual and seasonal trends of mean, mean maximum, and mean minimum air temperatures in South and Southeast B&H from 1961 to 2017 were analyzed.
The air temperature trends were analyzed for twelve time series by using: а) trend equation, b) trend magnitude, and c) MK trend test. There was a positive trend for all twelve time series for mean, mean maximum, and mean minimum air temperatures. The regional positive trends of air temperatures represent a climate change pattern in Northern Hemisphere, which is in line with conclusions of the Intergovernmental Panel on Climate Change (IPCC, 2014).
Climate change does not only affect the nature but the society as well.
Agriculture is a particularly sensitive sector as its ratio in total economy is 7% of the B&H Gross Domestic Product (GDP). The population engaged in the sector suffers directly, too. In addition, pronounced climate change threats food safety, which raises the need for adaptation of agricultural production in affected regions. Nevertheless, the whole process is an interaction among geographical, socio-economic, political, cultural, ecological, and institutional factors.
Unfortunately, the problem of climate change has not been paid adequate attention in B&H strategic documents (Trbić et al., 2018). Opportunities to adapt the economy sector to climate change in B&H are defined in the document titled „Climate change adaptation and low emission development strategy for Bosnia and Herzegovina“. Its application should reduce negative impacts of climate change and increase adaptation options and usage of development opportunities caused by climate change (Radusin et al., 2013). In line with the set tasks, this document should be implemented into the B&H development strategy. Future studies should focus on climate change projections and analysis of climate change impact on the economy sector.
References
Alcamo, J., Moreno, J.M., Nováky, B., Bindi, M., Corobov, R., Devoy, R.J.N., Giannakopoulos, C., Martin, E., Olesen, J.E., and Shvidenko, A., 2007: Europe. In (Eds. M.L. Parry, O.F. Canziani, J. Palutikof, P. van der Linden and C. Hanson), Climate Change 2007: Impacts, Adaptation and Vulnerability. Contribution of Working Group II to the Fourth Assessment Report of the Intergovernmental Panel on Climate Change (541-580). Cambridge University Press, Cambridge, United Kingdom and New York, NY, USA.
Bajat, B., Blagojević, D., Kilibarda, M., Luković, J. and Tošić, I., 2015: Spatial Analysis of the Temperature Trends in Serbia during the Period 1961–2010. Theor. Appl. Climatol. 121, 289–301.
https://doi.org/10.1007/s00704-014-1243-7
Bressers, J.T.A., Bressers, N., and Larrue, C., 2016: Governance for Drought Resilience: Land and Water Drought Management in Europe. Springer. https://doi.org/10.1007/978-3-319-29671-5 Breidenich, C., Magraw, D., Rowley, A., and Rubin, J., 1998: The Kyoto Protocol to the United
Nations Framework Convention on Climate Change. Amer. J. Int. Law 92, 315–331.
https://doi.org/10.2307/2998044
Bačević, R.N., Vukoičić, Z.D., Nikolić, M., Janc, N., Milentijević, N., and Gavrilov, B.M., 2017:
Aridity in Kosovo and Metohija, Serbia. Carpathian J. Earth Environ. Sci. 12, 563–570.
Bačević, R.N., Pavlović, M., and Rmaltitudejanin, I., 2018: Trend Assessing Using Mann-Kendall’s Test for Priština Meteorological Station Temperature and Precipitation Data, Kosovo and Metohija, Serbia, Publ. Nat. Sci., (8)2, 39–43. https://doi.org/10.5937/univtho8-19513
Blunden, J. and Arndt, D.S., 2015: State of the Climate in 2014, Bull. Amer. Meteorol. Soc. 96(7), ES1–32.
https://doi.org/10.1175/2015BAMSStateoftheClimate.1
Blunden, J., Arndt, D.S., and Hartfield, G., 2018: State of the Climate in 2017, Bull. Amer. Meteorol.
Soc. 99(8), Si–S332. https://doi.org/10.1175/2018BAMSStateoftheClimate.1
Brázdil, R., Budykov, M., Auer, I., Böhm, R., Cegnar, T., Fasko, P., Lapin, M., Gajic-Capka, M., Zaninovic, K., Koleva, E., Niedzwiedz, T., Szalai, S., Ustrnul, Z. and Weber, R.O., 1996: Trends of maximum and minimum daily temperatures in central and southeastern Europe. Int. J.
Climatol. 16, 765–782.
https://doi.org/10.1002/(SICI)1097-0088(199607)16:7<765::AID-JOC46>3.0.CO;2-O
Brunetti, M., Buffoni, L., Mangianti, F., Maugeri, M., and Nanni, T., 2004: Temperature, precipitation and extreme events during the last century in Italy. Glob. Planet. Change, 40, 141–149.
https://doi.org/10.1016/S0921-8181(03)00104-8
Brunet, M., Jones, P.D., Sigro, J., Saladie, O., Aguilar, E., Moberg, A., Della-Marta, P.M., Lister, D., Walther, A. and López, D., 2007: Temporal and spatial temperature variability and change over Spain during 1850-2005. J.Geophys. Res.: Atmospheres, 112, 1984–2012.
https://doi.org/10.1029/2006JD008249
Burić, D., Luković, J., Ducić, V., Dragojlović, J., and Doderović, M., 2014: Recent trends in daily temperature extremes over southern Montenegro (1951–2010), Nat. Haz. Earth Syst. Sci., 14, 67–72.
https://doi.org/10.5194/nhess-14-67-2014
Chen, D., Walther, A., Moberg, A., Jones, P., Jacobeit, J. and Lister, D., 2015: European Trend Atlas of Extreme Temperature and Precipitation Records. Springer, Netherlands.
https://doi.org/10.1007/978-94-017-9312-4
Collins, F.C. and Bolstad, P.V., 1996: A comparison of spatial interpolation techniques in temperature estimation. In Proceedings of the Third International Conference/Workshop on Integrating GIS and Environmental Modeling. National Center for Geographic Information Analysis (NCGIA).
Santa Fe, NM, Santa Barbara, CA, January 21–25.
Downie, D.L., 2012: The Vienna Convention, Montreal Protocol and Global Policy to Protect Stratospheric Ozone. In (Eds. P. Wexler et al.) Chemicals, Environment, Health: A Global Management Perspective. Taylor & Francis, Oxford. https://doi.org/10.1201/b11064-20
Draper, N.R., and Smith, H., 1966: Applied Regression Analysis. John Wiley & Sons, New York, USA.
Đorđević, S.V., 2008: Temperature and precipitation trends in Belgrade and indicators of changing extremes for Serbia. Geographica Pannonica, 12(2), 62–68.
https://doi.org/10.5937/GeoPan0802062D
EEA, 2018: National Climate Change Vulnerability and risk asssessments in Europe, EEA Report No.1/2018. https://www.eea.europa.eu/publications/national-climate-change-vulnerability-2018 (accessed 06.02.2019)
EXCEL, https://products.office.com/en-us/home (accessed 09.03.2019)
Federal Hydrometeorological Service of Bosnia and Herzegovina, https://www.fhmzbih.gov.ba/
(accessed 09.02.2019)
Feidas, H., Makrogiannis, T., and Bora-Senta, E., 2004: Trend analysis of air temperature time series in Greece and their relationship with circulation using surface and satellite data: 1955-2001.
Theor. Appl. Climatol. 79, 185–208. https://doi.org/10.1007/s00704-004-0064-5
Gavrilov, M.B., Marković, S.B., Jarad, A., and Korać, V.M., 2015: The analysis of temperature trends in Vojvodina (Serbia) from 1949 to 2006. Thermal Sci. 19, 339–350.
https://doi.org/10.2298/TSCI150207062G
Gavrilov, M.B., Tošić, I., Marković, S.B., Unkašević, M. and Petrović, P., 2016: The analysis of annual and seasonal temperature trends using the Mann-Kendall test in Vojvodina, Serbia. Időjárás 122, 203–216. https://doi.org/10.28974/idojaras.2018.2.6
Gavrilov, M.B., Marković, S.B., Janc, N., Nikolić, M., Valjarević, A., Komac, B., Zorn, M., Punišić, M.
and Bačević, N., 2018: Assessing average annual air temperature trends using the Mann–
Kendall test in Kosovo. Acta geographica Slovenica, 58, 8–25, https://doi.org/10.3986/AGS.1309
Ghebrezgabher, M.G., Yang, T. and Yang, X., 2016: Long-Term Trend of Climate Change and Drought Assessment in the Horn of Africa, Adv. Meteorol. 2016, Article ID 8057641, 12.
https://doi.org/10.1155/2016/8057641
Hazewinkel, M., 1990: Encyclopaedia of Mathematics. Springer, Netherlands.
https://doi.org/10.1007/978-94-009-5991-0
Herrmann, S.M., Anyamba, A., and Tucker, C.J., 2005: Recent trends in vegetation dynamics in the African Sahel and their relationship to climate. Glob. Environ. Change, 15, 394–404.
https://doi.org/10.1016/j.gloenvcha.2005.08.004
Hennemuth, B., Bender, S., Bülow, K., Dreier, N., Keup-Thiel, E., Krüger, O., Mudersbach, C., Radermacher, C., and Schoetter, R., 2013: Statistical methods for the analysis of simulated and
observed climate data, applied in projects and institutions dealing with climate change impact and adaptation, CSC Report No. 13.
https://www.climate-service-center.de/imperia/md/content/csc/projekte/csc- report13_englisch_final-mit_umschlag.pdf (accessed 10.03.2019)
Heim, R.R., 2015: An overview of weather and climate extremes – Products and trends, Weather Climate Extr. 10(B), 1–9. https://doi.org/10.1016/j.wace.2015.11.001
IPCC, 2014: Climate Change 2014: Synthesis Report. Contribution of Working Groups I, II and III to the Fifth Assessment Report of the Intergovernmental Panel on Climate Change [Core Writing Team, (eds. R.K. Pachauri and L.A. Meyer). IPCC, Geneva, Switzerland, 151.
IPCC, 2018: Summary for Policymakers. In: Global warming of 1.5°C. An IPCC Special Report on the impacts of global warming of 1.5°C above pre-industrial levels and related global greenhouse gas emission pathways, in the context of strengthening the global response to the threat of climate change, sustainable development, and efforts to eradicate poverty (eds. V.
Masson-Delmotte, P. Zhai, H. O. Pörtner, D. Roberts, J. Skea, P. R. Shukla, A. Pirani, W.
Moufouma-Okia, C. Péan, R. Pidcock, S. Connors, J. B. R. Matthews, Y. Chen, X. Zhou, M. I.
Gomis, E. Lonnoy, T. Maycock, M. Tignor, T. Waterfield). World Meteorological Organization, Geneva, Switzerland, 32.
Jovanović, G., Reljin, I., and Savić, T., 2002: NAO Influence on climate variability in FRY. 18th International conference on Carpathian meteorology. Belgrade.
Karmeshu, N., 2012: Trend detection in annual temperature and precipitation using the Mann Kendall test – a case study to assess climate change on select states in the northeastern United States.
Master's thesis, 27, University of Pennsylvania, Philadelphia.
Kendall, M., 1938: A new measure of rank correlation. Biometrika, 30, 81–89.
https://doi.org/10.2307/2332226
Kilibarda, M., Tadić Perčec, M., Hengl, T., Luković, J. and Bajat, B., 2015: Global geographic and feature space coverage of temperature data in the context of spatio-temporal interpolation, Spatial Stat. 14(A), 22–38. https://doi.org/10.1016/j.spasta.2015.04.005
Klein Tank, A.M.G. and Können, G.P., 2003: Trends in Indices of Daily Temperature and Precipitation Extremes in Europe, 1946–99. J. Climate, 16, 3665–3680.
https://doi.org/10.1175/1520-0442(2003)016<3665:TIIODT>2.0.CO;2
Kovats, R. S., Valentini, R., Bouwer, L. M., Georgopoulou,E., Jacob, D., Martin, E., Rounsevell, M.
and Soussana, J. F., 2014: Europe. In: (eds. Barros, V. R., Field, C. B., Dokken, D. J., Mastrandrea, M. D., Mach, K. J., Bilir, T. E., Chatterjee, M., Ebi, K. L.,Estrada, Y. O., Genova, R. C., Girma, B., Kissel, E. S., Levy, A.N., MacCracken, S., Mastrandrea, P. R., White, L.L.) Climate Change 2014: Impacts, Adaptation, and Vulnerability. Part B: Regional Aspects.
Contribution of Working Group II to the Fifth Assessment Report of the Intergovernmental Panel on Climate Change. Cambridge University Press, Cambridge, United Kingdom and New York, NY, USA.
Mamara, A., Argiriou, A.Α. and Anadranistakis, M., 2016: Recent Trend Analysis of Mean Air Temperature in Greece Based on Homogenized Data. Theor. Appl. Climatol. 126, 543–573.
https://doi.org/10.1007/s00704-015-1592-x
Mann, H. B., 1945: Non-parametric Tests Against Trend. Econometrica 13, 245–259.
https://doi.org/10.2307/1907187
Marković, J. Đ., 1972: Geografske oblasti Socijalističke Federativne Republike Jugoslavije. Zavod za udžbenike i nastavna sredstva Srbije, Beograd (in Serbian).
Marković, Đ.J. 1990: Enciklopedijski geografski leksikon Jugoslavije. Svjetlost, Sarajevo (in Serbian).
Milentijević, N., Dragojlović, J., Ristić, D., Cimbaljević, M., Demirović, D. and Valjarević, A., 2018:
The assessment of aridity in Leskovac Basin, Serbia (1981-2010), J. Geograph. Inst. "Jovan Cvijić", 68, 249–264. https://doi.org/10.2298/IJGI1802249M
Milosavljević, M., 1990: Klimatologija. Naučna knjiga, Beograd (in Serbian).
Milošević, D., Savić, S. and Žiberna, I., 2013: Analysis of the Climate Change in Slovenia:
Fluctuations of Meteorological Parameters for the Period 1961–2011 (Part I). Bull. Serbian Geograph. Soc. 93, 1–14. https://doi.org/10.2298/GSGD1301001M
Milošević, D., Savić, S., Stankov, U., Žiberna, I., Pantelić, M., Dolinaj, D. and Leščešen, I., 2017:
Maximum temperatures over Slovenia and their relationship with atmospheric circulation patterns. Geografie 122, 1–20. https://doi.org/10.37040/geografie2017122010001
Mudelsee, M., 2010: Climate Time Series Analysis: Classical Statistical and Bootstrap Methods.
Springer, Dordrecht, The Netherlands.
Oliver, E. J., 2005: Temperature Distribution. In (Ed. E. J. Oliver), Encyclopedia of World Climatology, 711–716. Springer, Dordrecht, The Netherlands.
Orlowsky, B., and Seneviratne, S. I., 2013: Elusive drought: uncertainty in observed trends and short- and long-term CMIP5 projections. Hydrol. Earth Syst. Sci. 17, 1765–1781.
https://doi.org/10.5194/hess-17-1765-2013
Popov, T., Gnjato, S. and Trbić, G., 2017: Trends in extreme temperatures indices in Bosnia and Herzegovina: A case study of Mostar. Herald, 21, 107–132. https://doi.org/10.7251/HER2117107P Popov, T., Gnjato, S., Trbić, G. and Ivanišević, M., 2018a: Recent Trends in Extreme Temperature
Indices in Bosnia and Herzegovina. Carpathian J. Earth. Environ. Sci. 13, 211–224.
https://doi.org/10.26471/cjees/2018/013/019
Popov, T., Gnjato, S. and Trbić, G., 2018b: Changes in temperature extremes in Bosnia and Herzegovina: A fixed tresholds-based index analysis. J. Geograph. Inst. “Jovan Cvijić” SASA, 68, 17–33. https://doi.org/10.2298/IJGI1801017P
Papalexiou, S.M., Agha Kouchak, A., Trenberth, K.E., and Foufoula-Georgiou, E., 2018. Global, Regional, and Megacity Trends in the Highest Temperature of the Year: Diagnostics and Evidence for Accelerating Trends, Earth’s Future, 6, 71–79.
https://doi.org/10.1002/2017EF000709
Patterson, M. W., and Hoalst-Pullen, N., 2011: Dynamic equifinality: The case of southcentral Chile's evolving forest landscape. Appl. Geography 31, 641–649.
https://doi.org/10.1016/j.apgeog.2010.12.004
Pew, K. L., and Larsen, C. P. S., 2001: GIS analysis of spatial and temporal patterns of human-caused wildfires in the temperate rain forest of Vancouver Island, Canada. Forest Ecol. Manage. 140, 1–18.
https://doi.org/10.1016/S0378-1127(00)00271-1
Radaković, G.M., Tošić, A.I., Bačević, R.N., Mađan, D., Marković, S.B., and Gavrilov, M.B., 2017:
The analysis of aridity in Central Serbia from 1949-2015. Theor. Appl. Climatol. 133, 887–898.
https://doi.org/10.1007/s00704-017-2220-8
Razavi, T., Switzman, H., Arain, A., and Coulibaly, P., 2016: Regional climate change trends and uncertainty analysis using extreme indices: A case study of Hamilton, Canada, Climate Risk Manage. 13, 43–63. https://doi.org/10.1016/j.crm.2016.06.002
Radusin, S., Oprašić, S., Cero, M., Abdurahmanović, I., Vukmir, G., Avdić, S,, Cupać, R., Tais, M., Drešković, N., Trbić, G. and Jakšić, B., 2013: Second national communication of Bosnia and Herzegovina under the United Nations framework convention on climate change. UNDP, Banjaluka.
Republic Hydrometeorological Service of Republika Srpska, https://rhmzrs.com/?script=lat (accessed 09.02.2019)
Rodić, D. P., 1975: Geografija Jugoslavije. Naučna Knjiga, Beograd (in Serbian).
Sheffield, J., and Wood, E.F., 2007: Projected changes in drought occurrence under future global warming from multi-model, multi-scenario, IPCC AR4 simulations. Climate Dynamics, 31, 79–105.
https://doi.org/10.1007/s00382-007-0340-z
Spinoni, J., Naumann, G. and Vogt, J., 2015: Spatial patterns of European droughts under a moderate emission scenario. Adv. Sci. Res. 12, 179–186. https://doi.org/10.5194/asr-12-179-2015
Spinoni, J., Naumann, G., and Vogt, V. J., 2017: Pan-European seasonal trends and recent changes of drought frequency and severity. Glob. Planetary Change 148, 113–130.
https://doi.org/10.1016/j.gloplacha.2016.11.013
Stagge, J. H., Rizzi, J., Tallaksen, L. M. and Stahl, K., 2015: Future Meteorological Drought Projections of Regional Climate. Tech. Rep, 25, DROUGHT-R&SPI Project.
Teske, S., 2019: Achieving the Paris Climate Agreement Goals. Springer, Netherlands.
https://doi.org/10.1007/978-3-030-05843-2
Trbić, G., Popov, T. and Gnjato, S., 2017: Analysis of air temperature trends in Bosnia and Herzegovina. Geographica Pannonica 21, 68–84. https://doi.org/10.5937/GeoPan1702068T
Trbić, G., Bajić, D., Djurdjević, V., Ducić, V., Cupac, R., Markez, Đ., Vukmir, G., Dekić, R. and Popov, T., 2018: Limits to Adaptation on Climate Change in Bosnia and Herzegovina: Insights and Experiences. In: (eds. Leal Filho W., Nalau J.) Limits to Climate Change Adaptation. Climate Change Management. Springer, Cham, Switzerland. https://doi.org/10.1007/978-3-319-64599-5_14 Tošić, I., Zorn, M., Ortar, J., Unkašević, M., Gavrilov, M.B. and Marković, S.B., 2016: Annual and
seasonal variability of precipitation and temperatures in Slovenia from 1961 to 2011, Atmos.
Res. 168, 220–233. https://doi.org/10.1016/j.atmosres.2015.09.014
Unkašević, M. and Tošić, I., 2013: Trends in temperature indices over Serbia: relationships to large- scale circulation patterns. Int. J. Climatol. 33, 3152–3161. https://doi.org/10.1002/joc.3652 Valjarević, A., Djekić, T., Stevanović, V., Ivanović, R. and Jandziković, B., 2018a: GIS Numerical and
remote sensing analyses of forest changes in the Toplica region for the period of 1953-2013.
Appl. Geography 92, 131–139. https://doi.org/10.1016/j.apgeog.2018.01.016
Valjarević, A., Srećković-Batoćanin, D., Valjarević, D. and Matović V. A., 2018b: GIS-based method for analysis of a better utilization of thermal-mineral springs in the municipality of Kursumlija (Serbia). Renew. Sust. Energy Rev. 92, 948–957. https://doi.org/10.1016/j.rser.2018.05.005 Vukoičić, D., Milosavljević, S., Penjišević, I., Bačević, N., Nikolić, M., Ivanović, R. and Jandžiković,
B., 2018: Spatial analysis of air temperature and its impact on the sustainable development of mountain tourism in Central and Western Serbia. Időjárás 122, 259–283.
https://doi.org/10.28974/idojaras.2018.3.3
XLSTAT, http://www.xlstat.com/en/ (accessed 10.03.2019)
Werz, M. and Hoffman, M., 2016: Europe’s twenty-first century challenge: climate change, migration and security, European View 15, 145–154. https://doi.org/10.1007/s12290-016-0385-7
WMO, 2019: Statement on the State of the Global Climate in 2018. WMO-No. 1233. World Meteorological Organization. Geneva, Switzerland.