DOI:10.28974/idojaras.2018.3.4
IDŐJÁRÁS
Quarterly Journal of the Hungarian Meteorological Service Vol. 122, No. 3, July – September, 2018, pp. 285–304
Statistical structure of day by day alteration of daily average wind speeds
Károly Tar 1* and István Lázár 2
1Institute of Tourism and Geography, University of Nyíregyháza Berek u.4, H-4029, Debrecen, Hungary
2Department of Meteorology, University of Debrecen P.O.B. 13, H-4010, Debrecen, Hungary
*Corresponding author E-mail: tarko47@gmail.com (Manuscript received in final form August 7, 2017)
Abstract⎯ One of the most complex problems of wind power plant operators is to compose a so-called “timetable” that is based on estimating the amount of power produced on the next day divided into small time units. Creation of this timetable could be based on the mathematical statistical method presented in this paper. Our statistical method is based on the construction of a model based on the statistical structure of the change of measured daily average wind speed, that enables the estimation of the probability of decreasing or increasing daily average wind speed by the next day in certain time periods or at various weather conditions. The statistical structure of daily average wind speed changing day by day provides further important information on the wind climate of Hungary and may help protection against wind erosion, building planning, and estimating bioclimatic factors. The basics of the method and the estimation of the sign of changes for the next day are presented in the following. The database is composed of daily average wind speed data measured at nine Hungarian meteorological stations between 1991 and 2000. Studies were performed for the whole period and for anticyclone and cyclone conditions based on Péczely’s macrosynoptic situations and their transitional situations as well. The relative amount characterizing the change of daily average wind speed day by day was defined, and then the most important basic statics were analyzed. The distribution by sign of this amount and the relationship with the actual daily average wind speed were studied. Based on the results, the sign of wind speed change by the next day is estimated. As a conclusion, it can be stated that the presented model yields best results if the present day belongs to cyclone conditions.
Key-words: daily average wind speed, day by day changes of average wind speed,
1. Introduction
The total capacity of established wind power plants in Hungary is 329.325 MW with 172 wind power plants operating at 39 sites. The process of wind energy utilization in Hungary and the evaluation of this process are discussed in detail by Tóth and Bíróné Kircsi (2013, 2014, 2015).
With the integration of wind energy into electricity grids, it is becoming increasingly important to obtain accurate wind speed/power forecasts. Accurate wind speed forecasts are necessary to schedule dispatchable generation and tariffs in the day-ahead electricity market (Bremnes et al., 2002; Kavasseri and Seetharaman, 2009; Shukur and Lee, 2015).
One of the most complex problems of wind power plant operators is to compose a so-called “timetable” that is based on estimating the amount of power produced on the next day divided into small time units. The complexity of the task is given by, for example, the difficulty of predicting wind speed for every hour.
Composition of this timetable could be improved using the statistical method presented in this paper. The basis for the model was established and published in previous works (Tar and Puskás, 2010ab; Tar, 2011, 2014ab, 2015; Puskás et al., 2014; Tar et al., 2015, 2016; Lázár, 2015; Tar and Lázár, 2016). The model presented here is suitable for predicting the probability of the decrease or increase of daily average wind speed, and thus, average wind energy by the next day for certain time periods (e.g., season, year) and in different weather conditions (macrosynoptic conditions), or in the cases of transition between them. Studying the statistical structure of daily average wind speed changes in detail enable us to estimate the average wind speed of the “next day”, on the basis of one of the basic statistics yielding a tool for wind power plant operators for composing the compulsory timetable. Moreover, it will give important information on the wind climate of Hungary and may help to estimate bioclimatic factors, as well.
The basis of the method and the estimation of the sign of changes by the next day that could be utilised from climatological points of view as well are presented in the following.
2. Methods, database
Database of the study is composed of the hourly wind speed data of nine meteorological stations (Szombathely, Győr, Pécs, Budapest, Kékestető, Szeged, Békéscsaba, Miskolc, and Debrecen) for the time period between 1991 and 2000 supplied by the National Meteorological Survey. Location of the stations is given in Fig. 1.
Fig. 1. Geographical location of the observatories comprising the analyzed database.
The data series cannot be regarded homogeneous at all stations, since certain devices or even the stations were moved in the studied period. Although the parameter describing the change of the daily average wind speed is independent of the height of the anemometer with good approximation, wind speed values were transformed for 10 m applying the WMO formula (see e.g., Mezősi and Simon, 1981; Tar and Puskás, 2010a) to make results comparable.
Analyses were made for the whole time period and for anticyclone and cyclone situation groups based on the Péczely’s macrosynoptic conditions and for their various transitions. Macrosynoptic codes of the given days were taken from the works of Károssy (1993, 1998, 2001), and then the days belonging to anticyclone (AG) and cyclone (CG) situations were identified (see, e.g., Péczely, 1961; Tar, 2007; Tar and Puskás, 2010a).
For constructing the model, the average wind speed of every subsequent day has to be known, thus the last day and all days before and after every missing day were deleted from the database. The study period (January 1, 1991 –December 31, 2000) is composed of 3653 days. The number of days taking into consideration varies between 100% (Kékestető, Szeged) and 93.9% (Miskolc) of the 3653 days, because of missing and deleted days. These are called complete time series henceforward.
With a few tenth of difference, 67% and 33% of the studied days belong to AG and CG groups, respectively, at the particular stations. Let us consider that AG/AG, when an AG day is followed by another AG day is the conditional event, while CG/AG means a CG day following an AG one. Similarly, CG/CG and AG/CG days can be defined as well. Their conditional relative frequencies are 83%, 17%, 64%, and 36%, respectively. These results are in accordance with the results of our studies covering four years (Tar and Puskás, 2010b). Days belonging to CG and AG can be followed by any days, therefore, they could be
3. Statistics of the daily relative change of daily average wind speed Daily wind speed day by day is characterized by the relative amount of
p p r nv
v v v −
=
Δ , (1)
where vp and vn are wind speeds of the present and the next day respectively. Δvr is approximately independent of the height of the anemometer. In percentage it shows the change of daily average wind speed compared to that of the previous day.
Since Δvr is the observed value of a probability variable with special structure, their most important statistical functions are analyzed in detail in relation primarily with situation groups and their transitions.
3.1. Basic statistics of relative change 3.1.1. Average values
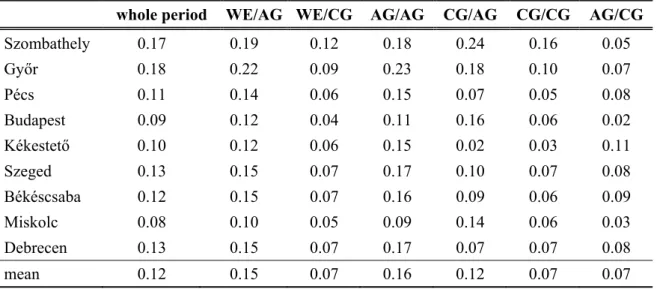
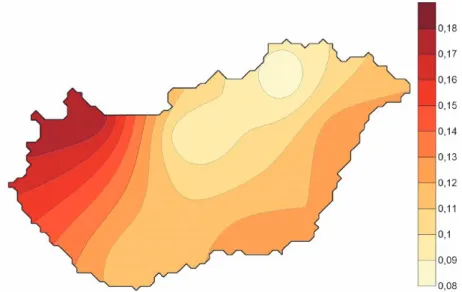
Average values of Δvr in the complete time series and in the various transitions are presented in Table 1. It can be seen that the average is always positive, i.e., the average wind speed of the next day is always greater than that of the previous day in a long-term average. Values range between 0.18 (Győr) and 0.08 (Miskolc) with slight orographic differentiation in the complete time series: greater values appear in Western Transdanubia followed by the data of Great Plain and finally by stations in mountains shown in Fig. 2. Only Budapest does not fit into this series.
Table 1. Mean values of relative changes Δvr
whole period WE/AG WE/CG AG/AG CG/AG CG/CG AG/CG
Szombathely 0.17 0.19 0.12 0.18 0.24 0.16 0.05
Győr 0.18 0.22 0.09 0.23 0.18 0.10 0.07
Pécs 0.11 0.14 0.06 0.15 0.07 0.05 0.08
Budapest 0.09 0.12 0.04 0.11 0.16 0.06 0.02
Kékestető 0.10 0.12 0.06 0.15 0.02 0.03 0.11
Szeged 0.13 0.15 0.07 0.17 0.10 0.07 0.08
Békéscsaba 0.12 0.15 0.07 0.16 0.09 0.06 0.09
Miskolc 0.08 0.10 0.05 0.09 0.14 0.06 0.03
Debrecen 0.13 0.15 0.07 0.17 0.07 0.07 0.08
mean 0.12 0.15 0.07 0.16 0.12 0.07 0.07
Extreme values of Δvr averages are associated with the transitions. Maximum values appear when the present day belongs to AG. The absolute maximum is 0.24 (Szombathely, CG/AG). Among the subsequent series of maximums, the already mentioned orographic character is somewhat stronger. Minimum values appear when the present day belongs to CG except for Kékestető. The absolute minimum is 0.02 (Budapest, AG/CG and Kékestető, CG/AG). This also indicates that orographic effects cannot be detected in the series of minimums.
Fig. 2. Spatial differences of average values of Δvr in the whole time period.
The areal average of Δvr is also greater in AG/AG, CG/AG, and WE/AG transition. The greatest areal average belongs to the AG/AG transition with a value of 0.16. In the remaining three transitions (CG/CG, AG/CG, WE/CG), the average is the same, 0.07.
3.1.2. Variability
The coefficient of variation (relative standard deviation) is applied to analyze the variability of Δvr. Its values varying between 30.84 (Budapest, AG/CG) and 3.24 (Szombathely CG/AG) indicating that its statistical characteristics are very variable. Its maximum values occur at CG/CG and AG/CG transitions except for Kékestető, where maximum values appear at either AG/AG or CG/AG transitions.
In the series of extreme values according to magnitude, no orographic characteristics can be observed.
3.1.3. Minimum, maximum, scale
It seems like Δvr is bounded from below, since its minimum values are not lower than –1, varying between –0.94 (Szeged complete time series, WE/CG, CG/CG) and –0.70 (Kékestető and Miskolc, AG/CG). Maximum values vary in a significantly greater interval: 1.91 (Pécs, CG/AG) and 18.71 (Békéscsaba complete time series, WE/AG, AG/AG), i.e., there is almost a tenfold difference in their values. When the frequency distribution was determined (see Section 3.1.6) classification into intervals with a particular width was performed up to Δvr = 3. Greater values were classified into the same interval. Their frequency varies between 2.6% and 0.2% with an average of 1%.
3.1.4. Median
Studying the median is important, because its sign yields information on the distribution of Δvr according to the sign. If the median is 0, half of the sample elements are negative and the other half are positive. If the median is negative, one half of the sample is composed of only negative and the other half is composed of mixed numbers. This means, that negative Δvr, i.e., decrease of daily average wind speed by the next day has greater probability, while with positive median the opposite occurs.
The absolute value of median is in the range of one hundredth varying between –0.07 and 0.05, except for three cases. The absolute value of median is 0 in 33.3% of the cases, while positive and negative in 23.8% and 42.9% of the cases, respectively. According to these facts, unchanging or increasing average wind speeds in Hungary are more probable (57.1%) than diminishing wind speeds considering the next day. The followings are experienced according to categories:
(1) the median is zero everywhere in the complete time series, (2) the median is zero or positive in the cases of WE/AG and AG/AG, while (3) the median is zero or negative in the case of CG/CG. Regarding to stations: zero or positive median occurred in five (four) categories stations Miskolc and Debrecen (Szombathely, Győr, Budapest, Kékestető, and Békéscsaba). It means that Δvr values are not negative at these stations, i.e., unabating daily average wind speed has greater probability than decreasing. At stations Pécs and Szeged, negative median occurred one time more than positive.
3.1.5. Skewness, kurtosis
Difference of the frequency distribution of Δvr from normal distribution is shown by the values of skewness and kurtosis coefficients by definition determined from the empirical central momentums (Dévényi and Gulyás, 1988). Both statistical functions show that the distribution of Δvr can be very close and also far away from normal distribution, and this is approximately independent of weather and orographic conditions.
3.1.6. Frequency distribution, mode
According to Section 3.1.3, the values of Δvr were classified into 0.2 wide intervals. Detailed analysis of frequency distributions is not given here, as the primary aim was to determine the empirical value of mode (Δvr), defined as the centre of the interval containing the highest number of sample elements. In 90.5%
of all cases (64) this interval is (–0.2; 0.0), i.e., the mode of Δvr is –0.1.
In the rest of the cases, frequencies belonging to mode values are only a few tenth of % greater than that of the intervals containing –0.1. Thus, the most probable value of Δvr is –0.1 which is independent of weather conditions and their transitions and location, that makes the estimation of the average wind speed of the next day relatively simple.
3.2. Distribution of relative change according to sign
In the estimation of relative changes, the analysis of the distribution of Δvr according to sign is essential. As we have seen, the average values of Δvr are positive in all cases, therefore, in the long term, the wind speed of the next day is always greater than that of the previous day. The same was determined when the median was studied. Studying only the weather conditions, the rate becomes the opposite as the rate of negative changes, i.e., decrease is 53.7%.
In Fig. 3 the appearances of the differences between the positive or 0 and the negative values of Δvr (dpn, in°%) are presented by categories. For example, 2.4%
means that the frequency of Δvr≥0 values is 51.2%, while that of negative values is 48.8%.
According to Fig. 3, the value of dpn at WE/AG and AG/AG transitions is positive at every station in the complete time series, i.e., Δvr ≥0 changes appear with greater probability. The probability of average wind speed of the next day greater than that of the previous day is greatest, 56.2% in Miskolc at CG/AG transition, followed by Kékestető with 55.9% at AG/CG transition. Further order is Budapest with 55.6%, Pécs 54.7%, Debrecen 54.5%, Szeged 54.3%, Győr 54.2%, Békéscsaba 53.2%, and Szombathely 53.1%, all of them at AG/AG transition. Average probability of Δvr≥0 is greatest at AG/AG with 54.3%, i.e., at this transition, the increase of the wind speed of the next day in Hungary seem to have greatest probability. Smallest probability appears at CG/CG and AG/CG transitions with 48.6% and 48.5%, respectively. Probability of the selected case is greater than 50% in 58.7% of all cases (63).
Fig. 3. Ratio of differences between the number of Δvr ≥ 0 and Δvr < 0 cases.
Categories containing only negative dpn values cannot be found. The probability of that the average wind speed of the next day would be smaller than that of the previous day is greatest, 57.9% at CG/AG transition in Kékestető, followed by 56.3% at AG/CG transition in Szombathely, and 56.1 % and 55.1%
at AG/CG transition in Győr and Budapest, respectively. The order continues with 52.6% at CG/CG transition in Szeged, 51.5% at CG/AG transition in Pécs, 51.4%
at AG/CG transition in Miskolc, 50.9% at CG/CG transition in Békéscsaba, and 50.8% at CG/AG transition in Debrecen.
When values of dpn are studied by stations in the complete time series, it can be observed that they vary in smaller intervals than at the transitions. The range here is 4.2%, while the average is 4%. Consequently, independently of weather conditions in Hungary, the probability of greater and smaller daily average wind speed of the next day than that of the present day is 52% and 48%, respectively.
National averages of dpn in the rest of the categories are positive at transitions when the present day is AG, and negative if the present day is CG. The order, shown in Fig. 3, is 7.4%, –2.9%, 8.6%, 1.5%, –2.8%, –3.1%.
3.3. Relationship between the sign of relative change and the average wind speed of the present day
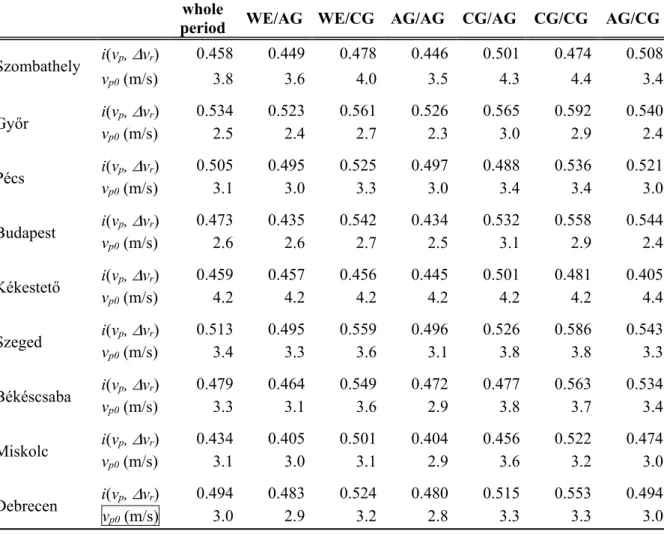
According to Eq. (1) Δvr is in a very complex function with the average wind speed of the present day (vp) considering that the average wind speed of the next day (vn) also depends on this. It is reasonable to regard the (vp,Δvr) relationship stochastic. Closest correlation was found with logarithmic regression. Values of i(vp, Δvr) correlation index is presented in Table 2.
-16 -12 -8 -4 0 4 8 12 16
whole period
WE/AG WE/CG AG/AG CG/AG CG/CG AG/CG
dpn (%)
Szombathely Győr
Pécs Budapest Kékestető Szeged Békéscsaba Miskolc Debrecen mean
Values of i(vp, Δvr) vary between 0.592 (Győr, CG/CG, see Fig. 4) and 0.404 (Miskolc, AG/AG). Regarding absolute values, the maximum coefficient can be found in Győr except for AG/CG transition, when it was found in Budapest.
Considering minimum values, there are no such strict orographic orders.
Considering station orders, maximum values appeared at CG/CG transitions in seven towns, where the exceptions are Szombathely (AG/CG) and Kékestető (CG/AG). This means that except for the latter ones, the maximums of the correlation index belong to the transitions, when the present day is CG.
The regression curve crosses the horizontal, vp axis in all cases. The zero point is vp0. For the points of the regression curve with (x,y) coordinates, y>0 before the zero point and y<0 after the zero point. As a result, it can be assumed, that the sign of the observed values of Δvr are in connection with zero points. Zero points can be regarded threshold values regarding the sign of Δvr. Table 2 also presents the values of vp0.
Table 2. The correlation index i(vp, Δvr) of logarithmic regression and the zero point vp0 of regression function
whole
period WE/AG WE/CG AG/AG CG/AG CG/CG AG/CG Szombathely i(vp, Δvr) 0.458 0.449 0.478 0.446 0.501 0.474 0.508
vp0(m/s) 3.8 3.6 4.0 3.5 4.3 4.4 3.4
Győr i(vp, Δvr) 0.534 0.523 0.561 0.526 0.565 0.592 0.540
vp0(m/s) 2.5 2.4 2.7 2.3 3.0 2.9 2.4
Pécs i(vp, Δvr) 0.505 0.495 0.525 0.497 0.488 0.536 0.521
vp0(m/s) 3.1 3.0 3.3 3.0 3.4 3.4 3.0
Budapest i(vp, Δvr) 0.473 0.435 0.542 0.434 0.532 0.558 0.544
vp0(m/s) 2.6 2.6 2.7 2.5 3.1 2.9 2.4
Kékestető i(vp, Δvr) 0.459 0.457 0.456 0.445 0.501 0.481 0.405
vp0(m/s) 4.2 4.2 4.2 4.2 4.2 4.2 4.4
Szeged i(vp, Δvr) 0.513 0.495 0.559 0.496 0.526 0.586 0.543
vp0(m/s) 3.4 3.3 3.6 3.1 3.8 3.8 3.3
Békéscsaba i(vp, Δvr) 0.479 0.464 0.549 0.472 0.477 0.563 0.534
vp0(m/s) 3.3 3.1 3.6 2.9 3.8 3.7 3.4
Miskolc i(vp, Δvr) 0.434 0.405 0.501 0.404 0.456 0.522 0.474
vp0(m/s) 3.1 3.0 3.1 2.9 3.6 3.2 3.0
i(vp, Δvr) 0.494 0.483 0.524 0.480 0.515 0.553 0.494
Fig. 4. The closest logarithmic relationship between the present day’s average wind speed (vp) and the next day’s relative change (Δvr).
Fig. 4 shows that most of the positive or 0 changes (Δvr ≥ 0) appear when the average wind speed at 10 m height of the present day is smaller than or equal to the zero point, vp ≤ vp0. Maximum and minimum frequency of the event is 48.0%
(Miskolc CG/AG) and 29.9% (Kékestető, CG/AG), respectively. Maximums belong to transitions when the present day is AG at the rest of the stations as well, except for Kékestető. In the case of vp ≤ vp0, frequencies vary between 15.5%
(Kékestető, CG/CG) and 5.5% (Szombathely, CG/AG). Maximums at the rest of the stations also belong to transitions when the present day is CG, except for Pécs.
The rate of frequencies belonging to the two conditions is between 8.6 (Szombathely, CG/AG) and 2.0 (Kékestető, CG/CG). Almost 90% of them are between 2 and 6. Frequency of positive changes is 40.4 % when the average wind speed of the present day is smaller than the zero point of the regression curve and 10.2% when it is greater than the zero point.
Frequencies of negative changes (Δvr < 0) are between 28.5% (Szombathely, CG/CG, Debrecen, WE/AG) and 17.9% (Pécs, WE/CG) in the case of vp ≤ vp0. Maximums belong to transitions when the present day is AG, except for Szombathely and Győr. Greater order is found in the distribution of minimum values: maximums appear at transitions when the present day is CG at every station. Most of the negative changes occur when the average wind speed of the present day is greater than the zero point (vp ≤ vp0). In this case, the maximum frequency is 36.5% (Kékestető, CG/AG) while the minimum is 18.8%
(Szombathely, WE/AG). Maximums at the rest of the stations belong to transitions when the present day is CG. Minimums appear at transitions WE/AG,
∆vr= -0.7406 ln(vp) + 0.7887 i2= 0.3509
-1.5 -1.0 -0.5 0.0 0.5 1.0 1.5 2.0 2.5 3.0 3.5 4.0
0 1 2 3 4 5 6 7 8 9
∆vr
vp[m/s]
Győr, CG/CG
and AG/AG except for Kékestető. Frequency of the two conditions is 1.5 (Szombathely, WE/AG) and 0.5–0.6. Almost 70% of them appear between 0.6 and 1.2. Extreme values are ordered, maximums and minimums appear when the present day is AG and CG, respectively. Probability of negative changes is almost the same on average in the two cases: 23.1% in the case of present day average wind speed smaller than the zero point of the regression curve, and 23% if it is greater.
Average wind speed of the next day, therefore, will probably increase, that is in the case of present day, wind speeds are smaller than the zero point of the regression curve. Smallest probability belongs to the increase of wind speed of the next day when the present daily average wind speed is greater than the zero point. The probability of decrease of the average wind speed of the next day does not differ significantly in the two cases.
The latter statements are independent of location and transitions. If only the sign of Δvr is to be estimated and the average wind speed of the present day is known, the estimation could be performed with high reliability in comparison to the zero point of the regression curve. Zero points, however, are dependent on location and categories. Since its determination is not simple, it is more sensible to select a statistical parameter as a threshold, which is already known or can be calculated easier.
According to our earlier studies (Tar, 2011, 2015; Lázár, 2015), the relationship of the simple change of Δv=vn –vp and the daily average wind speed is described best by linear correlation, and the zero point of the regression line in the complete time series is the same as the average speed of the time period [v].
Based on this result, it was presumed that the average wind speed of the categories could be used instead of zero points because the difference is zero in 12 cases (19%), negative in 6 cases (9.5%) and positive in 45 cases (71.5%). Differences vary between 0.7 m/s (Szombathely, CG/AG) and –0.3 m/s (Kékestető, CG/AG, Szombathely, AG/CG), their average is 0.2 m/s.
Therefore, the conditional relative frequencies of f(Δvr≥0/vp≤[v]), f(Δvr≥0/vp>[v]), f(Δvr<0/vp≤[v]), f(Δvr<0/vp>[v]) were determined, and it is presented in Fig. 5. Based on this figure, the following general statements can be made.
It has the greatest probability (33.2% – 43.7%) at every station, except for Kékestető, CG/AG in every category, that Δvr is positive if the average wind speed of the present day is smaller than the average wind speed of the category. This probability is the second greatest (30.8%) at Kékestető at CG/AG transition after f(Δvr<0/vp>[v]) (~35%). The maximum of the frequency f(Δvr≥0/vp≤[v]) appears always in Szombathely, except for AG/CG situation, thus the absolute maximum is here as well: 43.7% at AG/AG transition. Minimums of the categories split among Békéscsaba, Pécs and Kékestető. The frequency of the event (Δv ≥0/v ≤[v]) varies between 40.1 % (AG/AG) and 36.2% (CG/CG) on average.
Fig. 5. Conditional relative frequencies of the sign of Δvr (f, %) referred to the mean wind speed of categories ([v]): a: f(Δvr≥0/vp≤[v]), b: f(Δvr≥0/vp>[v]) c: f(Δvr<0/vp≤[v]), d: f(Δvr<0/vp>[v])
0 20 40 60
a b c d a b c d a b c d a b c d a b c d a b c d a b c d a b c d a b c d Szombathely Győr Pécs BudapestKékestető Szeged BékéscsabaMiskolc Debrecen
f (%)
0 20 40 60
a b c d a b c d a b c d a b c d a b c d a b c d a b c d a b c d a b c d Szombathely Győr Pécs BudapestKékestető Szeged BékéscsabaMiskolc Debrecen
f (%)
0 20 40 60
a b c d a b c d a b c d a b c d a b c d a b c d a b c d a b c d a b c d Szombathely Győr Pécs BudapestKékestető Szeged BékéscsabaMiskolc Debrecen
f (%)
0 20 40 60
a b c d a b c d a b c d a b c d a b c d a b c d a b c d a b c d a b c d Szombathely Győr Pécs BudapestKékestető Szeged BékéscsabaMiskolc Debrecen
f (%)
0 20 40 60
a b c d a b c d a b c d a b c d a b c d a b c d a b c d a b c d a b c d Szombathely Győr Pécs BudapestKékestető Szeged BékéscsabaMiskolc Debrecen
f (%)
0 20 40 60
a b c d a b c d a b c d a b c d a b c d a b c d a b c d a b c d a b c d Szombathely Győr Pécs BudapestKékestető Szeged BékéscsabaMiskolc Debrecen
f (%)
0 20 40 60
a b c d a b c d a b c d a b c d a b c d a b c d a b c d a b c d a b c d Szombathely Győr Pécs BudapestKékestető Szeged BékéscsabaMiskolc Debrecen
f (%)
whole period
WE/AG
WE/CG
AG/AG
CG/AG
CG/CG
AG/CG
It has the smallest probability (5.5%–16.2%) in every case, that Δvr is positive if the average wind speed of the present day is greater than the average wind speed of the category. Smallest f(Δvr≥0/vp>[v]) frequencies appear in Szombathely except for Győr, CG/CG, the absolute minimum is here as well at AG/CG transition. Maximums split among Budapest, Kékestető, and Békéscsaba with the absolute maximum appearing at Kékestető at the AG/AG transition, 16.2%.
The rate of the probability of the two events shows that the probability of positive changes – i.e., increasing average wind speed of the next day compared to the present day is 3.2 times higher on average if the average wind speed of the present day – is smaller than the average wind speed of the present day.
In case of negative changes (Δvr<0), there is no such great difference between the two cases, i.e., between f(Δvr<0/vp≤[v]) and frequencies of the f(Δvr<0/vp>[v]). The latter frequencies are always second, i.e., greater than previous frequencies. The exception is Szombathely, WE/CG. Average probability of negative change is 20.3% (Δvr<0/vp≤[v]) and 29.1% (Δvr<0/vp>[v]).
Their differences are greater than that when the zero point is selected as threshold.
It can be declared that if the average wind speed of the present day is smaller than the average speed of the category, the probability of the increase of the average wind speed of the next day is 1.4 – 2.3 times greater – 1.9 times on average – than the decrease. On the other hand, if daily average wind speed is greater than the average wind speed of the category then the probability of decrease of average wind speed of the next day is 1.6 – 2.5 times – 2.4 times on average – greater than that of increase. Only [v] depends on the weather conditions.
3.4. Estimating the sign of the relative change
Based on the results of the analyses above, the estimation of the sign of average wind speed change for the next day could be attempted using the average wind speeds at 10 m height of the present day and the categories. The algorithm of this estimation is the following: average wind speeds of the present day (vp) are compared to the average wind speed of the category ([v]). If vp ≤ [v] then Δvr ≥ 0. In the opposite case, Δvr<0 with great probability. Comparing the observed and estimated sign of Δvr the analyzed time series of the reliability of the model could be tested.
The estimated rate of positive change is above 50% at every station and in every category. The maximum of the estimated values appear in Szombathely in all categories while minimums are variable. The absolute maximum is 66.1%
(Szombathely, AG/CG) while the absolute minimum is 53% (Békéscsaba, CG/CG). The rate of positive changes is always overestimated. Differences between the estimated and observed frequencies of Δvr ≥ 0 cases are presented in Fig. 6. It is apparent, that the grade of overestimation is greatest always at
maximum of average values is here as well with 10.7%. The location of minimums is variable and the absolute minimum is 1.7% in Budapest at CG/AG transition. The minimum of average values is not here but at WE/AG category with 5.4%, however, the 5.6% value of AG/AG transition is quite close to it.
Fig. 6. Differences between the estimated and observed frequencies of Δvr ≥ 0 cases.
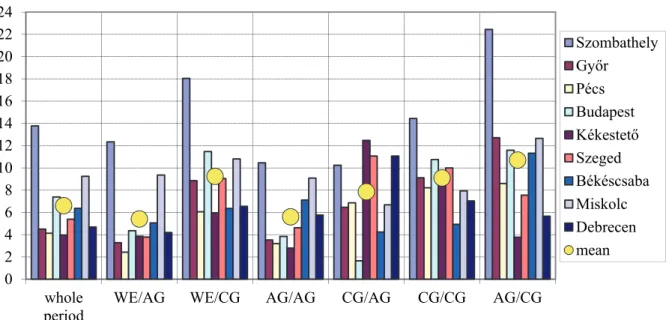
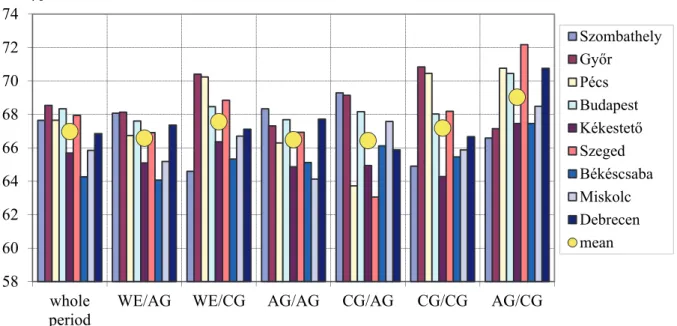
The reliability of the model is indicated by the number of accurate estimations, i.e., when the observed and estimated signs are the same. Rate of these compared to the total number of days in the category is shown in Fig. 7. The highest value is 72.2% in Szeged at AG/CG transition but values higher than 70% could be observed in Győr at WE/CG and at CG/CG transitions, and in Pécs at the same and AG/CG transitions and also in Budapest and Debrecen at the same transition. Our model yields the best results when the present day belongs to a cyclone group. The absolute minimum can be found in Szeged with 63.1% at CG/AG transition and close values appear in WE/AG and AG/AG categories. Our model yields the least number of accurate estimations when the present day belongs to an anticyclone group.
0 2 4 6 8 10 12 14 16 18 20 22 24
whole period
WE/AG WE/CG AG/AG CG/AG CG/CG AG/CG
%
Szombathely Győr Pécs Budapest Kékestető Szeged Békéscsaba Miskolc Debrecen mean
Fig. 7. Rate of accurate estimation of the sign of Δvr referred to the total number of days in the categories.
It was also studied, how the consideration of macrosynoptic conditions and their transitions modify the number of accurate estimations compared to accurate estimations in the complete time series. Fig. 8 presents the difference between accurate estimations of six such categories and the complete time series.
Fig. 8. Differences between the rate of accurate estimations in the macrosynoptic groups 58
60 62 64 66 68 70 72 74
whole period
WE/AG WE/CG AG/AG CG/AG CG/CG AG/CG
%
Szombathely Győr Pécs Budapest Kékestető Szeged Békéscsaba Miskolc Debrecen mean
-5 -4 -3 -2 -1 0 1 2 3 4 5
WE/AG WE/CG AG/AG CG/AG CG/CG AG/CG
%
Szombathely Győr Pécs Budapest Kékestető Szeged Békéscsaba Miskolc Debrecen mean
Differences vary between 4.2% (Szeged, AG/CG) and –4.9% (Szeged, CG/AG). 46.3% (25 cases) are negative, i.e. the number of accurate estimations is smaller than in the complete time series. These appear in categories when the present day belongs to AG in 18 cases. The number of cases when accurate estimations exceed those of the complete time series is 7.4% more (29 cases, 53.7%). These take place in 20 cases in three such categories where the present day is CG. 40.7% of the absolute values of differences are between 2 % and 5%.
The above are reflected by category averages as well: these are negative in the cases of WE/AG, AG/AG, and CG/AG (with values of –0.4, –0.5, –0.5), while positive in the cases of WE/CG and CG/CG, and in the case of AG/CG their values are 0.6, 0.2, and 2.1.
Studying by stations, the number of categories with positive and negative differences is the same in Szombathely, Győr, Pécs, and Szeged (3–3), while the number of negative values is higher in Békéscsaba and Miskolc, and the number of positive values is higher in Békéscsaba, Miskolc, and Debrecen.
As a result, taking into consideration the macrosynoptic conditions and their transitions makes no significant improvement to the accuracy of the estimation.
Exceptions could be the 13 cases, when the absolute values of differences reach or exceed 2%. These could be read from Fig. 8.
4. Summary and conclusions
The process of constructing a mathematical-statistical model is presented in order to estimate the amount of wind power produced on the next day. The final version of the model is capable of estimating the sign of daily average wind speed change for the next day and the magnitude of average wind speed of the next day from the average wind speed of the present day. The basis of the model is the time series of daily average wind speeds observed in the complete time period and transformed into the height of 10 meters. The analyses were carried out for the complete time series and for the groups of days belonging to the cyclone and anticyclone macrosynoptic conditions (CG and AG) and their transitions (CG/CG, AG/CG, AG/AG, CG/AG).
The average (Δvr) of the relative amount yielding the change of daily average wind speed day by day, is always positive, i.e., the average wind speed of the next day on average in the long term, is always greater than that of the previous day.
The regional average is greater when the next day follows a day belonging to AG.
Values of the variation coefficient applied to analyze the variability of Δvr show, that this is a very variable statistical character varying between 30.84 and 3.24.
Δvr can be regarded bottom limited, since its minimum values are not below 1.
These vary between –0.94 and –0.70. Considering maximums, however, almost tenfold differences are found.
The absolute value of median is zero or close to zero except for three cases, between 0.07 and 0.05. In 33.3% of the total number of cases the median is 0, while it is positive in 23.8% and negative in 42.9% of the cases. This also means that the probability of remaining or increasing average wind speed of the next day in national average is greater (57.1%) than that of the decreasing values. Median is zero everywhere in the complete time period.
Skewness and kurtosis coefficients show, that the distribution of Δvr can be very close to or far away from normal distribution, and this distance is approximately independent of weather and orographic conditions.
Independent, of weather conditions and their transitions and also from location, the most probable value of Δvr mode is –0.1, that enables us to estimate the average wind speed value of the next day relatively simple.
In order to estimate this, the analysis of the distribution of Δvr according to its sign is very important. This distribution is characterized in % by dpn showing the differences of negative and greater than, equal to zero values of Δvr. The probability of greater average wind speed of the next day than that of the previous day is greatest with 56.2% in Miskolc and CG/AG transition and smallest with 53.1% in Szombathely at AG/AG transition. The average probability of the Δvr ≥ 0 event is greatest in the AG/AG category with 54.3%, so that the increase of average wind speeds of the next day increase at this transition nationwide.
Smallest values are found at CG/CG and AG/CG transitions in 48.6% and 48.5%.
The probability of the selected event is greater than 50% in 58.7% of the complete series of events (63).
There are no categories containing only negative dpn values. The probability of that the wind speed of the next day is always the same is 57.9% in Kékestető at CG/AG transition.
On national average, independently of weather conditions, the probability of that the average wind speed of the next day is greater/smaller than that of the present day is 52%/48%, respectively.
Δvr is very complex function of the average wind speed of the present day (vp) considering that the average wind speed of the next day (vn) is also dependent on this. Therefore, it is reasonable to regard the (vp, Δvr) relationship stochastic.
The closest correlation is logarithmic regression.
The regression curve crosses the horizontal vp the axis. Let us consider this crossing point to be the zero point, vp0. For the points of the regression curve with coordinates (x,y) y>0 before the zero point and y<0 after the zero point.
Therefore, the sign of the observed values of Δvr could be associated with zero points. Therefore, zero points can be regarded as threshold values in studying the sign of Δvr. Detailed analyses proved this, however, the determination of these threshold values is not simple, therefore, it is practical to choose a possibly known statistical parameter that can be calculated easier. On the basis of previous
research it was presumed, that the average wind speeds of the categories could be used as threshold values instead of zero points.
Based on the results of related detailed analyses it can be declared, that if the average wind speed of the present day is smaller than the average speed of the category, the probability of the increase of the average wind speed of the next day is 1.4 – 2.3 times higher – 1.9 times on average – than that of its decrease. If the average wind speed of the present day is greater than the average speed of the category, the probability of the decrease of the average wind speed of the next day is 1.6 – 5.2 times higher – 2.4 times on average – than that of the increase. Thus, only [v] depends on weather conditions.
The sign of the change of the next day average wind speed was estimated from the average wind speeds at 10 m of the present day and the categories. The reliability of the presented model was tested by comparing the observed and estimated signs of the analyzed time series of Δvr.
The reliability of the model is indicated by the number of accurate estimations, i.e., when the observed and estimated signs are the same. They are given as the rate compared to the total number of days in the category. The highest value is 72.2% in Szeged at AG/CG transition but values higher than 70 % could be observed in Győr at WE/CG and CG/CG transitions, in Pécs at the same and at AG/CG transitions, and also in Budapest and Debrecen at the same transitions.
Our model yields the best results when the present day belongs to a cyclone group.
The absolute minimum can be found in Szeged with 63.1% at CG/AG transition.
Values lower than 65% were found in 10 cases at 6 stations at various transitions.
The average value varies between 69% (AG/CG) and 66.4%. The latter was observed at CG/AG transition, but the values of WE/AG and AG/AG categories are close as well. Our model yields the least number of accurate estimations when the present day belongs to an anticyclone group.
Taking into consideration the macrosynoptic conditions and their transitions makes no significant improvement to the accuracy of the estimation.
In order to make the presented model operatively applicable to estimate the sign of the change of the next day average wind speed, the following conditions have to be set:
- The long-term average of the wind speed of the location measured at the height of 10 m has to be known. This can be determined on the basis of wind maps as well.
- The accurate average wind speed of the present day has to be known. This can be determined at the end of the day from, for example, the hourly data.
In order to use the estimation for constructing a timetable, this data should be known before the end of the day. As a result, a calculated approximate value, like the so-called (primary) terminus averages have to be used.
- Then these have to be transformed to 10 m based on the height of the anemometer.
Acknowledgements: The authors would like to express their thanks to the Hungarian Meteorological Service for providing data for the analysis.
References
Bremnes, J.B., Villanger, F., and AS, K.V., 2002: Probabilistic forecasts for daily power production. In Proceedings of the Global Wind Power Conference, Paris.
Dévényi, D. and Gulyás, O., 1998: Matematika statisztikai módszerek a meteorológiában.
Tankönyvkiadó, Budapest. (In Hungarian)
Kavasseri, R.G. and Seetharaman, K., 2009: Day-ahead wind speed forecasting using f-ARIMA models.
Renew. Energy 34, 1388–1393. https://doi.org/10.1016/j.renene.2008.09.006
Károssy, Cs., 1993: A Péczely-féle makroszinoptikus tipizálás és a helyzetek katalógusa (1951–1992). In (Ed.: Nowinszky, L.) A fénycsapdás rovargyűjtést módosító abiotikus tényezők. OSKAR Kiadó, Szombathely, 113–126. (In Hungarian)
Károssy Cs., 1998: Péczely’s classification of macrosynoptic types and catalogue of weather situations (1992–1997). In (Ed.: Nowinszky, L.) Light trapping of insects influenced by abiotic factors. Part II, Savaria University Press. 117–130.
Károssy Cs. (2001): Characterisation and catalogue of the Péczely's macrosynoptic weather types (1996–
2000). In (Ed.: Nowinszky, L.) Light trapping of insects influenced by abiotic factors. Part III.
Savaria University Press. 75–86.
Lázár I.(2015): Székelyföld szélklímájának statisztikai vizsgálata. PhD értekezés. Debreceni Egyetem, Földtudományi Doktori Iskola. (In Hungarian)
Mezősi, M. and Simon, A., 1981: A meteorológiai szélmérések elmélete és gyakorlata. Meteorológiai Tanulmányok, No. 36.
Péczely, Gy. 1961: Magyarország makroszinoptikus helyzeteinek éghajlati jellemzése. Az Országos Meteorológiai Intézet Kisebb Kiadványai 32. (In Hungarian)
Puskás, J. and Tar, K., Szepesi, J., and Kovács, E., 2014: Statistical Investigation of Subalternation of the Daily Mean Wind Speed on the North-West Region of Carpathian Basin. In (Eds. Kanakidou, M., Mihalopoulos, N., Nastos, P.) COMECAP 2014 e-book of proceedings. ISBN: 978-960-524-430- 9, Vol 3. 85–89.
Shukur, O.B. and Lee, M.H., 2015: Daily wind speed forecasting through hybrid KF-ANN model based on ARIMA. Renew. Energy 76, 637–647. https://doi.org/10.1016/j.renene.2014.11.084
Tar, K. and Puskás, J., 2010a: A napi átlagos szélsebesség időbeli megváltozásának függése a frontos és frontnélküli napok váltakozásától. VI. Kárpát-medencei Környezettudományi Konferencia, Nyíregyházi Főiskola, Nyíregyháza. 321–326. (In Hungarian)
Tar, K. and Puskás, J., 2010b: A napi átlagos szélsebesség megváltozásának kapcsolata az időjárási helyzetekkel. Magyar Energetika 17(3), 30–35. (In Hungarian)
Tar, K. and Puskás, J., 2011: Frontok, szélklíma, szélenergia. A Bakonytól Madagaszkárig.
Tanulmánykötet a 65 éves Veress Márton tiszteletére. 115–124. (In Hungarian)
Tar, K., 2007: Diurnal course of potential wind power with respect to the synoptic situation. Időjárás 111, 261–279.
Tar, K., 2011: A Kárpát-medence szélenergiájáról. VII. Kárpát-medencei Környezettudományi Konferencia, Sapiencia Erdélyi Magyar Tudományegyetem, Kolozsvár. 165–169. (In Hungarian) Tar, K., 2014a: A napi átlagos szélsebességek egymásra következének statisztikai elemzése az Alföldön.
In (Eds.: Fazekas, I. Szabó, V.) Környezettudatos energiatermelés és –felhasználás. Meridián Alapítvány. 96–105. (In Hungarian)
Tar, K., 2014b: Statistical structure of the surface layer wind field in Hungary. Direction, speed and energy of the wind. Lambert Academic Publishing.
Tar, K., 2015: A napi átlagos szélsebesség megváltozásának statisztikai szerkezete. In (Eds.: Kúti, Zs., Puskás, J.) Tiszteletkötet Károssy Csaba 70. születésnapjára. Szombathely. 47–54. (In Hungarian)
Tar, K. and Lázár, I., 2016: Az egymást követő napok átlagos szélsebességeinek statisztikai becslése. In (Ed. Lázár, I.) Környezet és energia a mindennapokban, MTA DAB Környezettudományi Szakbizottság. 109–117. (In Hungarian)
Tar, K., Lázár, I., and Gyarmati, R.. 2015: Statistical estimation of the next day’s average wind speed and wind power. In (Eds.: Ortiz,W., Somogyvári, M., Varjú, V., Fodor, I., Lechtenböhmer, S.) Perspectives of Renewable Energy in the Danube Region. 174–191.
Tóth, P. and Bíróné Kircsi, A., 2013: A szélenergia-hasznosítás 2011. évi legújabb eredményei. Magyar Energetika 20(1), 16–21. (In Hungarian).
Tóth, P. and Bíróné Kircsi, A., 2014: A szélenergia-hasznosítás 2013. évi eredményei. Magyar Energetika 21(6), 38-41. (In Hungarian).
Tóth, P. and Bíróné Kircsi, A., 2015: A szélenergia hasznosítás legújabb eredményei. Légkör 60, 88–91.
(In Hungarian)


![Fig. 5. Conditional relative frequencies of the sign of Δ v r (f, %) referred to the mean wind speed of categories ( [v]): a: f( Δ v r ≥ 0/v p ≤ [v]), b: f( Δ v r ≥ 0/v p >[v]) c: f( Δ v r <0/v p ≤ [v]), d: f( Δ v r <0/v p >[v]) 0204060a b](https://thumb-eu.123doks.com/thumbv2/9dokorg/1428929.121418/12.892.106.782.100.1142/fig-conditional-relative-frequencies-sign-referred-speed-categories.webp)