DOI:10.28974/idojaras.2020.3.4
IDŐJÁRÁS
Quarterly Journal of the Hungarian Meteorological Service Vol. 124, No. 3, July – September, 2020, pp. 363–380
Valorisation of climate conditions in tourist centers of South Serbia
Mila Pavlović, Filip Krstić*, Vedran Živanović, and Aleksandar Kovjanić
Department for Regional Geography Faculty of Geography University of Belgrade Belgrade, Serbia;
*Corresponding author E-mail: filipkrstic88@gmail.com (Manuscript received in final form September 16, 2019)
Abstract⎯ Climate is one of the most important factors of tourism development. Tourism trends and activities are largely determined by climatic conditions, as well as potential tourist investments. South Serbia is characterized by climate diversity on a relatively small territory.
This region is characterized by heterogeneity and richness in geomorphological, hydrological, and cultural tourism resources. However, more intensive tourism development is limited by a weak financial tourism base. The aims of the work are to evaluate climatic conditions in the main tourism centers of South Serbia and to determine the impact of climate change on the development of tourism in the region. Bioclimatic indicators, primarily the tourism climatic index, were used as a statistical and qualitative method for the evaluation of climatological data for the needs of tourism. The results of the research will point to the advantages, but also to the deficiencies of the climate as a tourism resource of South Serbia.
Key-words: climate, tourism, South Serbia, regional development, tourism climatic index
1.Introduction
Climate has a significant impact on the development of the tourism and recreation sector. In some regions, it represents the resource, which is the development basis for this sector of economy. However, climatic characteristics of a certain region can be both push and pull factors regarding the development of tourism. The adverse climatic characteristics of a particular region (low mean temperatures, increased air humidity, high precipitation, reduced insolation, increased wind
frequency and speed, etc.) represent the push factors, which increase the tourist movement of the local population towards regions with more favorable climatic features. Smith (1993) defines climate-dependent tourism as tourism where the climate itself attracts visitors who expect favorable weather conditions in their holiday destination (typical example is the Mediterranean region). Climate changes are recognized by the governing structures and the scientific community as an important problem of social development and the environment. Although estimates vary widely depending on the modeling procedures used, climate change scenarios suggest that the global average surface temperature will increase by 1.4–5.8 °C between 1990 and 2100. Projections regarding global mean sea level indicate a rise of between 0.09 and 0.88 meters throughout the same period (Gao et al., 2017). An increase in the frequency and intensity of extreme weather events (floods, droughts, heat waves, intensive storms, etc.) is also expected (Amelung et al., 2007).
Climate change represents a major threat to sustainable development of all economic sectors. Tourism sector is particularly vulnerable, considering its high dependence on climate as a tourism resource. There are several key risks resulting from climate change, that impact on economic sectors including tourism: risk of disrupted livelihoods resulting from sea level rise and coastal flooding; inland flooding in urban areas and periods of extreme heat; influence on infrastructure network and services; and risks of loss of ecosystems and biodiversity. Surface temperature is projected to rise over the 21st century under all assessed emission scenarios. Heat waves will also occur more often, and they will last longer.
Extreme precipitation events will become more intense. These climatic patterns will have negative impact on global tourism industry (IPCC, 2014).
Climate change affects the climatic tourism resource of certain regions, as well as the competitiveness of tourism travel and tourism expenditure between different tourism regions. Due to climate changes, some regions are likely to experience substantial increase in attractiveness due to improvements in their weather conditions. Others may become significantly less appealing to tourists, leading to shifts in the temporal visit patterns and/or actual declines in the number of tourists (Amelung et al., 2007). Climate change is considered to be a catalyst for structural changes in tourism. Due to climate change, snow cover in many tourist winter centers in Europe (especially in the Alps) will diminish. This will have a lasting negative impact on tourism industry (Elsasser and Bürki, 2002).
Climatic characteristics, as well as their variability, affect the length and quality of the tourism season, and therefore, the profitability of the tourism economic sector. Hence, the vulnerability of the tourism sector due to climate variability, as well as long-term climate change, have been the subject of research of many scientific papers (Scott аnd MacBoyle, 2001; Belén Gómez, 2005;
Amelung and Viner, 2006; Tzu-Ping and Matzarakis, 2008; Perch-Nielsen et al., 2010; Joksimović et al., 2013; Jahic and Mezetovic, 2014; Basarin et al., 2014;
Agarin, Jetzkowitz and Matzarakis, 2010; Anđelković et al., 2016; Roshan,
Yousefi et al., 2016; Weir, 2017; Kovacs et al., 2017; Valjarević et al., 2017;
Gavrilov et al., 2018; Roshan et al., 2018; Vukoičić, et al., 2018; Yan et al., 2018;
Fitchett and Hoogendoorn, 2018). The results of climate changes research in tourism regions are used when planning tourism activities, tourism season, location of tourism centers and infrastructure. This research has an important applicative purpose. The first multidisciplinary studies of climate for the needs of tourism appear in works by Houghten and Yaglou (1923), Bedford (1948), and Fanger (1970). They pointed to the ratio of radiation, insolation, air temperature, humidity, and wind to temperature, humidity, and metabolic processes in the human body (bio-climatological parameters). Early climate indices included simple climatic indicators, while in Besancenot et al. (1978), Mieczkowski (1985), de Freitas (1990), Becker (1998), Belén Gómez (2004), Matzarakis et al. (2008), Matzarakis (2009), Roshan et al., (2016) and Sabzevari et al. (2018) more complex indicators and equations have been used regarding the energy balance of the human body - indexes of comfort.
From the perspective of tourism, South Serbia is an underdeveloped and unutilized region. Its abundance of natural and anthropogenic tourism resources provides a real potential for affirmation of various types of tourism. Pan-European Corridor X, which is essential for the development of transit tourism in Serbia, passes through central parts of South Serbia (the South Morava valley). However, in order to improve the level of tourism development, it is necessary to provide a quality infrastructure network, a quality receptive superstructure, especially in terms of the quality and quantity of accommodation facilities. There are favorable conditions for the development of several types of tourism in the region: spa and wellness tourism, mountain/ski tourism, city and cultural tourism, rural tourism, and ecotourism.
Within the studied territory, several tourism regions can be distinguished, of which only Kopaonik has used its potential for tourism development. The Kopaonik tourism region is the most developed mountain tourism center of Serbia. It is recognized as a winter tourism center with modern accommodation facilities. Although mountain Kopaonik occupies a central position in Serbia, the Kopaonik meteorological station is taken as a representative of the mountain climate of South Serbia, because it borders this region from the west. Kopaonik is the center of winter sport tourism, and to a lesser extent of recreational, congress, and event tourism (Bojović, 2012). Niš is taken as an example of city break and cultural tourism, but in the city and its immediate surroundings there is potential for more intensive development of spa, recreational, adventurous, and transit tourism. The South Morava tourism region is distinguished by the quantity and quality of geomorphological, hydrographic and cultural tourism values.
However, as in the rest of the studied region, excluding Kopaonik, the tourism infrastructure is underdeveloped, which has a negative impact. This tourism region has a favorable transport geographical position (Pan-European Corridor X). Vranjska Spa was taken as the spa tourism center in the far south of the region.
Kuršumlija is a typical representative of spa tourism taking into account the three
spa resorts in its vicinity, located on the slopes of Kopaonik (Lukovska Spa and Kuršumlijska Spa1) and Radan mountain (Prolom Spa). Lukovska Spa is located at the elevation of 681 m, and therefore, it complements its balneological and sports-recreational tourism offer with elements of winter mountain tourism. The mountain zone east and west of the South Morava valley provides opportunities for the development of mountain, recreational, and cultural tourism as well. Fig. 1 presents the location of studied meteorological stations and tourism destinations.
Fig. 1. Geographical positions of meteorological stations and studied tourism destinations
The aim of this paper is to point out the tourism potential of South Serbia, taking into account the different types of climate of this region. Also, the aim is to analyze tourism trends and the utilization of tourist capacities in relation to climatic conditions. In order to better understand the climate change and its actuality, the paper analyses the climatic period from 1990 to 2016. We should also point out certain methodological limitations that the authors of the paper have encountered. These constraints primarily relate to the lack of specific time series for individual climatic parameters, which resulted in a smaller number of meteorological stations involved in the research. Also, the network of stations itself is not sufficiently branched out through the region and does not cover all the climatic altitude zones, nor all tourism regions within the studied territory.
1 Despite its long tradition (over a century long) and the medicinal features of its thermal mineral waters, the Kuršumlijska Spa has had no tourism function since 2006, therefore, it will not be the subject of research in this paper.
2.Materials and methods
For the purpose of climate valorization in the tourism centers of South Serbia, we selected four tourism centers: Kopaonik, City of Niš, City of Vranje, and Kuršumlija’s spas (Lukovska, Prolom, and Kuršumlijska Spa). The primary approach to this choice is regional. The mentioned locations are situated in different parts of South Serbia. Each one is distinguished by different natural conditions, geographical, transport, and tourist positions. The second reason for this choice is the different forms of tourism attractions, conditioned by specific natural and anthropogenic tourism values. One of the main reasons was the availability of the necessary data for calculating the tourism climatic index from nearby meteorological stations.
3.Tourism climatic index (TCI)
Tourism climatic index (TCI) is a synthetic statistical and qualitative method which aims to determine the impact of the climate (the most relevant climate elements) on the quality of tourism experience (Mieczkowski, 1985). This index is based on bioclimatic indicators, in fact on the degree of physical comfort of people in different climatic conditions. Based on the average monthly values of seven climatic parameters (average daily maximum air temperature, average daily air temperature, average daily minimum air humidity, average daily air humidity, total precipitation, total insulation, and average wind speed), Mieckowski presented a model which can be used for calculating the tourism climate valorization potential.
The tourism climatic index values are obtained on the basis of the following formula:
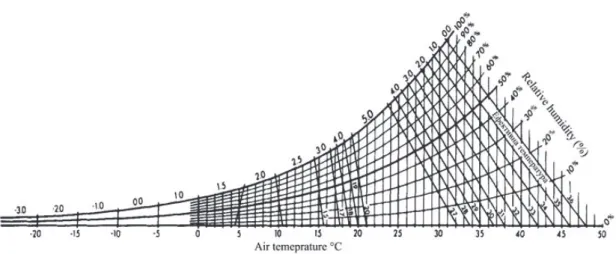
TCI = 2(4Tc + Tc24 + 2R + 2S + W). (1) Since tourism activities mostly occur during the day, temperature and relative air humidity have the greatest importance for calculating TCI. Tc signifies thermal comfort, which is obtained by combining the maximum daily temperature and the minimum daily relative air humidity. The values of both variables usually occur between 12 and 16 hours p.m., when tourists tend to be most active in the open. Thermal comfort for 24 hours (Tc24) is obtained by combining the average daily temperature and the average daily relative air humidity. The values of both indicators are derived from the diagram presented in Fig. 2. Thermal comfort is defined as condition of thermal neutrality (thermal benefits) in which the heat conditions of the environment and the human body are balanced. R signifies the average precipitation (mm), S is the average daily insolation (hours per day), and W is the average wind speed (m/s). The values of each parameter range from -3 points (extremely unfavorable) to 5 points (optimal). The sum of these
components is multiplied by 2, so that the maximum possible TCI score can reach 100. Although these indices are designed based on the available biometric literature and climate data of the time, the system for valuing these subindices as well as the final TCI values are descriptive and subjective. TCI is a method of systematic evaluation of tourism climate in different regions of the world, using a scale that is easily comparable. The TCI values are descriptively evaluated in the following way: the ideal time (index 90 – 100), excellent (80 – 89), very good (70 – 79), good (60 – 69), acceptable (50 – 59), possible (40 – 49), undesirable (30 – 39), very undesirable (20 – 29), extremely undesirable (10 – 19), and impossible (-30 – 9) (Mieczkowski, 1985).
Fig 2. Diagram of thermal comfort evaluation (Tc) (Mieczkowski,1985).
Despite combining several different components, the obtained results of TCI are not compatible with all tourist activities and types of tourism. Certain tourist activities (in accordance with the types of tourism) take place during different climatic conditions compared to those with a diminishing, or even negative impact (according to TCI). In particular, TCI is not relevant for winter mountain tourism.
For tourism centers of this type, the length of snow cover, insolation, air temperature, wind speed, and albedo are of crucial importance (Matzarakis, 2006).
Table 1. Matrix for evaluating precipitation, insolation, and wind
Points R (mm) S (h) W (m/s)
5.0 ≤ 14.9 >10 < 0.8
4.5 15.0 – 29.9 9 – 10 0.8 – 1.5
4.0 30.0 – 44.9 8 – 9 1.6 – 2.5
3.5 50.0 – 59.9 7 – 8 2.6 – 3.3
3.0 60.0 – 74.9 6 – 7 3.4 – 5.4
2.5 75.0 – 89.9 5 – 6 5.5 – 6.7
2.0 90.0 – 104.9 4 – 5 6.8 – 7.9
1.5 105.9 – 119.9 3 – 4 -
1.0 120.0 – 134.9 2 – 3 8.0 – 10.7
0.5 135.0 – 149.9 1 – 2 -
0 150.0 – 209.0 0 – 1 >10.7
-0.5 - - -
-1.0 210.0 – 269.9 - -
-1.5 - - -
-2.0 270.0 – 329.9 - -
Source: Mieczkowski, 1985
According to Köppen climate classification, in the region of South Serbia the C (moderately warm) and D climate types (moderately cold) are predominant (including several types and subtypes). Therefore, the predominant climate throughout South Serbia, including the research areas of Niš, Vranje, and Kuršumlija, belongs to the Cfb subtype (a moderately warm and humid climate with moderate summer temperatures). The highest parts of Kopaonik mountain, including the meteorological station on this mountain, are located in the Dfc climate zone (a moderately cold and humid climate with moderate summer temperatures). This climate is typical of mountain areas over 1200 m above sea level. We can also identify the transitional subtype between these two climates – the Dfb climate, which is characterized by a moderately cold and humid climate with warm summer temperatures (Milovanović et al., 2017).
4.Results
The continuous development of the four selected tourist centers resulted in an increase in the number of tourist visits. The number of tourists, during the observed ten-year period 2007–2016, increased from 177,193 to 232,555, which resulted in an increase of 31.2%. Positive changes were also reflected in the increase of overnight stays by 28.8%. Looking at these tourism centers collectively, accommodation capacities are occupied by tourists more evenly throughout the year. The most visited month was December (10.1%), while the smallest number of tourists was recorded in November (6.1%).
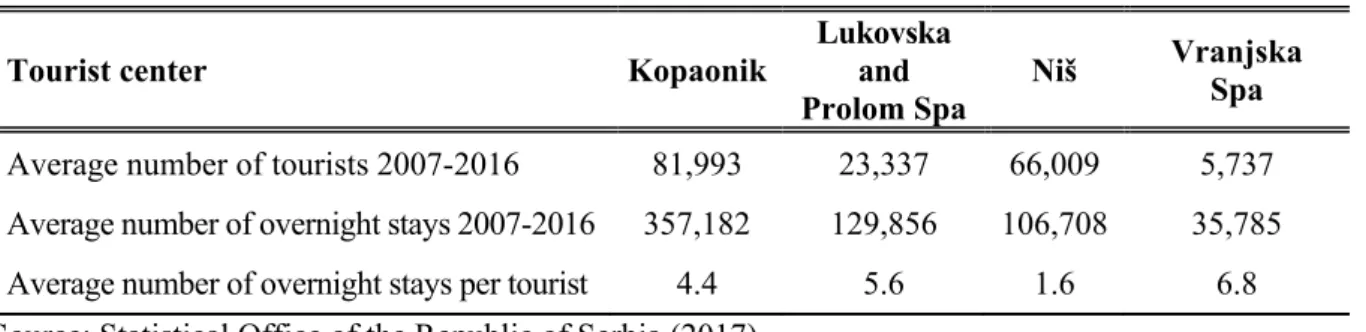
From 2007 to 2016, the highest average number of tourists was recorded in Kopaonik (81,993 or 46.4%), as indicated by the data in Table 2. In accordance with the largest number of tourists, Kopaonik also has a leading position in the number of overnight stays (357,182 or 56.7%). The second largest tourist center is the city of Niš with an average number of about 66,000 tourists. It is followed by Kuršumlija’s spas and Vranjska Spa with the smallest average number of tourists. Regarding the place of origin, domestic tourists are predominant (70.5%).
During the observed period, there was a constant increase in the number and relative share of international tourists (from 21.8% to 29.5%). Niš is an important tourist center for this part of Serbia and a transit city, in 2016 it had a higher share of foreign tourists in the total number of tourists (52.5%). That same year, the share of international tourists was practically negligible only in Vranjska Spa (6.2%).
Table 2. Basic indicators of selected tourist centers
Tourist center Kopaonik
Lukovska and Prolom Spa
Niš Vranjska Spa
Average number of tourists 2007-2016 81,993 23,337 66,009 5,737 Average number of overnight stays 2007-2016 357,182 129,856 106,708 35,785 Average number of overnight stays per tourist 4.4 5.6 1.6 6.8 Source: Statistical Office of the Republic of Serbia (2017)
According to the length of the average stay of tourists expressed through the average number of overnight stays of one tourist, the mentioned tourist centers can be classified into two types. Vranjska Spa is an example of a stationary form of tourism. In spite of the smallest number of tourist visits, the longest average stay is recorded in this spa (6.8). Vranjska Spa has a special rehabilitation hospital, which is why this tourist center has a primary healthcare function. The average
number of overnight stays recorded in Kopaonik and in Kuršumlija’s spas is smaller than in Vranjska Spa. These tourist centers also have healthcare, sports, and recreational functions. With the shortest average stay of tourists (1.6), Niš is a typical example of a city break and transit tourism destination.
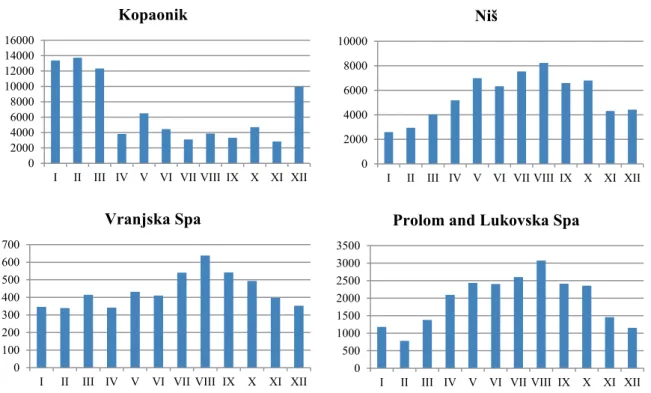
Fig. 3 shows the average number of tourists by months in tourism centers of South Serbia. According to this data, the tourism centers of South Serbia are not characterized by seasonality in tourism travel. However, during the summer months, the largest share of tourist visits (30–36%) and overnight stays (30–42%) is recorded in Niš and in the spa tourism centers of South Serbia. The winter minimum in tourism travel is only noticeable in the spas of Kuršumlija (13.4% of tourist visits and 9.7% of overnight stays). Kopaonik, as the most important center of winter tourism in Serbia, has a somewhat more pronounced seasonality. During the winter months (December-March), an average of 60% of visits and 69% of overnight stays are recorded in Kopaonik. Here, tourism travel is minimal during the summer months (around 14% of tourist arrivals and overnight stays).
Fig. 3. Average number of tourists by months in Kopaonik, Niš, Prolom, Lukovska, and Vranjska Spa. Source: Statistical Office of the Republic of Serbia (2017).
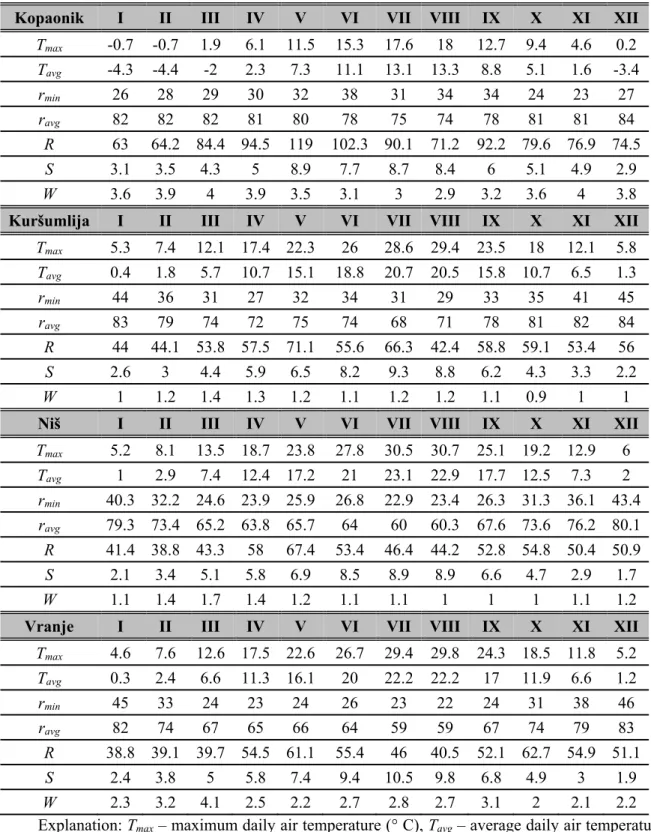
The climate indicators which are used to determine the TCI for selected tourism centers are shown in Table 3. The analysis included the data from the following meteorological stations: Kopaonik (1.710 m), Kuršumlija (382 m), Niš
0 2000 4000 6000 8000 10000 12000 14000 16000
I II III IV V VI VII VIII IX X XI XII
Kopaonik
0 2000 4000 6000 8000 10000
I II III IV V VI VII VIII IX X XI XII
Niš
0 100 200 300 400 500 600 700
I II III IV V VI VII VIII IX X XI XII
Vranjska Spa
0 500 1000 1500 2000 2500 3000 3500
I II III IV V VI VII VIII IX X XI XII
Prolom and Lukovska Spa
(210 m), and Vranje (432 m). The data of each indicator refers to the mean monthly values for the 27-year period from 1990 to 2016.
Table 3. Average monthly values of climatic parameters for Kopanik, Kuršumlija, Niš, and Vranje
Kopaonik I II III IV V VI VII VIII IX X XI XII Tmax -0.7 -0.7 1.9 6.1 11.5 15.3 17.6 18 12.7 9.4 4.6 0.2
Tavg -4.3 -4.4 -2 2.3 7.3 11.1 13.1 13.3 8.8 5.1 1.6 -3.4
rmin 26 28 29 30 32 38 31 34 34 24 23 27
ravg 82 82 82 81 80 78 75 74 78 81 81 84
R 63 64.2 84.4 94.5 119 102.3 90.1 71.2 92.2 79.6 76.9 74.5 S 3.1 3.5 4.3 5 8.9 7.7 8.7 8.4 6 5.1 4.9 2.9 W 3.6 3.9 4 3.9 3.5 3.1 3 2.9 3.2 3.6 4 3.8 Kuršumlija I II III IV V VI VII VIII IX X XI XII
Tmax 5.3 7.4 12.1 17.4 22.3 26 28.6 29.4 23.5 18 12.1 5.8 Tavg 0.4 1.8 5.7 10.7 15.1 18.8 20.7 20.5 15.8 10.7 6.5 1.3
rmin 44 36 31 27 32 34 31 29 33 35 41 45
ravg 83 79 74 72 75 74 68 71 78 81 82 84
R 44 44.1 53.8 57.5 71.1 55.6 66.3 42.4 58.8 59.1 53.4 56 S 2.6 3 4.4 5.9 6.5 8.2 9.3 8.8 6.2 4.3 3.3 2.2
W 1 1.2 1.4 1.3 1.2 1.1 1.2 1.2 1.1 0.9 1 1
Niš I II III IV V VI VII VIII IX X XI XII Tmax 5.2 8.1 13.5 18.7 23.8 27.8 30.5 30.7 25.1 19.2 12.9 6
Tavg 1 2.9 7.4 12.4 17.2 21 23.1 22.9 17.7 12.5 7.3 2 rmin 40.3 32.2 24.6 23.9 25.9 26.8 22.9 23.4 26.3 31.3 36.1 43.4 ravg 79.3 73.4 65.2 63.8 65.7 64 60 60.3 67.6 73.6 76.2 80.1 R 41.4 38.8 43.3 58 67.4 53.4 46.4 44.2 52.8 54.8 50.4 50.9 S 2.1 3.4 5.1 5.8 6.9 8.5 8.9 8.9 6.6 4.7 2.9 1.7
W 1.1 1.4 1.7 1.4 1.2 1.1 1.1 1 1 1 1.1 1.2
Vranje I II III IV V VI VII VIII IX X XI XII Tmax 4.6 7.6 12.6 17.5 22.6 26.7 29.4 29.8 24.3 18.5 11.8 5.2
Tavg 0.3 2.4 6.6 11.3 16.1 20 22.2 22.2 17 11.9 6.6 1.2
rmin 45 33 24 23 24 26 23 22 24 31 38 46
ravg 82 74 67 65 66 64 59 59 67 74 79 83
R 38.8 39.1 39.7 54.5 61.1 55.4 46 40.5 52.1 62.7 54.9 51.1 S 2.4 3.8 5 5.8 7.4 9.4 10.5 9.8 6.8 4.9 3 1.9 W 2.3 3.2 4.1 2.5 2.2 2.7 2.8 2.7 3.1 2 2.1 2.2 Explanation: Tmax – maximum daily air temperature (° C), Tavg – average daily air temperature (°C), rmin – minimum daily relative humidity (%), ravg – average daily relative humidity (%), R – total precipitation (mm ), S – total daily insolation (h), W– average wind speed (m/s).
Source: Meteorological yearbook (2017)
5.Discussion
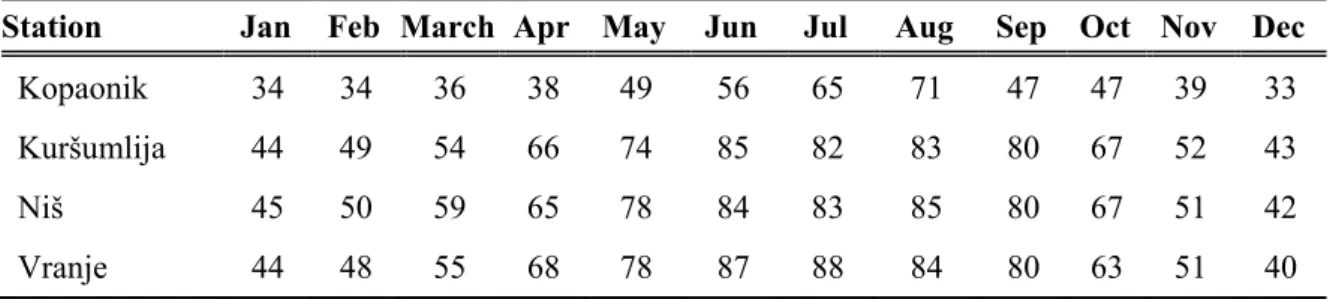
According to the data, the average monthly values of the tourism climatic index (TCI) are calculated for the period from 1990 to 2016 (Table 4). The obtained results indicate a twofold impact of the climate conditions on the development of tourism in South Serbia (there are considerably more favorable climatic conditions in Kuršumlija, Vranje, and Niš, compared to Kopaonik). The natural factor is emphasized as the main determinant that affects the quality and duration of the favorable climatic conditions for the development of tourism.
Table 4. Total values of TCI by months
Station Jan Feb March Apr May Jun Jul Aug Sep Oct Nov Dec
Kopaonik 34 34 36 38 49 56 65 71 47 47 39 33
Kuršumlija 44 49 54 66 74 85 82 83 80 67 52 43
Niš 45 50 59 65 78 84 83 85 80 67 51 42
Vranje 44 48 55 68 78 87 88 84 80 63 51 40
The average monthly TCI values in South Serbia range from 33 (undesirable) to 88 (excellent) index points. The contrast between the summer (July, August, and September) maximum and the winter (December, January and February) minimum of TCI values is obvious. It sets summer apart as the most suitable season for the development of tourism in South Serbia. Between Kopaonik and the other three reference meteorological stations, there is a significant difference of TCI values. Altitude is the main climatic factor that lowers TCI values in Kopaonik. The average monthly temperatures from December to March do not exceed 0o C (from -2 оC to -4.5 оC), while the mean November temperature is 1.6 оC, and in April it is only 2.2 oC. According to the TCI and because of extremely low values of air temperature and insolation, the period from November to April is undesirable in terms of climatic conditions for the development of tourism. Due to the fact that Kopaonik is the leading center of ski tourism in Serbia, the significance of TCI should be taken with reservations. In the months (December, January, February, and March) with the lowest TCI values (from 33 to 36 index points), 60% of the annual tourist traffic is achieved. Because of this fact, it is noticed that TCI ignores the qualitative characteristics of some climatic elements that are crucial for the development of winter tourism (length of snow cover and its depth). The same conclusion was drawn on the case of TCI assessment for mountain tourist places of Montenegro (Joksimović et al., 2013).
With higher temperature and insolation from May to August, there is a continuous increase in TCI values. Unlike the other three observed meteorological stations in South Serbia, the maximum TCI values in Kopaonik occur in two months (July – good, August – very good). July and August are the hottest (with a mean monthly temperature above 13oC) and the sunniest (with an insolation value of more than 8h per day) months in Kopaonik. In September, the weather conditions deteriorate, which is followed by an evident drop in the values of all climatic elements, as well as TCI (from 71 to 41 index points).
In accordance with different climate factors that shape the climate of lower altitudes in South Serbia, there are significantly different TCI values in this part of the region. Although the observed cities are located at the opposite ends of the studied area, Kuršumlija, Niš and Vranje have a very similar monthly regime of TCI changes. In all of the three cities, during the winter period, TCI ranges between 40 and 49 index points. Compared to Vranje and Kuršumlija, the first spring month (March) in Niš is warmer by 1.5 o C to 2 o C. This is why the value of TCI is higher in Niš. The biggest differences in TCI values between these three cities are in July (Vranje 88, Niš 83, Kuršumlija 82). Although Niš is the hottest city in the region (the mean temperature in July is 23.1 oC), the length of direct sunshine (insolation) results in increasing the July TCI value in Vranje. The surroundings of the Kuršumlija basin, i.e., Kopaonik, Radan and Vidojevica mountains, lead to a reduction of average summer temperatures by one to two degrees. With lower temperatures, slightly higher air humidity (up to 10% higher than in Vranje and Niš), lower wind speeds and a higher insolation value (during July and August Kuršumlija is sunnier than Niš). There are very favorable bio–
climatological conditions for the development of tourism in this part of South Serbia. With the rapid decline of air temperatures and insolation in autumn months, the TCI decreases, and climatic conditions vary, from good to acceptable.
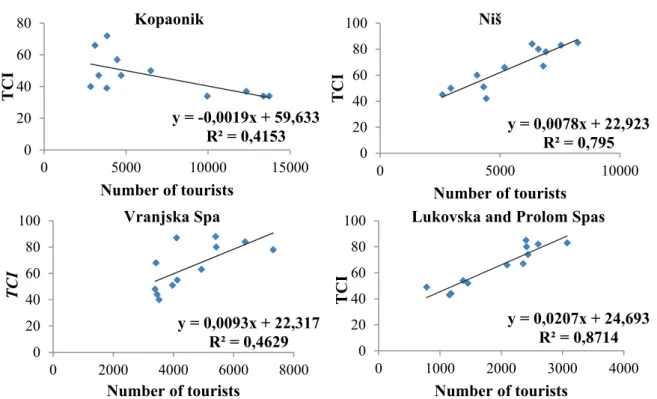
Fig. 4 and Table 5 show the regression and correlation analysis. The aim of this analysis is to determine the connection between the annual TCI regime and the number of tourists in the selected tourism centers.
The lowest coefficient of correlation (-0.65) and regression (0.41) is recorded in Kopaonik. Fig. 4 indicates a negative link between the TCI and the number of tourists, which was confirmed by the correlation coefficient value of -0.65 (Table 5). Negative values of correlation and regression occur, because TCI reaches the highest values in July and August, and the number of tourists in January, February, and March (in these months, TCI is on a minimum level).
Kopaonik is an example that shows the irrelevance of TCI in assessing climate conditions for the development of tourism in winter tourism centers.
Exceptionally low temperatures in the winter months and a low insolation value cause the occurrence of minimum TCI values in Kopaonik at the peak of the tourist season. In order to increase the relevance of this index, when assessing the climate conditions for the development of winter tourism centers, it is necessary to add new climatic elements such as the height and length of snow cover. Also,
low air temperatures during the winter months should be included to increase the TCI values. We can conclude that Kopaonik has insufficiently used its potentials for development of tourist activities during the summer months.
Fig. 4. Regression analysis between the TCI values and the number of tourists.
Table 5. Coefficient of correlation
Tourism centres Coefficient of correlation
Kopaonik -0.65 Lukovska and Prolom Spa 0.93
Niš 0.89
Vranjska Spa 0.68
Coefficients of regression and correlation show very high values in Niš. The end of summer and the beginning of autumn are the periods with the largest number of tourists in this city. Also, TCI still records high values in these months, which leads to a high coefficient of correlation (0.89). In many larger urban centers, autumn is the period of the year with the highest number of tourists. Niš is characterized by a rich touristic offer during the summer months. This is why
y = -0,0019x + 59,633 R² = 0,4153 0
20 40 60 80
0 5000 10000 15000
TCI
Number of tourists Kopaonik
y = 0,0078x + 22,923 R² = 0,795 0
20 40 60 80 100
0 5000 10000
TCI
Number of tourists Niš
y = 0,0093x + 22,317 R² = 0,4629 0
20 40 60 80 100
0 2000 4000 6000 8000
TCI
Number of tourists Vranjska Spa
y = 0,0207x + 24,693 R² = 0,8714 0
20 40 60 80 100
0 1000 2000 3000 4000
TCI
Number of tourists Lukovska and Prolom Spas
the season of increased tourist numbers starts in July. Because of the favorable geographical position, at the point of contact of two major highways of the Balkan Peninsula (E75 and E80), during the summer season Niš is visited by an increasing number of tourists who are in transit towards the Aegean Sea resorts.
Compared to Niš, correlation (0.68) and regression (0.46) coefficients in Vranje show significantly lower values. From November to June, there is on average 3,400 to 4,200 tourists staying in the spa resort. July, August, and September are the months with a slightly larger number of tourists (between 5,400 and 6,300). The reason for low correlation and regression values is a relatively even number of tourists in Vranjska Spa throughout the year on the one hand, and the large seasonal variations of the TCI on the other (the number of tourists does not decrease with a decrease of TCI values).
The highest correlation (0.93) and regression (0.87) coefficient values are obtained in Kuršumlija (Lukovska and Prolom Spas). The monthly regime of the number of tourists and TCI are fully harmonized in this area. The peak of the tourist season coincides with the maximum TCI values. Also, during the autumn and winter months, both indicators fall equally. 60% of the annual turnover of tourists is realized from June to September – the months during the year when the climatic conditions for the development of tourism are very good (from 70 to 80 ТCI index) and excellent (from 80 to 90 TCI). The extremely high correlation coefficient indicates a very high valorization of bioclimatic potentials for the development of tourism in Lukovska and Prolom Spas.
6.Conclusion
Based on the TCI value, the territory of South Serbia has very favorable conditions for the development of tourism. However, the climate is not sufficiently valorized as a tourism resource, in comparison to the tourism potential that the region has as a whole. We should take into account the relatively small number of tourists, inadequate tourism infrastructure, and the insignificant role of tourism in the economic structure of this underdeveloped region of Serbia. In addition, the TCI shows that the climate, mainly in spa resorts, does not play a decisive role in tourist visits and the utilization of tourism centers in this region.
The tourism climate index used in this paper has certain limitations. The limitations refer to its application in mountain touristic centers. Mountain tourism centers are predominantly focused on the development of winter tourism, which means that certain climatic elements, that are excluded by Mieczkowski (such as snowfall, snow cover and length), have a major impact on the development of tourism. These climatic elements should be used in the process of measuring the TCI. Also, it is necessary to modify the influence of low temperatures on the TCI values, because they contribute to a better utilization of natural conditions for the development of winter tourism. This opens up the possibility of TCI
diversification, i.e., the use of different input data for summer and winter tourism centers. The spatial expansion of tourist movements, the development of tourism in new and formerly underdeveloped areas, the emergence of new types of tourism, as well as climate changes, further encourage the need for diversification of input data in the TCI calculation process.
One of the further lines of research in this scientific field could include the whole territory of Serbia. Regionalization of Serbia according to TCI would be of great importance in the planning and development of tourism regions. By analyzing the correlation between the TCI values and the number of tourists on a monthly basis in certain tourism centers, we become aware of an insufficient utilization of natural potentials for tourism development in certain parts of the year. This type of analysis can influence decisions on the possible extension of the tourism season in tourism centers specialized for only one type of tourism (i.e.
Kopaonik and ski tourism).
Climate conditions for the development of tourism are significantly more favorable in Niš, Kuršumlija’s spas, and Vranje, than in tourism centers located at higher altitudes. In these centers, favorable bioclimatic conditions in the form of high temperatures during the summer months, high insolation (especially in the summer months), and absence of strong winds year-round are particularly important for tourism. This index does not take into account the key climatic parameters for the development of ski and mountain tourism (negative temperatures in the winter season, snow depth and snow cover duration, absence of strong winds, or occurrence of blizzards). Therefore, there is a discrepancy between the TCI value and the number of tourists in the Kopaonik mountain tourism center. Because of these shortcomings, there is a real and practical need for future research with the aim of eliminating them. It is necessary to improve TCI, or to make a modified version that would have a larger and more functional application in determining the favorable climatic conditions for the winter tourism.
The development of tourism in continental conditions has had a positive influence on the development of spa tourism in South Serbia in the last years.
However, due to the traditional understanding of the concept of spas as rehabilitation centers in Serbia, their tourism function is of secondary importance.
In all the selected spa centers, climate conditions are favorable for the development of tourism, especially during the summer season. Climatic characteristics provide an opportunity for the development of different and complementary aspects of tourism. However, tourism centers in South Serbia lack supplementary tourist contents, which would make better use of their tourism resources (Valjarević et al., 2017). The tourism development of Kopaonik should move towards the affirmation of tourism centers on the mountain sides at lower altitudes (in particular from the eastern side), as well as the promotion of alternative forms of tourism in the offseason period, especially bearing in mind the favorable climatic conditions present in this period. The Niš tourism region is
not sufficiently exploited, taking into account the abundance of tourism resources and its favorable transport location.
“According to the size of Serbian territory, further studies might involve a considerably larger and wider area taking into consideration the actual scenarios of climate changes with respect to regional variations. The results of climate indices and their marketing contribute to choosing the most appropriate destinations for a certain type of climate treatment or recreation” (Anđelković et al., 2016). The tourist centers of South Serbia are not sufficiently represented on the international tourism market (Vesić and Živanović, 2018). Due to the insufficient development of tourism in South Serbia, TCI as an indicator has greater significance. The values of this indicator can be used when planning future tourism development, a better utilization of accommodation facilities and the development of complementary types of tourism that are dependent on climatic conditions.
Acknowledgements: The paper is the result of research within project no. 176008 funded by the Ministry of Education, Science and Technological Development of the Republic of Serbia.
References
Agarin, T., Jetzkowitz, J., and Matzarakis, A., 2010: Chapter 15 Climate change and tourism in the eastern Baltic Sea region. In (ed. Christian S.) Tourism and the Implications of Climate Change:
Issues and Actions (Bridging Tourism Theory and Practice, Volume 3. Emerald Group Publishing Limited, 261–281. https://doi.org/10.1108/S2042-1443(2010)0000003018
Amelung, B., Nicholls, S., and Viner, D., 2007: Implications of Global Climate Change for Tourism Flows and Seasonality. J. Travel Res. 45, 285–296. https://doi.org/10.1177/0047287506295937 Amelung, B. and Viner, D., 2006: Mediterranean tourism: exploring the future with the Tourism Climatic
Index. J. Sustain. Tourism 14, 349–366. https://doi.org/10.2167/jost549.0
Anđelković, G., Pavlović, S., Đurđić, S., Belij, M., and Stojković, S., 2016: Tourism Climate Comfort Index (TCCI) – An attempt to evaluate he climate comfort for tourism purposes: the example of Serbia. Global NEST Journal 18, 482–493. https://doi.org/10.30955/gnj.001798
Basarin, B., Kržić, A., Lazić, L., Lukić, T., Đorđević, J., Janićijević Petrović, B., Ćopić S., Matić, D., Hrnjak, I., and Matzarakis, A. 2014: Evaluation of bioclimate conditions in two special nature reserves in Vojvodina (Northern Serbia). Carpathian Journal of Earth and Environmental Sciences 9(4), 93–108.
Becker, S., 1998: Beach Comfort Index – A New Approach to Evaluate the Thermal Conditions of Beach Holiday Resorts Using a South African Example. GeoJournal 44, 297–307.
https://doi.org/10.1023/A:1006871805262
Bedford, T., 1948: Basic Principles of Ventilation and Heating. Lewis Co, London
Belén Gómez M., 2004: An Evaluation of Tourist Potential of the Climate in Catalonia (Spain): A Regional Study. Geografiska Annaler. Series A Physical Geography 86, 249–264.
https://doi.org/10.1111/j.0435-3676.2004.00229.x
Belén Gómez M., 2005: Weather, Climate and Tourism: A Geographical Perspective. Ann. Tourism Res.
32, 571–591. https://doi.org/10.1016/j.annals.2004.08.004
Besancenot, J.P., Mouiner, J., and De Lavenne, F., 1978: Les conditions climatiques du tourisme littoral:
un methode de recherche comprehensive. Norois 99, 357–382.
https://doi.org/10.3406/noroi.1978.3717
Bojović, G., 2012: Kopaonik and its spas. Serbian Geographical Society, Belgrade
de Freitas C.R., 1990: Recreation Climate Assessment. International J. Climatol. 10, 89–103.
https://doi.org/10.1002/joc.3370100110
Elsasser, H. and Bürki, R., 2002: Climate change as a threat to tourism in the Alps. Climate Res. 20, 253–257. https://doi.org/10.3354/cr020253
Fanger, P.O., 1970: Thermal Comfort: Analysis and Applications in Environmental Engineering.
Copenhagen: Danish Technical Press.
Fitchett, J. and Hoogendoorn, G., 2018: An analysis of factors affecting tourists’ accounts of weather in South Africa. Int. J. Biometeorol. 62, 2161–2172. https://doi.org/10.1007/s00484-018-1617-0 Gao Y., Gao, X., and Zhang, X., 2017: The 2 °C Global Temperature Target and the Evolution of the
Long-Term Goal of Addressing Climate Change—From the United Nations Framework Convention on Climate Change to the Paris Agreement. Engineering 3, 272–278.
https://doi.org/10.1016/J.ENG.2017.01.022
Gavrilov, M., Marković, S., Janc, N., Nikolić, M., Valjarević, A., Komac, B., Zorn, M., Punišić, M. and Bačević, N., 2018: Assessing average annual air temperature trends using the Mann-Kendall test in Kosovo. Acta Geographica Slovenica 58, 7–25. https://doi.org/10.3986/AGS.1309
Houghten, F.C. and Yaglou, C.P., 1923: Determining equal comfort lines. J. Amer. Soc. Heating Ventilating Engin. 29, 165–176.
IPCC, 2014: Climate Change 2014: Synthesis Report. Contribution of Working Groups I, II and III to the Fifth Assessment Report of the Intergovernmental Panel on Climate Change [Core Writing Team, R.K. Pachauri and L.A., Meyer (eds.)]. IPCC Geneva Switzerland.
Jahić, H. and Mezetović, A., 2014: Qualitative Valorisation of Climate Tourism Potential by Application of the Tourism Climate Index - TCI on the example of Herzegovina-Neretva Canton/County. Acta geographica Bosniae et Herzegovinae 2, 91–106.
Joksimović, M., Gajić, M., and Golić, R., 2013: Tourism climatic index in the valorisation of climate in tourist centers of Montenegro. Bull. Serbian Geograph. Soc. 93, 15–34.
https://doi.org/10.2298/GSGD1301015J
Kovacs, A., Nemeth, A., Unger J. and Kantor, N., 2017: Tourism climatic conditions of Hungary – present situation and assessment of future changes. Időjárás 121, 79–99.
Matzarakis, A., 2006: Weather and Climate – Related Information for Tourism. Tourism and Hospitality Planning & Development 3, 99–115. https://doi.org/10.1080/14790530600938279
Matzarakis, A., 2009: Additional Features of the RayMan Model. In: The 7th International Conference on Urban Climate (P2-32: 1-4). International Association for Urban Climate, Yokohama.
Matzarakis, A., Andrade, H., and Alcoforado, M.J., 2008: Thermal Bioclimatic Maps for Portugal. In:
(eds Alcoforado, M.J., Andrade, H., Lopes, A. and Oliviera, S.): Estudos sobre Cidades e Alterações Climáticas. Centro de Estudos Geográficos da Universidade de Lisboa, Área de Investigação em Geo-Ecologia, Lisboa. 37–45.
Meteorological yearbook, 2017: Meteorologícal yearbook 1 – Climate data. Belgrade (1990–2016) Republic Hydrometeorological Service of Serbia.
Mieczkowski, Z., 1985: The Tourism Climatic Index: A Method of Evaluating World Climates for Tourism. The Canadian Geographer/Le Géographe canadien 29, 220–233.
https://doi.org/10.1111/j.1541-0064.1985.tb00365.x
Milovanović, B., Ducić, V., Radovanović, M. and Milivojević, M., 2017: Climate regionalisation of Serbia according to Köppen climate classification. Journal of the Geographical institute „Jovan Cvijić“ SASA 67, 103–114. https://doi.org/10.2298/IJGI1702103M
Perch-Nielsen, S., Amelung, B., and Knutti, R., 2010: Future climate resources for tourism in Europe based on the daily Tourism Climatic Index. Climatic change 103, 363–381.
https://doi.org/10.1007/s10584-009-9772-2
Roshan. G-, Yousefi, R. and Błażejczyk, K., 2018: Assestment of the climatic potential for tourism in Iran through biometeorology clustering. Int. J. Biometeorol. 62, 525–542.
https://doi.org/10.1007/s00484-017-1462-6
Roshan, G., Yousefi, R. and Fitchett, M.J., 2016: Long-term trends in tourism climate index scores for 40 stations across Iran: the role of climate change and influence on tourism sustainability. Int. J.
Biometeorol. 60, 33–52. https://doi.org/10.1007/s00484-015-1003-0
Sabzevari, A.A., Miri, M., Raziei, T., Oroji, H., and Rahimi, M., 2018: Evaluating the climate capabilities of the coastal areas of southeastern Iran for tourism: a case study on port of Chabahar. Int. J.
Biometeorol. 62, 1135–1145. https://doi.org/10.1007/s00484-018-1516-4
Scott, D. and Mcboyle, G., 2001: Using a ‘tourism climate index’ to examine the implications of climate change for climate as a tourism resource. In (eds. Matzarakis A. and Freitas, de C.): Proceedings of the First International Workshopon Climate, Tourism and Recreation, International Society of Biometeorology, Greece. 69–86
Smith, K., 1993: The Influence of Weather and Climate on Recreation and Tourism. Weather 48, 398–
403. https://doi.org/10.1002/j.1477-8696.1993.tb05828.x
Statistical Office of the Republic of Serbia, 2017:. Catering and tourism statistics – Tourist turnover in the Republic of Serbia. Belgrade (2007–2016).
Tzu-Ping, L. and Matzarakis, A., 2008: Tourism climate and thermal comfort in Sun Moon Lake, Taiwan. Int. J. Biometeorol. 52, 281–290. https://doi.org/10.1007/s00484-007-0122-7
Valjarević, A., Vukoičić, D. and Valjarević, D., 2017: Evaluation of the tourist potential and natural attractivity of the Lukovska Spa. Tourism Manage. Perspectives 22, 7–16.
https://doi.org/10.1016/j.tmp.2016.12.004
Vesić, M. and Živanović, V., 2018: The current state and strategies for development of tourism in the Area of exceptional features „Vlasina“. 3rd International Thematic Monograph: „Modern Management Tools and Economy of Tourism Sector in Present Era“, pp. 449-461, Association of Economists and Managers of the Balkans in cooperation with the Faculty of Tourism and Hospitality, Belgrade. https://doi.org/10.31410/tmt.2018.449
Vukoičić, D., Milosavljević, S., Penjišević, I., Bačević, N., Nikolić, M., Ivković, R. and Jandžiković B., 2018: Spatial analysis of air temperature and its impact on the sustainable development of mountain tourism in Central and Western Serbia. Időjárás 122, 259–283.
https://doi.org/10.28974/idojaras.2018.3.3
Weir, B., 2017: Climate change and tourism – Are we forgetting lessons from the past?. J. Hospital.
Tourism Manage. 32, 108–114. https://doi.org/10.1016/j.jhtm.2017.05.002
Yan, F., Yin, J. and Wu, B., 2018: Climate change and tourism: a scientometric analysis using CiteSpace.
J. Sustain. Tourism 26, 108–126. https://doi.org/10.1080/09669582.2017.1329310