DOI:10.28974/idojaras.2018.1.5
IDŐJÁRÁS
Quarterly Journal of the Hungarian Meteorological Service Vol. 122, No. 1, January – March, 2018, pp. 59–79
Application of European numerical weather prediction models for hydrological purposes
István Ihász1*, Amarilla Mátrai2, Balázs Szintai1, Mihály Szűcs1, and Imre Bonta1
1Hungarian Meteorological Service, P.O. Box 38, H-1525 Budapest, Hungary
2General Directorate of Water Managementy P. O. Box 32, H-1518 Budapest, Hungary
E-mail: matrai.amarilla@ovf.hu
*Corresponding author E-mail: ihasz.i@met.hu (Manuscript received in final form August 22, 2017)
Abstract―Nowadays, hydrological forecasts are based on wide range of meteorological inputs, including observations and forecasts. In this paper four main areas are covered.
First of all, milestones covering last four decades from usage of a simple statistical method to regional limited area modeling are summarized. Then an overview of the main activities of the European Flood Awareness System (EFAS) is given. Usage of ensemble forecasts for providing uncertainty is getting larger and larger attention for hydrological applications too. Benefits of a locally developed new tool, the ensemble calibration method based on reforecast model climate is given in the third part. Finally, local developments on regional hydrostatic and non-hydrostatic models are shown. It is shown that a high resolution limited area non-hydrostatic model can predict summer heavy precipitation more accurately.
Key-words: ensemble forecasts, case studies, flood, EFAS, precipitation, probability, calibration, numerical weather prediction models, ECMWF, ALADIN, AROME
1. Introduction
Necessity of the study of meteorological and hydrological circumstances of floods on two main rivers (Danube and Tisza) got a special emphasize after a severe flood event on Tisza, which caused extreme damages in spring 1970 (Bonta and Újváry, 2011). In the middle of the 1970s, several projects were
realized to study the weather scenarios causing heavy floods (Bodolainé, 1976).
As model forecasts from large European meteorological services were available only in the beginning of the 1980s, a statistical method was constructed to estimate the precipitation amount. The Precipitation Synoptic Division was established headed by Bodolainé, forecasts were made daily for 20 water basins of rivers Danube and Tisza. It was a pioneering activity (both in Hungary and Europe in general) in studying the relation between weather conditions causing heavy floods (Bodolainé, 1983). A comprehensive study was made on the heavy floods of the ‘80s and ‘90s by Szépszó (2003).
Since the 1970s, global models have been operationally running at the largest meteorological services, and relatively few countries were able to run regional models providing downscaled weather forecasts. In the ’80s, due to rapid development of limited area regional models, significant benefits could be provided, especially in surface weather parameters, like precipitation, 10m wind, and 2m temperature compared to global forecasts. Consequently, the Hungarian Meteorological Service (OMSZ) considered to implement a state-of-the-art model in the second part of the 1980s. Three main conditions had to be available to fulfil this plan. First of all, a powerful computer had to be installed, a BASF 7/61 type computer was purchased in 1986. The Swedish grid point limited area model was one of the best in his field, it was bought by OMSZ in 1988. A small new team focusing on this activity was headed by Dezső Dévényi. After having solved several problems in July 1991, the adapted model having 0.9*0.9 degrees horizontal resolution and 12 levels in the vertical became operational covering Europe (Ihász, 1992, 2014). After having signed a cooperation agreement between the European Centre for Medium-Range Weather Forecasts (ECMWF) and Hungary in the spring of 1995, lateral boundary conditions had been operationally used for the model, and this development provided improved precipitation forecast for the rest of the model life, until 1998.
In 1991, Météo France invited several central European countries to take part in developments for creating the ALADIN hydrostatic spectral limited area model from the global ARPEGE model (Horányi et al., 1996). This model became operational in May 1994 in Toulouse, and it started to provide precipitation forecasts via Météo-France’s satellite broadcasting system for meteorological data & product (RETIM).
After installing a new high performance computing facility, the ALADIN/HU model became operational at OMSZ in 1998 (Horányi et al., 2006). The model was coupled to the global ARPEGE model in the first 10 years of operational usage, and after several pioneering activities, the model was coupled to the ECMWF deterministic global model, providing significant improvement in quality of the forecasts (Bölöni et al., 2009). In the first decade
in 2010 (Horányi et al., 2011). This non-hydrostatic model could provide very useful information, especially in summer extreme precipitation events.
After signing a cooperation agreement between Hungary and ECMWF in July 1994, deterministic and ensemble forecasts became available for forecasters in January 1995. In the last two decades, a lot of local developments were done for providing support in decision making of the forecasters.
There were many pioneering activities in use of ensemble forecasts at OMSZ. Since 2003 ensemble clustering focusing on Central European meteorological patterns has been operationally done (Ihász, 2004). Ensemble representative member and ensemble mean for each clusters are available for the General Directorate of Water Managements, too. Quality of the ensemble forecasts could be significantly improved by ensemble calibration for weather elements, as 2m temperature, 10m wind speed, and precipitation (Ihász et al., 2010; Mátrai, 2015; Mátrai and Ihász, 2017). Since 2011 ensemble vertical profile as newly developed product could support to make decision on both precipitation type in winter and intensity of convective events in summer (Ihász and Tajti, 2011). Usage of ensemble forecasts for prediction of the upper level lows causing heavy precipitation is especially useful (Gaál and Ihász, 2015).
Benefits of the complex usage of the ensemble forecasts were proved in heavy convective events (Lázár and Ihász, 2016).
2. The European Flood Awareness System (EFAS)
In 2002, a devastating flood went down on Elba and Danube rivers, causing large damages. In response to this event, the EFAS was created within a co- financing framework at the European Commission Joint Research Centre, in close cooperation with the European national hydrological and meteorological services, the ECMWF, and the Monitoring and Information Centre (MIC). The aim of EFAS is to increase defence capabilities against natural disasters and floods. In recent years, EFAS transformed to an advanced flood forecasting system, with number of state-of-the-art products, like probability flood forecasting. The EFAS system has been working operationally since 2012.
The EFAS basically ordered the hydrological events to the quantitative indicators of the meteorological events in the past.
The hydrological model (LISHFLOOD) of EFAS provides early flood warning twice a day with 6-hour and daily intervals. The EFAS results are based on multiple weather forecasts with different spatial and temporal resolutions.
The meteorological data originate from different weather services, high resolution (deterministic) and ensemble forecasts, and provide short and medium range products (European Centre for Medium Range Weather Forecasts – ECMWF, Deutscher Wetterdienst – DWD, and Consortium for Small-scale Modeling – COSMO).
From Hungary, the only EFAS partner is the General Directorate of Water Management. However, EFAS partner could be any national or regional or local authority, which provides flood forecast services or has a role in flood risk management in their own country.
Different maps and graphic products were made based on the incoming data from the EFAS members. These EFAS products are available on the official website: www.efas.eu. For example, we can find information about the national flood monitoring gauges and management of these. Several meteorological and hydrological layers can be reached for the European region.
If the risk of flood or flash flood is high on the catchment of the member country, then EFAS send flood or flash flood notifications to the members. The disclosure of the information is based on exceeding a critical threshold, not on quantity water discharge forecast. The notification includes the river name, catchment, date of the forecast, date of predicted start of the event, date of earliest predicted peak, and the probability of the return period magnitude.
For more detailed information about the structure, operation, and products of the EFAS, refer to the official ECMWF Technical Memorandum (Smith et al., 2016).
3. Ensemble calibration
With the unification of the ECMWF medium-range ensemble prediction system (ENS) and monthly forecasting system (MFS) on March 11, 2008 (Hagedorn, 2008), a new reforecast dataset has become available for a variety of applications. A reforecast dataset is a collection of forecasts with start and prediction dates from the past, usually going back for a considerable number of years. In order to ensure consistency between reforecasts and actual forecasts, reforecasts are produced specifically with the same model system that is used to produce the actual forecasts. Before the unification of the medium-range and monthly forecast systems, reforecasts were only produced – and thus applicable – for the monthly forecast system. However, through the unification of both systems, it is now possible to use the reforecasts produced with the unified system for both the ensemble and monthly forecasts.
Originally, the reforecasts of the monthly forecast system were mainly used to determine the model climate and forecast anomalies with respect to this model climate. Now, with the reforecasts also being applicable to the medium- range ensemble forecasts, new applications are possible. One of these new applications is the calibration of the medium-range ENS forecasts. Testing various calibration methods has shown that the forecasts can be significantly improved through calibration, in particular for near-surface weather parameters
Nowadays, 11 reforecast ensemble members for 45 days ahead are operationally generated for the last 20 years every Monday and Tuesday. In our period of investigation (2008–2013), reforecasts were available for 5 members once a week (on Thursdays).
3.1. Comparison of reforecast and observation climates
Ensemble calibration can provide valuable improvement if there is a significant difference between the distribution of modeled and observed climates.
Significance was investigated with two sample Kolmogorov-Smirnov tests.
Stable model climate can be produced by using reforecasts from 5 consecutive weeks centered on the current date. Model climate was generated for each week and every year in this selected period (2008–2013).
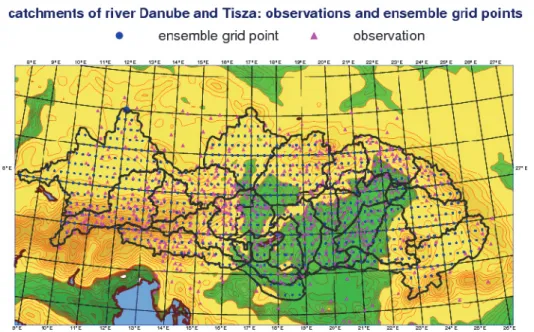
The influence of model developments can easily be studied by comparison of ensemble reforecast climates, too. The horizontal resolution was 50 km between 2006 and 2010 and 32 km between 2011 and 2015. The vertical resolution covered 62 levels between 2006 and 2013 and it has been 91 since 2013. Comparative study was made between the observed climates and the consecutive model climates for 20 individual catchments of Danube and Tisza rivers (Fig. 1). Common characteristics were tried to find for the following three catchment types: flat, mountainous, and mixed areas. It was supposed that the influence of the model evolution can be seen on the model climates too.
Fig. 1. 21 catchments of rivers Danube and Tisza (border of catchments (black), ensemble grid points (blue), and observations (magenta)).
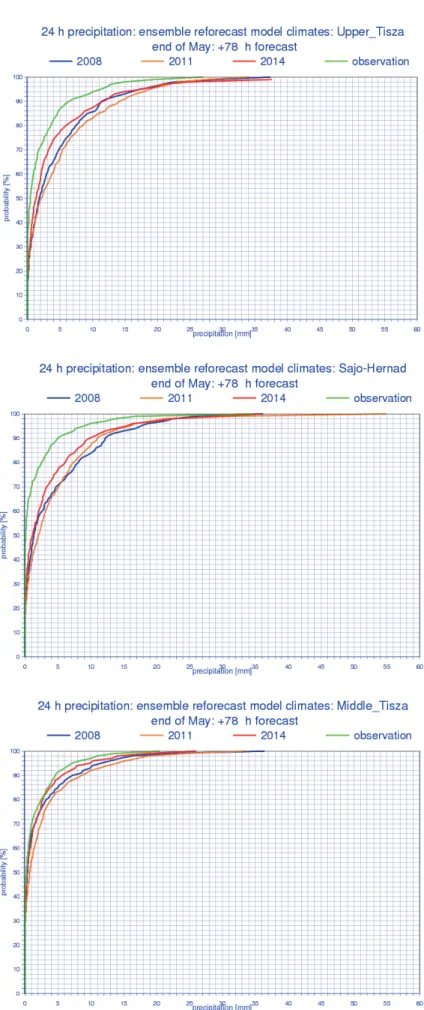
In the mountainous type differences between model climates for the same catchments were generally larger than in the flat or mixed types. These features are demonstrated for the Upper-Tisza catchment in Fig. 2. The Kolmogorov- Smirnov test also proved this statement.
As a summary of this investigation, a common conclusion can be made for all catchments as:
− There are usually quite large differences among the model climates for the same catchment.
− Model climates of 2011 and 2008 are closer to each other than in case of 2014 and 2011.
− Due to smaller differences between modeled and observed climates for small or moderate precipitation amounts in flat regions, the calibration is generally not a necessity. It is especially true for the 2014 model climate.
− In case of large or extreme precipitation, the differences are remarkable, so calibration is beneficial.
− The minimum difference between the model climate and the observed climate occurred in 2014.
Seasonal and annual similarities and differences were also examined.
Similar investigation was applied for observed and modeled climates for 2014 to see the weaknesses and strengths of the model and to support the best decision making in flood situations. It can be concluded that larger differences usually appear in summer due to more intensive convection. In any seasons, developments of the model can be seen in the distributions of the model climates, too. The largest positive changes between model climates (2008 and 2014) were found in summer, and it underlines the positive impact of model developments on convective precipitation forecasts. Even the largest differences between the modeled and observed climates for 2014 appeared in spring and summer, so some further improvements on the model are still needed. There was no common typical characteristic for three predefined catchment types (flat, mountainous, and mixture), which statement supports the necessity of calibration separately for each catchment.
As a conclusion, it can be noted that even if there is continuous development on the ensemble system resulting in more precise precipitation forecast, calibration is needed for all catchments and all seasons.
Fig. 2. Comparison of reforecast climates (2008, 2011, 2014) and observed climate for the mountainous (Upper-Tisza), mixed (Sajó-Hernád), and flat (Middle-Tisza) catchments
3.2. Calibration method
Calibration is a statistical adjustment of the forecast. To make calibration, following data were needed (on spatial mean of a catchment):
− reforecast climate: model climate distribution function made from the reforecasts,
− observed climate: distribution function of observed data, and
− ensemble forecast: distribution function of the current ENS forecast.
During the calibration, the adjustment of ensemble forecast was made by the difference of the observed climate and reforecast climate. More difference between the climates made more correction on the calibrated ensemble forecast. If the observed climate and reforecast climate were close together, then less correction in the calibration was applied (Mátrai and Ihász, 2017).
To understand our calibration method itself, the procedure is illustrated in Fig. 3. Suppose that one of our ensemble members predicts a precipitation amount of 6 mm. First, we have to find the frequency in the model climate that belongs to the value of 6 mm. Then, this frequency (87%) must be projected onto the observed climate. And finally, we get a value belonging to this frequency which is the new value of our ensemble member (8.5 mm). As a matter of fact, we assume that the distribution of observed values describes weather conditions more accurately in a given place than the distribution of values forecasted by a numerical model. Thus, instead of a simple shifting of the curve of distribution functions, like in case of bias correction, we look for the frequency of each ensemble value both in the modeled and observed climates.
Importantly, all of the distribution functions should be made for the same time period. If the studied period is too short, it may occur that the period does not include an extreme event. The result of the calibration method is an adjusted distribution function, which can be easily compared with the raw one and can help the forecasters to decide, whether to correct the precipitation forecast or not.
Fig. 3. Example of the calibration method.
3.3. Extreme flood on the Danube, May-June 2013
In late May and early June, a heavy flood event caused extreme damages in upper Danube due to intensive cyclone activity, which existed a few days around the Alps. In Hungary, the water level exceeded the former records registered in 2002, along the whole river, until the Hungarian-Serbian border.
This extreme flood was caused by extreme precipitation fallen in 4 days in the three upper catchments of Danube. The largest amount of daily precipitation was recorded on June 2, 2013: Upper Danube - 35 mm/24h, Inn – 48 mm/24h, Traun-Enns – 53 mm/24h.
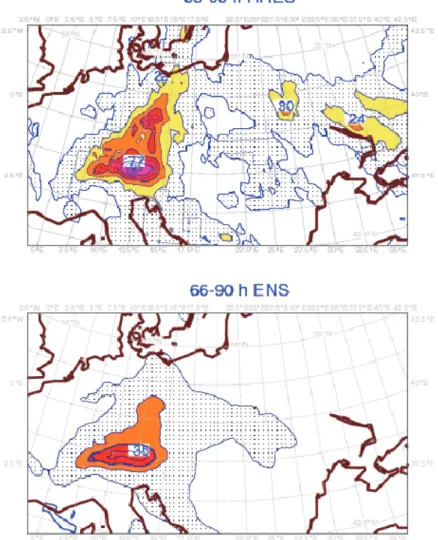
Fig. 4 shows the forecasts of high resolution (HRES) and ensemble (ENS) models mean. It can be seen that the area of intensive precipitation was well- defined, however, the HRES model overpredicted, the ENS mean underpredicted the daily precipitation amount by 10–20 mm during the whole period. It is important to note that the position and intensity of the extreme event were predicted by both models several days ahead.
Fig. 5 shows the plume diagram based on the May 29, 2013, 12 UTC model runs. Both high resolution and ensemble models predicted the large amount of the precipitation, while the ensemble system had a quite large spread.
Fig. 4. Precipitation forecasts starting at 12 UTC on May 30, 2013 showing (a) the HRES 24-hour precipitation forecast 66 to 90 hours ahead and (b) the ENS mean 24-hour precipitation forecast 66 to 90 hours ahead.
It can be seen that the ensemble forecasts were still not accurate enough, so the calibration method was expedient to use. The next few figures show the result of the calibration for the upper Danube catchments.
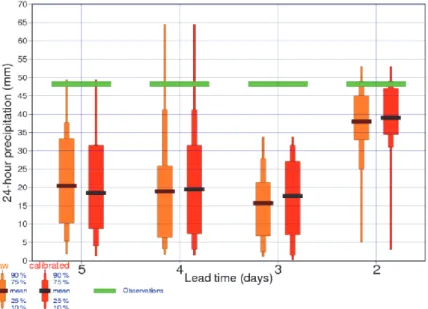
Fig. 6 presents the impact of calibration on the precipitation probability for two catchments in the Alpine region, based on the May 28, 2013, 00 UTC model run and the 30–54h forecasts. In both forecasts, the observed climate and the reforecast climate remain close together, bigger differences occurred between 8- 16 mm and in case of only few mm precipitations. Hence, the calibration method will make the biggest adjustment in these ranges (Fig. 7).
Fig. 6. Calibrated and uncalibrated distributions of precipitation probability for the Inn
Fig. 7. Calibrated and uncalibrated 24-hour precipitation forecasts valid for 06 UTC, June 1, 2013 – 06 UTC, June 2, 2013 for the Inn catchment area, initialised on four consecutive days starting from 06 UTC May 27. The horizontal green line shows the observed value.
This study shows that the calibration can improve the accuracy of the forecast, however, one must take into account the differences from the topography. The results of the calibration might be giving more information to the forecasters, in such a way that the relationship of observed and reforecast climates can give information about distribution of the precipitation during the past few years on catchments. Comparing the raw and the calibrated forecasts, the experts can decide wh ether to modify the forecasted precipitation amount.
3.4. Verification
The comparative verification test was made from the uncalibrated and calibrated ensemble forecasts based on about 100 extreme precipitation cases in the 2008–
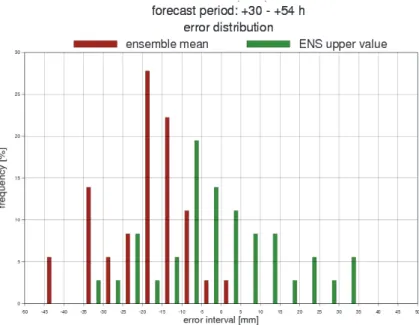
2013 intervals. Fig. 8 shows the error distribution of the uncalibrated ensemble forecasts compared to observations for the extreme precipitation. The brown color represents the mean of the ensemble forecast and green color is the upper limit of the sorted ensemble forecast. In case of extreme rainfall, the ensemble mean underestimated the quantity of precipitation. In this case the systematic error cannot be seen, but the under- and overestimation occur approximately in the same proportion.
Fig. 8. Error distribution of the uncalibrated ensemble forecasts for the extreme precipitations in the 2008–2013 interval.
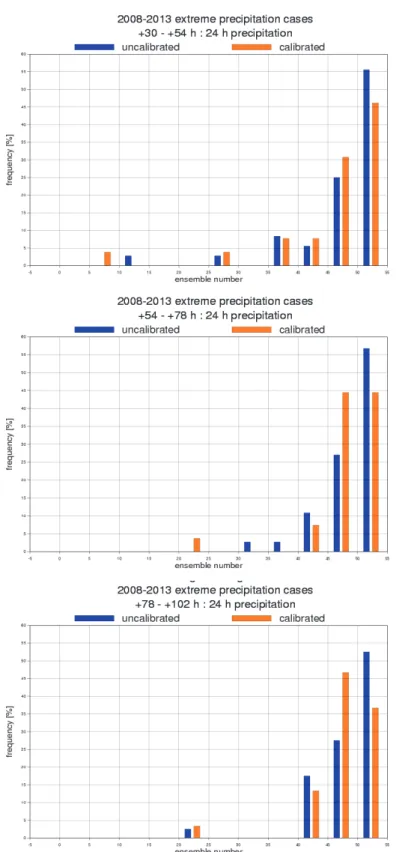
For the verification of ENS forecasts, the Talagrand diagram is widely used (Persson, 2011). The number of outlier cases decreased, but wider ensemble spreads were given by the model, thus increasing the standard deviation of the
Fig. 9 shows the uncalibrated and calibrated frequencies of the outliers in ensemble forecasts of 24h precipitation for different forecast ranges. In both forecasts the outliers presented the underestimation. However, it can be seen that the frequency of outliers decreased with the calibration. The forecast of extreme precipitation was improved by the calibration method.
Fig. 9. Talagrand diagrams for 24-hour precipitation amount for different forecast ranges.
4. Application of limited area numerical prediction models
For several local hydrological applications, meteorological fields of higher temporal and spatial resolution are needed than what is provided by global numerical weather prediction models. In these cases, limited area NWP models (LAMs) might be used, which could have the following advantages:
• The have higher temporal and spatial resolution;
• More – especially remote sensing – observations could be used for the generation of initial conditions;
• Local climatological characteristics could be taken into account during model development;
• Close interaction between local users of NWP outputs and model developers could be realized.
In this section, these possible advantages of limited area models are reviewed through the example of the ALADIN/AROME modeling system applied at the Hungarian Meteorological Service (OMSZ). Hungary, together with several other European countries, has been participating in the ALADIN (Aire Limitée Adaptation Dynamique Développement International) consortium since 1991. The ALADIN consortium was initiated by Météo France and currently has 16 participating countries. The aim of this consortium is to develop a short-range limited area numerical weather prediction model. As a result of this collaboration, the ALADIN/AROME model family has emerged, and it is constantly being developed in the participating countries. As of the beginning of 2017, the ALADIN/AROME operational suite at OMSZ consists of three models: the hydrostatic ALADIN model (with ALARO physics) runs at 8 km horizontal resolution, the non-hydrostatic AROME model (Szintai et al., 2015) runs at 2.5 km horizontal resolution, and the probabilistic ALADIN-EPS system operates at 8 km horizontal resolution with 11 members (Szűcs et al., 2016).
For non-hydrostatic NWP models running at a horizontal resolution of 2–3 km, deep convection is supposed to be resolved explicitly, thus no deep convection parameterization is required (Seity et al., 2011). In principle, this enables a more accurate prediction of convective events often accompanied by high precipitation amounts. Consequently, limited area models with high resolution could mean an added value from the point of hydrological applications. The advantage of high resolution NWP models as compared to global models could be observed in two precipitation characteristics. First, timing of deep convection is more accurate, secondly, high precipitation events
During the verification, precipitation forecasts of the high resolution (HRES) global model run at ECMWF are compared with the AROME model.
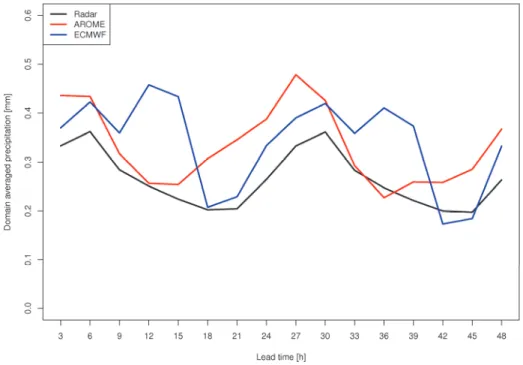
Both of these models are used operationally at OMSZ. The time period of the comparison is the summer of 2016 (June, July, and August). In this period, the HRES model was run at approximately 9 km horizontal resolution, while the AROME model was run at 2.5 km resolution. Fig. 10 depicts three hourly accumulated area averaged precipitation over Hungary as a function of forecast lead time. For the verification, always the 00 UTC runs of the models were used and forecasts were compared to radar precipitation measurements. Based on the radar measurements, the summer precipitation has a pronounced daily cycle, with a maximum measured during the night. The global HRES model follows this daily cycle, however, the minimum predicted for the afternoon hours is too short and the maximum during the night is too long. The AROME model simulates a more realistic daily precipitation cycle with accurate timing and length of precipitation maximum. It has to be noted that the three-month period (June-July-August of 2016) serving as the basis for verification was somewhat extraordinary, with July 2016 giving the second highest precipitation amounts since 1901. The three-month averaged scores are very much affected by three high precipitation days in July, which are all influenced by large scale forcing (convection generated by cold front passages). As all of these three cold fronts arrived during the night, the daily maximum depicted in Fig. 10 is shifted towards the early morning hours, contradicting the usual afternoon maximum of deep convective precipitation.
Fig. 10. Forecasts of three hourly accumulated precipitation averaged over Hungary as a function of lead time for summer 2016. Red: AROME model, blue: HRES model run at ECMWF, black: radar observation.
Averaged precipitation rates over a country are important to drive hydrological applications on a large scale (e.g., calculate discharge rates of main rivers), however, for local applications (e.g., flash flood warnings), it is crucial to accurately forecast the location and intensity of high precipitation events. The symmetric extremal dependence index (SEDI) was developed in order to have a reliable score which has good statistical properties even for rare events (Ferro and Stephenson, 2011). To estimate the advantage of limited area NWP models in predicting severe precipitation phenomena, the SEDI score was calculated for the HRES and AROME models for the summer of 2016 using precipitation measurements from the surface observation network in Hungary (Fig. 11). It has to be noted that during the summer of 2016, more precipitation was observed than the long-year average, and several severe convective events took place, consequently this three month period is supposed to be enough to draw solid consequences about precipitation forecasts. Results show that low precipitation cases (below 10 mm/day) are better predicted by the HRES model. For days with moderate precipitation (10–30 mm/day), HRES and AROME have similar skills. High precipitation events (above 30 mm/day) are better predicted by AROME, which could be attributed to the higher resolution, the non-hydrostatic dynamics, and the advanced microphysical parameterization of this model. It is important to mention that the SEDI score is independent of the frequency bias of the models. For the HRES model, an underestimation is present for the number of high precipitation cases, while the AROME model tends to overestimate the frequency of these events (not shown).
Another advantage of limited area models could be the assimilation of local observations to improve the initial conditions of the simulation.
Nowadays, the most promising such observation type is the radar. From the radar, both the reflectivity and the Doppler wind measurements can be assimilated, with the former having significant impact on precipitation forecasts. Two approaches are available for the assimilation of radar data.
The first approach was the latent heat nudging technique (Jones and Macpherson, 1997), used operationally nowadays in the UKMO and COSMO limited area models. In the ALADIN/AROME model family, a radar assimilation technique based on the variational approach was developed (Caumont et al., 2010). At the Hungarian Meteorological Service, experiments with radar data assimilation started in 2010 (Mile et al., 2015), however, due to several technical problems and the lack of manpower, the development process was slow and the operational application is expected to be realized in 2018. Apart from the application of local observations, another benefit of limited area NWP models could be the increased frequency of model runs. Since the beginning of 2016, the AROME model is run eight times per day at OMSZ. The additional model runs could deliver a benefit for severe weather forecasters in rapidly changing convective conditions.
In the case of limited area models, local climatological characteristics could be taken into account during model development. One example for this is the fine tuning of physical parameterizations like cloud physics. For varying climatological regimes, the frequency of certain weather phenomena is different. For instance, winter low cloud events are more frequent in the Carpathian Basin than in Western Europe. Consequently, in a LAM applied only over Hungary, a different set of tuning parameters can be used than in a LAM applied over France, which could improve the low cloud forecasts (Szintai et al., 2015). Although cloud cover is not used directly by hydrological models, it could have a significant impact on soil moisture or snow cover which are important for these applications.
At national meteorological services, a closer interaction could be realized between model users (forecasters, external partners) and model developers, which might not be the case for global model centers.
Consequently, special applications could be developed based on LAM models, which satisfy users’ needs. One such application which was recently developed at the Hungarian Meteorological Service for a major energy provider company is the probabilistic forecast of freezing rain from the ALADIN-EPS system. Apart from this, specialized forecasts for aviation from limited area models are also being implemented in near future.
Within 3–5 years, OMSZ is planning to introduce several developments regarding its ALADIN/AROME limited area NWP suite, which could improve the service related to possible hydrological applications as well. The assimilation cycle of AROME is planned to be increased to an hourly rapid
update cycle (RUC), which would increase the number of observations used and would also enable an hourly integration of AROME. With the increase of computer resources, the horizontal resolution of AROME is planned to be increased to 1 km. The hourly updated model runs at this higher resolution could serve as a basis of an objective flash flood warning system. As the accurate forecast of local convection is challenging even at 1 km horizontal resolution, a non-hydrostatic ensemble prediction system based on the AROME model is also planned to be implemented in the future.
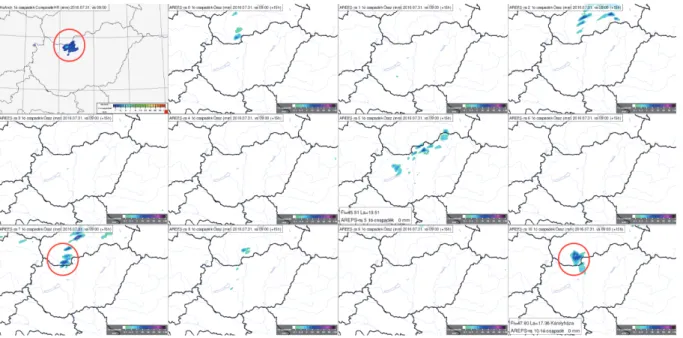
Some of the larger national meteorological services have already implemented the so-called convection-permitting ensemble systems, which are usually based on non-hydrostatic 2–3 km resolution numerical models (Gebhardt et al., 2008; Migliorini et al., 2011; Vié et al., 2011; Nuissier et al., 2016). OMSZ, as an ALADIN consortia member has close collaboration with Meteo France on field of ensemble prediction, and participates together in an ECMWF special project which aim is to test AROME-EPS. This project enabled OMSZ to lunch case studies which can be interesting from hydrological point of view, as well. One of these case-studies represents flash-flood events which occurred on July 31, 2016 and had quite low predictability. In a prefrontal situation, some small-scale storm developed and moved very slowly to northeastern direction. Their slow motion and precipitation made it possible that in given locations, cells were able to restructure again causing big amount of point-wise precipitation. These cells typically occurred along the northern part of the Danube River, near the Hungarian-Slovakian boarder, between 8 and 14 UTC. Usually, such small- scale phenomena cannot be described by hydrostatic models. Non-hydrostatic ones are able to evolve them, but sometimes only with relatively big spatial and temporal uncertainty, which can be misleading for forecasters and end- users. That is essential motivation for taking an ensemble of AROME model integrations in such situations. Fig. 12 is the highlight of hourly precipitation information from the 11 members of the AROME-EPS. Approximately half of the members predicted the evolution of small-scale storms over the region of interest, and two of them was quite accurate in their localization. For an early-warning system, it is very important to summarize information from all these members and identify the areas where hazardous meteorological events can occur with higher probability.
Fig. 12. Hourly accumulated precipitation over Hungary at 09 UTC, July 31, 2016. Top left panel shows the radar observation based amount, while other maps belong to the 11 members of an AROME-EPS started at 18 UTC, July 30, 2016. The interesting precipitation pattern is marked with red circle on the radar map and also for the members which were the most successful in the localization.
5. Conclusion
Using ensemble forecasts provides contribution to estimate the risk of the high impact meteorological events in hydrological applications. Possibility of reforecast based ensemble calibration was born in 2008. Even if significant developments had been achieved in operational forecasts based on the work done at the ECMWF, locally applied ensemble calibration can improve the quality of the forecasts in extreme situations, too. Any former studies focusing on the influence on forecasting extremes are not known. Benefits of the local developments on regional hydrostatic and non-hydrostatic models were shown, as well. It can be seen that high resolution limited area non-hydrostatic models can predict heavy precipitation during summer more accurately. The importance of the ensemble method was underlined in case of small-scale phenomena with low-predictability and accompanied by heavy precipitation event. Global and regional numerical weather prediction models will be continuously developing in the future. As a result of the ECMWF’s 2016–2025 Strategy, the horizontal resolution of ensemble model will likely reach 5km around 2025. OMSZ plans of developments on its ALADIN/AROME operational suite was also detailed.
References
Bodolainé, J.E., 1976: Mennyiségi csapadékelőrejelzés a Duna és a Tisza vízgyűjtő területére a csapadékot létrehozó folyamatok találkozási modellje alapján. Manuscript, OMSZ Library, Budapest. (in Hungarian)
Bodolainé, J.E., 1983: Árhullámok szinoptikai feltételei a Duna és a Tisza vízgyűjtő területén. OMSZ Hivatalos Kiadványai 56, Budapest. (in Hungarian)
Bonta, I., and Újváry K., 2011: Hidrológiai célú mennyiségi csapadékelőrejelzés hazánkban. Magyar Tudomány 172, 1449–1458. (in Hungarian)
Bölöni, G., Kullmann, L., and Horányi, A., 2009: Use of ECMWF lateral boundary conditions and surface assimilation for operational ALADIN model in Hungary. ECMWF Newsletter 119, 29–35.
Caumont, O., Ducroq, V., Watterlot, E., Jaubert, G., and Pradier-Varbe, S., 2010: 1D+3DVar assimilation of radar reflectivity data: a proof of concept, Tellus A 62, 173–187.
https://doi.org/10.1111/j.1600-0870.2009.00430.x
Ferro, C.A.T., and Stephenson, D.B., 2011: Extremal Dependence Indices: Improved Verification Measures for Deterministic Forecasts of Rare Binary Events. Weather Forecas. 26, 699–713.
https://doi.org/10.1175/WAF-D-10-05030.1
Gaál, N. and Ihász, I., 2015: Evaluation of the cold drops based on ERA-Interim reanalysis and ECMWF ensemble model forecasts over Europe. Időjárás 119, 111–126.
Gebhardt, C., Theis, S., Krahe, P., and Renner, V., 2008: Experimental ensemble forecasts of precipitation based on a convection-resolving model. Atmos. Sci. Lett. 9, 67–72.
https://doi.org/10.1002/asl.177
Gneiting, T., 2014: Calibration of medium-range weather forecasts. ECMWF Techn. Memoranda, 719.
Hagedorn R., 2008: Using the ECMWF reforecast datasets to calibrate EPS reforecasts, ECMWF Newsletter, 117, 8–12.
Horányi, A., Ihász, I., and Radnóti, G., 1996: ARPEGE/ALADIN: A numerical weather prediction model for Central-Europe with the participation at the Hungarian Meteorological Service.
Időjárás 110, 203–227.
Horányi, A., Kertész, S., Kullmann, L, and Radnóti, G., 2006: The ARPEGE/ALADIN mesoscale numerical modelling system and its application at the Hungarian Meteorological Service., Időjárás 110, 203–227.
Horányi, A., Mile, M., and Szűcs, M., 2011: Latest developments around the ALADIN operational short-range ensemble prediction system in Hungary, Tellus 63A, 642-651.
https://doi.org/10.1111/j.1600-0870.2011.00518.x
Ihász, I., 1992: Hogyan működik az első operatív hazai numerikus előrejelző modell? Légkör 37, 12–36.
(in Hungarian)
Ihász, I., 2004: Experiments of clustering for central European area especially in extreme weather situations. Proceedings of the Ninth ECMWF Workshop on Meteorological Operational Systems, Reading UK, 10-14 November 2003, 112–116.
Ihász, I., Üveges, Z., Mile, M., and Németh, Cs., 2010: Ensemble calibration of ECMWF's medium- range forecasts. Időjárás 114, 275–286.
Ihász, I., and Tajti, D., 2011: Use of ECMWF's ensemble vertical profiles at the Hungarian Meteorological Service. ECMWF Newsletter 129, 20–24.
Ihász, I., 2014: Az operatív numerikus modellezés kezdeti évei Magyarországon: A svéd modell alkalmazása. In Dévényi Dezső emlékkötet 63–69. (in Hungarian)
Jones, C.D. and Macpherson, B., 1997: A latent heat nudging scheme for the assimilation of precipitation data into an operational mesoscale model. Meteorol. Appl. 4, 269–277.
https://doi.org/10.1017/S1350482797000522
Lázár, D. and Ihász, I., 2016: Potential benefit of the ensemble forecasts in case of heavy convective weather situations. Időjárás 120, 383–394.
Mátrai, A. and Ihász, I., 2017: Calibrating forecasts of heavy precipitation in river catchments, ECMWF Newsletter, 152, 32–35.
Migliorini, S., Dixon, M., Bannister, R., and Ballard, S., 2011: Ensemble prediction for nowcasting with a convection-permitting model. I: Description of the system and the impact of radar- derived surface precipitation rates. Tellus 63A, 468–496.
https://doi.org/10.1111/j.1600-0870.2010.00503.x
Mile, M., Bölöni, G., Randriamampianina, R., Steib, R., and Kucukkaraca, E., 2015: Overview of mesoscale data assimilation developments at the Hungarian Meteorological Service. Időjárás 119, 213–237.
Nuissier, O., Marsigli, C., Vincendon, B., Hally, A., Bouttier, F., Montani, A., and Paccagnella, T., 2016: Evaluation of two convection-permitting ensemble systems in the HyMeX Special Observation Period (SOP1) framework: Evaluation of two convection-permitting ensemble systems. Quart. J. Roy. Met. Soc. 142, 404–418. https://doi.org/10.1002/qj.2859
Persson, A., 2011: User guide to ECMWF forecasts products, ECMWF, Reading.
Richardson, D., Hemri, S., Bogner, K., Gneiting, T., Haiden, T., Pappenberger, F., and Scheuerer, M., 2014: Calibration of ECMWF forecasts, ECMWF Newsletter 142, 12–16.
Seity, Y., Brousseau, P., Malardel, S., Hello, G., Bénard, P., Bouttier, F., Lac, C., and Masson, V., 2011: The AROME-France Convective-Scale Operational Model. Month. Weather Rev. 139, 976–991. https://doi.org/10.1175/2010MWR3425.1
Smith, P., Pappenberger, F., Wetterhall, F., Thielen, J., Krzeminski, B., Salamon, P., Muraro, D., Kalas, M., and Baugh, C., 2016: On the operational implementation of the European Flood Awareness System (EFAS), ECMWF Techn. Memoranda 778.
Szépszó, G., 2003: A 80-as és 90-es évek árhullámainak szinoptikus-klimatológiai értékelése. Master thesis. Eötvös Loránd University, Budapest. (in Hungarian)
Szintai, B., Bazile, E., and Seity, Y., 2014: Improving wintertime low cloud forecasts in AROME:
sensitivity experiments and microphysics tuning. ALADIN-HIRLAM Newsletter 3. 45–58.
Szintai, B., Szűcs, M., Randriamampianina, R., and Kullmann, L., 2015: Application of the AROME non-hydrostatic model at the Hungarian Meteorological Service: physical parameterizations and ensemble forecasting, Időjárás 119, 241–265.
Szűcs, M., Sepsi, P., and Simon, A.: 2016: Hungary's use of ECMWF ensemble boundary conditions, ECMWF Newsletter 148, 24–31.
Vié, B., Nuissier, O., and Ducrocq, V., 2011: Cloud-resolving ensemble simulations of Mediterranean heavy precipitating events: Uncertainty on initial conditions and lateral boundary conditions.
Month. Weather Rev. 139, 403–423. https://doi.org/10.1175/2010MWR3487.1