DOI:10.28974/idojaras.2018.4.1
IDŐJÁRÁS
Quarterly Journal of the Hungarian Meteorological Service Vol. 122, No. 4, October – December, 2018, pp. 361–374
Agricultural autumn drought and crop yield in 2011 in Poland
Andrzej Doroszewski, Katarzyna Żyłowska, Anna Nieróbca, and Tytus Berbeć*
Institute of Soil Science and Plant Cultivation - State Research Institute, Czartoryskich 8, 24-100 Puławy, Poland
Corresponding author E-mail: tberbec@iung.pulawy.pl (Manuscript received in final form November 15, 2017)
Abstract⎯Over the recent years, drought has been occurring with an ever increasing frequency in Poland. The longer the rainless period lasts, the more acute its impacts are.
Agricultural drought manifests itself as a prolonged period of water shortage for agricultural crops during their growth season resulting in yield reduction. Extent of drought was evaluated by the climatic water balance (CWB). Climatic water balance is an indicator that determines the state of humidification of the environment using data measured at meteorological stations. It is defined as the difference between atmospheric precipitation and evapotranspiration (in millimeters) calculated by an empirical formula taking into account: temperature, sunshine, and length of the day. CWB was calculated using meteorological data from 294 weather stations and weather posts across Poland.
Spatial data from point measurements were interpolated using the Geographic Information System (GIS) software. Yield forecasts were made for major crops in Poland using agro-meteorological yield models and weather indices (WI). Yield figures were based on data from the Central Statistical Office of Poland (GUS).
The autumn of 2011 was the driest in several dozen years in many localities of south- eastern Poland. For instance, at the weather station in Puławy, the lowest level of precipitation had been recorded since 1871. Weather conditions prevailing in the growing season of 2012 were very beneficial for winter cereals and winter rapeseed. As for sugar beet, the weather also favored high yields over most of the growing season, except the final stage of growth. Notwithstanding the extreme drought in the autumn of 2011, the good weather conditions in the remaining part of the growth period caused the yields of winter crops and sugar beet to be high.
The very scant autumn precipitation, even though it had negative impact on the germination of cereals, seedling emergence, and seedling growth, did not cause any major losses to yields. Water supplies from September precipitation combined with frequent morning mists, fogs, and dew mitigated the impact of prolonged drought and were sufficient to sustain the yields at an acceptable level.
Key–words: agricultural drought, atmospheric drought, climatic water balance (CWB), precipitation, yields
1. Introduction
The climate change precipitates events of extreme nature, drought being one of them (Łabędzki, 2006). Drought can be very acute, especially if prolonged. As the rainless spell continues, the first to appear is the atmospheric drought, and it is followed by hydrological drought.
In the field, drought and its intensity can be determined by means of teledetection techniques and using meteorological data. The method used to determine the occurrence of drought is the standardized precipitation index (SPI) (Dhakar et al., 2013; Li et al., 2012; Vergin and Todisco, 2011). There are also other modified indicators to measure the extent of drought such as standardized precipitation evapotranspiration index (SPEI) (Meza, 2013) and agricultural drought index (ADI) (Brunini et al., 2005), both of which utilize evapotranspiration data. A different group of methods employs satellite image- based data by using the normalized difference vegetation index (NDVI) or its variants (Ezzine et al., 2014; Rhee et al., 2010; Son et al., 2012; Wu et al., 2013).
In this study, the CWB index that takes account the evapotranspiration and atmospheric precipitation figures (Doroszewski et al., 2012, 2016; Łabędzki et al., 2008, 2011) was used to ascertain the occurrence of drought.
Agricultural drought becomes manifest as a long and profound shortage of water available to plants during their growth, whose final outcome is yield reduction. High air temperatures, heavy insolation, and high wind velocities combine to increase the rate of evaporation of water from plants and soil. In Poland, drought in the growing season occurs at various times, but most frequently in the spring and much less frequently in the autumn (Farat et al., 1995). The previous extreme drought spells were recorded in 1951 and 1959 in south-eastern Poland (Mitosek, 1960).
Losses to agricultural drought are important economic problems nationwide because of massive reduction in crop yields (Lipiec et al., 2013;
Martyniak et al., 2007). They are also major economic issues for farmers themselves, as they generate a decrease in gross financial returns made from farming (Lawes and Kingwell, 2012).
The objective of the study was to describe the meteorological conditions behind the extreme atmospheric drought in the autumn of 2011, and to assess the drought’s impact on the yields of winter cereals and sugar beets in Poland.
2. Materials and methods
The drought-related meteorological conditions were determined using the climatic water balance (CWB) i.e., as a difference between the atmospheric precipitation and potential evaporation (Doroszewski et al., 2012, 2014; Harmsen et al., 2009;
Kanecka-Geszke and Smarzyńska, 2007; Legates and McCabe, 2005; Łabędzki, 2006; Łabędzki et al., 2011; Paltineanu et al., 2011; Rojek, 1987).
CWB = P – ETP, (1) where P is the atmospheric precipitation (mm) and ETP is the
evapotranspiration (mm).
Potential evapotranspiration was calculated using formula (Doroszewski and Górski, 1995) based on Penman’s algorithm (Penmann, 1948):
ETP = –89.6 + 0.0621 t2 + 0.00448 h1,66 + 9.1 f , (2) where t is the mean air temperature 2 mm above ground level (oC), h is the
insolation (h), and f is the daylength (h).
Data on atmospheric precipitation came from 54 weather stations and 163 precipitation-measuring posts operated by IMGW–PIB (Institute of Meteorology and Water Management – National Research Institute), 50 weather stations run by COBORU (Research Center for Cultivar Testing), and 27 automated weather stations operated by IUNG-PIB (Institute of Soil Science and Plant Cultivation- State Research Institute). Potential evapotranspiration (ETP) was determined based on weather data collected by 54 IMGW-PIB weather stations and 27 IUNG-PIB weather stations. Altogether, CWB was calculated based on data from 295 sites across Poland. Spatial data from on-site measurements were interpolated using GIS (Geographic Information System).
Yield predictions for major crops in Poland were made using agro- meteorological yield models – weather indices were developed by IUNG-PIB (Górski et al., 1997). Actual yield figures for the crops under study were obtained from data published by GUS (Main Statistical Office of Poland) (Statistical yearbooks of Agricultural, 2003–2013).
3. Results and discussion
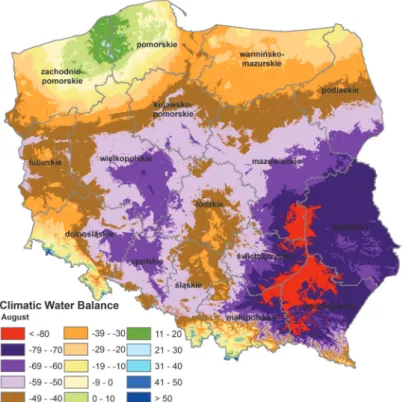
The first signs of an imminent drought were recorded as early as in August 2011 in the south-eastern part of Poland (Fig. 1). An unequivocal water deficit also occurred in September. Water deficits in both months (August and September) were as high as 120 to 150 mm over large areas of some provinces: southern part of Mazowieckie, eastern part of Świętokrzyskie, northern part of Podkarpackie, and nearly across the whole area of the province of Lubelskie (Figs. 1 and 2). In those areas, average long-term CWB values ranged from –50 to –20 mm (Rojek, 1987).
The weather conditions were very conducive to drought: the air temperature in the southern part of Poland in August was 1.5 oC above the long-term average, whereas precipitation-wise the month was dry, very dry, or extremely dry over most of the country. The precipitation in the south-eastern part of the country accounted for 30 to 40% of that averaged over the period from 1971 to 2000 (Bulletin of the National Hydrological and Meteorological Services, 2011).
Fig. 1. Climatic water balance in August 2011.
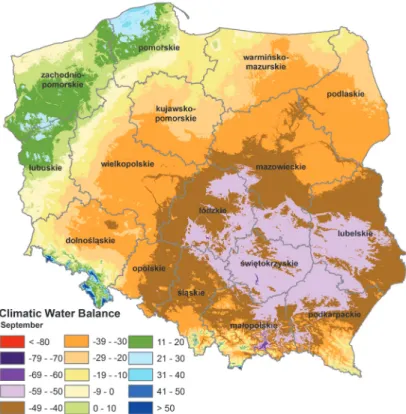
September was also very warm throughout the country. The temperature exceeded the long-term average by 2 oC. Except for the western and north- western parts, where precipitation of 30 to 100 mm was recorded, the remaining area of Poland received substantially less rainfall: from 2 to 30 mm. In the central and eastern parts of Poland, September was extremely dry, very dry, or dry. In Puławy (province of Lubelskie), the precipitation was 6.2 mm (12% of the long-term average). In Kozienice (province of Mazowieckie), it was 2.9 mm (5.6% of the long-term average). Across the country, the average monthly precipitation was approximately the 50% of the long-term average. Those thermal and moisture conditions brought a substantial shortage of water in south-eastern Poland, which ranged from 40 to 60 mm (Fig. 2). Such a heavy deficit caused the top layer of soil to become exceedingly dry (Bulletin of the National Hydrological and Meteorological Services, 2011).
Fig. 2. Climatic water balance in September 2011.
In October, the heaviest water deficit occurred in central Poland, ranging from 10 to 20 mm (Fig. 3). The long rainless period aggravated even further the shortage of the soil water. Over a large area of the country, the parching of topsoil continued to be recorded. The monthly average temperature of October was 0.3 oC in excess of the regular temperature for the month. In thermal terms it was qualified as normal. October was dry to very dry over most of the country, becoming extremely dry in the north-eastern and central parts (Bulletin of the National Hydrological and Meteorological Services, 2011).
In November, the thermal conditions approached the long-term average (Bulletin of the National Hydrological and Meteorological Services, 2011).
Exept for north-eastern Poland, where the precipitation was the highest, the remaining part of the country received very little, if any, of it (Table 2). Scant precipitation combined with low evapotranspiration (Table 3) caused the water deficit (CWB) to be as low as 10 mm over a large portion of the country, especially in its southern part (Fig. 4). Precipitation-wise, the month was rated across the nation as extremely dry, and the heavy shortage of precipitation aggravated only the moisture conditions of the soil also (Bulletin of the National Hydrological and Meteorological Services, 2011).
Fig. 3. Climatic water balance in October 2011.
Fig. 4. Climatic water balance in November 2011.
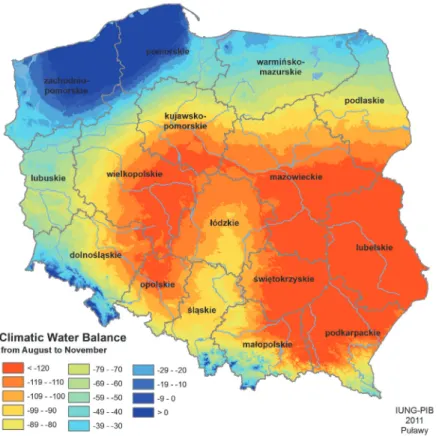
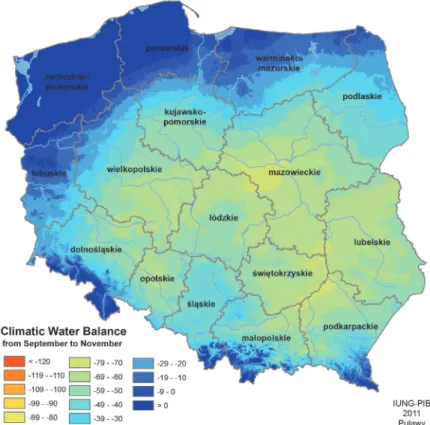
Difficult weather conditions in the autumn period were depicted by the CWB map for the periods August to November (Fig. 5) and September to November (Fig. 6). The cumulative maps show the area of the country, where the drought occurred.
At many localities of south-eastern Poland, the autumn of 2011 was the driest in many years (Tables 1, 2, and 3). The meteorological station in Puławy is one of the oldest in Poland. On the basis of data obtained from observations conducted since 1871, it was possible to find out how often drought occurred in this area. In Puławy, extreme autumn atmospheric drought with precipitation that falls short of 50% of the long-term average appears once in about 15 years, on average. However, such low precipitation as that in 2011 had not been recorded since 1871 (Table 1). Particularly low precipitation, below 30% of the long-term average, occurred in the years 1951, 1959, and 2011, but that below 30 mm occurred only once, in 2011, which is an absolute record in the 142-year- long history of that station.
Fig. 5. Climatic water balance for the entire period from August to November in 2011.
Fig. 6. Climatic water balance for the entire period from September to November in 2011.
Table 1. Years of lowest rainfall in autumn (September-November) in the period of 1871- 2012 in Pulawy.
No. Years
Precipitation, month, season Sept
(mm)
Sept (% of norm)*
Oct (mm)
Oct (% of norm)*
Nov (mm)
Nov (% of norm)*
Autumn (mm)
Autumn (% of norm)**
1 1891 14 28 11 26 35 90 60 45
2 1908 30 60 22 51 13 33 65 49
3 1942 7 14 32 74 26 67 65 49
4 1911 17 34 21 49 15 38 53 40
5 1951 2 4 1 2 31 79 34 26
6 1959 7 14 8 19 16 41 31 23
7 1965 21 42 9 21 35 90 65 49
8 2005 33 66 3 7 28 72 64 48
9 2011 6 12 22 51 0 (0.2) 0 (1) 28 21
1871–2012 50 100 43 100 39 100 132 100
*Months: 25–49.9% - very dry; <25% - extremly dry (Kaczorowska, 1962; Łabędzki, 2006).
**Season: 50–74.9% - very dry; <50% - extremly dry (Kaczorowska, 1962; Łabędzki, 2006).
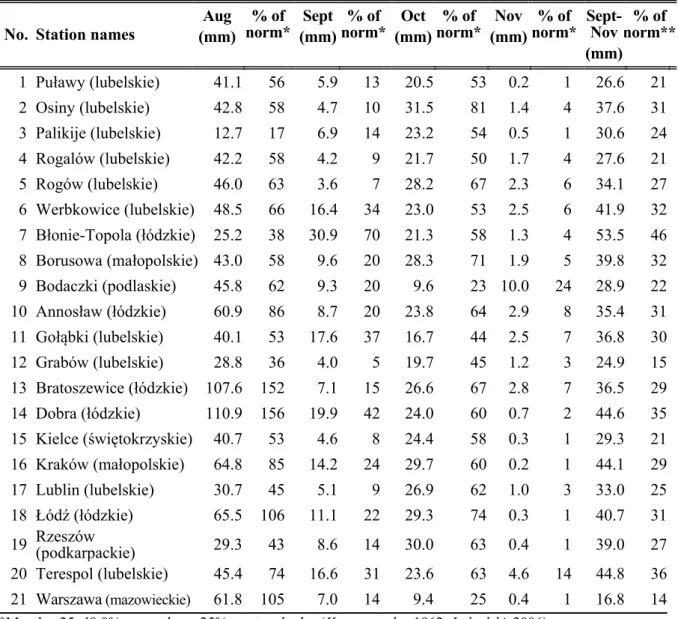
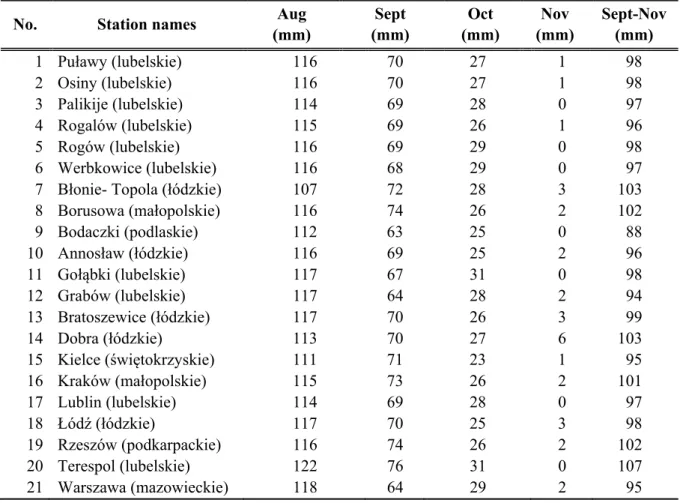
Tables 2 and 3 show data from selected meteorological stations in south- eastern Poland, where very low values of precipitation (Table 2) and potential evapotranspiration (Table 3) occurred in the autumn of 2011. The evapotranspiration (Table 3) in November was very close or even equal to zero.
Table 2. Monthly precipitation values in 2011 and long-term monthly averages in selected meteorological stations of south-eastern Poland.
No. Station names
Aug (mm)
% of norm* Sept
(mm)
% of norm* Oct
(mm)
% of norm* Nov
(mm)
% of norm* Sept-
Nov (mm)
% of norm**
1 Puławy (lubelskie) 41.1 56 5.9 13 20.5 53 0.2 1 26.6 21 2 Osiny (lubelskie) 42.8 58 4.7 10 31.5 81 1.4 4 37.6 31 3 Palikije (lubelskie) 12.7 17 6.9 14 23.2 54 0.5 1 30.6 24 4 Rogalów (lubelskie) 42.2 58 4.2 9 21.7 50 1.7 4 27.6 21 5 Rogów (lubelskie) 46.0 63 3.6 7 28.2 67 2.3 6 34.1 27 6 Werbkowice (lubelskie) 48.5 66 16.4 34 23.0 53 2.5 6 41.9 32 7 Błonie-Topola (łódzkie) 25.2 38 30.9 70 21.3 58 1.3 4 53.5 46 8 Borusowa (małopolskie) 43.0 58 9.6 20 28.3 71 1.9 5 39.8 32 9 Bodaczki (podlaskie) 45.8 62 9.3 20 9.6 23 10.0 24 28.9 22 10 Annosław (łódzkie) 60.9 86 8.7 20 23.8 64 2.9 8 35.4 31 11 Gołąbki (lubelskie) 40.1 53 17.6 37 16.7 44 2.5 7 36.8 30 12 Grabów (lubelskie) 28.8 36 4.0 5 19.7 45 1.2 3 24.9 15 13 Bratoszewice (łódzkie) 107.6 152 7.1 15 26.6 67 2.8 7 36.5 29 14 Dobra (łódzkie) 110.9 156 19.9 42 24.0 60 0.7 2 44.6 35 15 Kielce (świętokrzyskie) 40.7 53 4.6 8 24.4 58 0.3 1 29.3 21 16 Kraków (małopolskie) 64.8 85 14.2 24 29.7 60 0.2 1 44.1 29 17 Lublin (lubelskie) 30.7 45 5.1 9 26.9 62 1.0 3 33.0 25
18 Łódź (łódzkie) 65.5 106 11.1 22 29.3 74 0.3 1 40.7 31
19 Rzeszów (podkarpackie) 29.3 43 8.6 14 30.0 63 0.4 1 39.0 27 20 Terespol (lubelskie) 45.4 74 16.6 31 23.6 63 4.6 14 44.8 36 21 Warszawa (mazowieckie) 61.8 105 7.0 14 9.4 25 0.4 1 16.8 14
*Months: 25–49.9% - very dry; <25% - extremly dry (Kaczorowska, 1962; Łabędzki, 2006)
**Seasons:50–74.9% - very dry; <50% - extremly dry (Kaczorowska, 1962:Łabędzki, 2006)
The optimum sowing date for winter rapeseed in drought-endangered areas is between the 10th and 20th of September (Wałkowski et al., 2002). In 2011, following a very rainy July, the soil was relatively well supplied with water, and there were no problems with emergence and rosette formation. Those conditions
caused the rapeseed to enter the overwintering season in a good condition, the plants developed 12–14 leaves, and the thickness of root crowns was also sufficient: 2–3 cm (Wałkowski et al., 2002).
Table 3. Monthly evapotranspiration values in 2011, south-eastern Poland No. Station names Aug
(mm)
Sept (mm)
Oct (mm)
Nov (mm)
Sept-Nov (mm)
1 Puławy (lubelskie) 116 70 27 1 98
2 Osiny (lubelskie) 116 70 27 1 98
3 Palikije (lubelskie) 114 69 28 0 97
4 Rogalów (lubelskie) 115 69 26 1 96
5 Rogów (lubelskie) 116 69 29 0 98
6 Werbkowice (lubelskie) 116 68 29 0 97
7 Błonie- Topola (łódzkie) 107 72 28 3 103
8 Borusowa (małopolskie) 116 74 26 2 102
9 Bodaczki (podlaskie) 112 63 25 0 88
10 Annosław (łódzkie) 116 69 25 2 96
11 Gołąbki (lubelskie) 117 67 31 0 98
12 Grabów (lubelskie) 117 64 28 2 94
13 Bratoszewice (łódzkie) 117 70 26 3 99
14 Dobra (łódzkie) 113 70 27 6 103
15 Kielce (świętokrzyskie) 111 71 23 1 95
16 Kraków (małopolskie) 115 73 26 2 101
17 Lublin (lubelskie) 114 69 28 0 97
18 Łódź (łódzkie) 117 70 25 3 98
19 Rzeszów (podkarpackie) 116 74 26 2 102
20 Terespol (lubelskie) 122 76 31 0 107
21 Warszawa (mazowieckie) 118 64 29 2 95
The optimum seeding date in drought-affected areas in 2011(south-eastern Poland) was from the 16th to 25th of September (Grabiński et al., 2007) for rye and from the 21th of September to the 1st of October for wheat (Podolska and Hołubowicz-Kliza, 2005). In that period, a considerable shortage of water occurred, which may have caused very poor emergence. Because of substantial water deficit in the soil in the drought-affected areas, the tillering of rye in the autumn of 2011 was very poor (Bulletin of the National Hydrological and Meteorological Services, 2011) or, in extreme cases, non-existent. As a result of improved weather conditions, the tillering became more profuse only at the beginning of the winter season.
Among winter cereals, rye has the best developed root system, while the root system of barley developes slightly less, and that of wheat and triticale even more inferior. Notwithstanding, the yield forecast by IUNG-PIB envisaged
slightly higher yield losses for rye than for winter wheat (Table 4). Since rye was sown in September, earlier than wheat, it was much more exposed to drought than wheat. At the time of rye seeding (the second half of September) and in the first weeks after sowing, there was considerably less rainfall than when wheat was sown (the second half of September and the beginning of October). In October, in particular, moisture (Figs. 2 and 3) and precipitation conditions were much superior to those in September (Table 2). In Poland, rye is grown on soils which are much poorer and more prone to drought than those on which wheat is cultivated. The disadvantageous seeding date and the impact of poor soils were taken in account in the predictions, which foresaw that rye would respond with a slightly greater yield reduction than wheat (Table 4).
Table 4. Forecasted yields of winter crops in 2012 and sugar beet in 2011 (in %) relative to the long-term average yields
No. Voivodeship Rye Winter wheat
Winter triticale
Winter rape
Sugar beet
1 Dolnośląskie 100 100 100 103 112
2 Kujawsko-Pomorskie 99 100 99 99 110
3 Lubelskie 98 99 97 104 103
4 Lubuskie 101 101 101 99 107
5 Łódzkie 99 99 98 105 107
6 Małopolskie 99 100 99 104 102
7 Mazowieckie 97 98 97 102 100
8 Opolskie 98 99 98 102 108
9 Podkarpackie 99 100 99 102 101
10 Podlaskie 100 100 99 106 107
11 Pomorskie 101 101 101 102 95
12 Śląskie 100 100 100 105 105
13 Świętokrzyskie 97 99 97 99 95
14 Warmińsko-Mazurskie 100 100 99 105 106
15 Wielkopolskie 99 99 99 102 108
16 Zachodniopomorskie 101 101 101 100 109
Poland 99 100 99 103 105
The substantial water deficit, although it has an adverse impact on the germination and seedling emergence of winter crops, did not cause important yield losses. Also, the very low rainfall did not sause much harm at the beginning of the growing season, when the winter cereals were at the seedling stage and had few tillers. At that stage the plants did not require much water, as there was still enough available moisture from the September rainfall and from frequently occurring mists
and dew which mitigated the effects of prolonged drought, and which were plentiful enough to prevent heavy yield decrease (Table 4).
The impact of water deficit (low CWB values) and low rainfall in south- eastern Poland was reflected by yield predictions as decreased weather index (WI) values (Table 4). In areas where water shortage was acute, WI values were lower compared to those in the remaining parts of the country. However, the predicted yield reductions on long term-averages were not large, amounting from 2 to 3%. Thus, the adverse weather pattern in the autumn of 2011 did not cause substantial losses to the yields of the crops under study.
The autumn drought occurred chiefly in south-eastern Poland. In the north- western part of the country, the moisture conditions were much superior to those of the remaining areas. In the case of rapeseed, the 3% yield reduction in the north-east was caused by excessive rainfall (Table 4). Water deficit in the autumn of 2011 in the south-eastern part of Poland can be described as extreme atmospheric drought (Kaczorowska, 1962), whereas, because of relatively small yield losses, it is not qualified as agricultural drought (Doroszewski et al., 2008, 2012; The Act, 2005).
The drought of 2011 in Poland, although it was extreme in meteorological terms (Kaczorowska, 1962), did not cause excessive losses to winter cereals or sugar beets (Tables 4), since weather conditions prevailing in the advanced part of the growing season favored winter crops. WI values showed that the impact of the extremely low values of autumn precipitation in south-eastern Poland did not cause a significant yield reduction on long-term averages, as the yields of winter crops in 2012 and those of sugar beets in 2011 were high (Table 4).
In the autumn of 2011, the precipitation in south-eastern Poland was extremely low, amounting to 25 to 50 mm of the long-term average. However, the crop yields in drought-affected areas approached the long-term figures or even exceeded them in the case of winter rapeseed and sugar beets. Such a situation was caused by the favorable pattern of the remaining weather elements that positively affected yields: temperature and air humidity, mists, fogs, and dew. In November, when extremely low precipitation value was recorded, evapotranspiration was also very low (close to zero) thus, as a result, CWB figures were close to zero and no substantial water deficit occurred. The frequent occurrence of fogs, mists, and dew (Bulletin of the National Hydrological and Meteorological Services, 2011) caused the water shortages to be considerably mitigated as, under those conditions, precipitation accounted for 10–25% of the total amount of water available to plants.
4. Conclusions
In the autumn of the year 2011 (particularly in September and November) extremely low values of precipitation occurred in south-eastern Poland. The
occurrence of an extreme atmospheric drought did not cause considerable reduction of crop yields in the five drought-affected provinces. Unfavorable weather conditions did not cause yield reduction on long-term average figures for rapeseed, sugar beets, and winter cereals: wheat, barley, triticale, cereal mixtures. Low air temperature combined with a frequent occurrence of fogs, mists, and dew mitigated the adverse effect of drought and positively influenced the crop yields.
Acknowledgements: This work was supported by the research project „System of monitoring of agricultural drought in Poland” of Polish Ministry of Agriculture and Rural Development.
References
Brunini, O., Dias da Silva, P.L., Griman, A.M., Assad Delgado, E., and Boken, V.K., 2005.
Agricultural drought phenomena in Latian America with focus on Brazil. In (Eds.: Boken, V.K., Cracknell, A.P., Heathcote, R.L.) Monitoring and predicting agricultural drought: A Global Study. Oxford University Press, 156–168.
Bulletin of the National Hydrological and Meteorological Services, IMGW-PIB. 2011. 8–13; 106–111 Statistical yearbook of Agricultural, 2003-2013. Central Statistical Office of Poland (GUS), Warsaw.
Dhakar, R., Sehgal, V.K., and Pradhan, S., 2013. Study on inter-seasonal and intra seasonal relationship of meteorological and agricultural drought indices in the Rajasthan State of India. J.
Arid Environ. 97, 108–119. https://doi.org/10.1016/j.jaridenv.2013.06.001
Doroszewski, A. and Górski, T., 1995. Prosty wskaźnik ewapotranspiracji potencjalnej. Rocz. AR Pozn., CCLXXI, Melior. Inż. Środ., 16, 3–8. (In Polish)
Doroszewski A., Jóźwicki T., Wróblewska E., and Kozyra J., 2014. Susza rolnicza w Polsce w latach 1961-2010, Puławy, ISBN 978-83-7562-171-6. (In Polish)
Doroszewski, A., Kozyra, J., Pudełko, R., Stuczyński, T., Jadczyszyn, J, Koza, P., and Łopatka, A., 2008. Monitoring suszy rolniczej w Polsce. Wiad. Mel. i Łąk., 416, 35–38. (In Polish)
Doroszewski, A., Jadczyszyn, J., Kozyra, J., Pudełko, R., Stuczyński, T., Mizak, K., Łopatka, A., Koza, P., Górski, T., Wróblewska, E., 2012. Podstawy Systemu Monitoringu Suszy Rolniczej. Woda Środ. Obsz. Wiej. (IV-VI), 12, 2(38), 77–91. (In Polish)
Doroszewski A., Wróblewska E., Pudełko R., Żyłowska K., Koza P., and Nieróbca A., 2016. System monitoringu suszy rolniczej w Polsce – podstawy metodologiczne i możliwości zastosowań. In:
(Eds. Dembek W., Kuś J., Wiatkowski M., Żurek G. Brwinów) Innowacyjne metody gospodarowania zasobami gospodarki wodnej w rolnictwie. 105–128.(In Polish)
Ezzine, H., Bouziane, A., and Ouazar, D., 2014. Seasonal comparisons of meteorological and agricultural drought indices in Marocco using open short time-series data. International Journal of Applied Earth Observation and Geoinformation 26, 36–48.
https://doi.org/10.1016/j.jag.2013.05.005
Farat, R., Kępińska-Kasprzak, M., Kowalczak P, and Mager, P., 1995. Susze na obszarze Polski w latach 1951-1990. Mater. Bad. IMGW Gosp. Wodna i Ochrona Wód. Vol. 16, 59-72(In Polish) Górski, T., Demidowicz, G., Deputat, T., Górska, K., Marcinkowska, I., and Spoz-Pać, W., 1997.
Empiryczny model plonowania pszenicy ozimej w funkcji czynników meteorologicznych. Zesz.
Nauk. AR, Wrocław, 313, 99–109. (In Polish)
Grabiński, J., Hołubowicz-Kliza, G., and Brzóska, F., 2007. Uprawa i wykorzystanie żyta ozimego.
IUNG PIB, IŻ PIB, User’s of Dissemination, 138. 1-80.(In Polish)
Harmsen, E.W., Miller, N.L., Schlegel, N.J., and Gonzalez, J.E., 2009. Seasonal climate change impacts on evapotranspiration, precipitation deficit and crop yield in Puerto Rico. Agric. Water Manage. 96, 1085–1095. https://doi.org/10.1016/j.agwat.2009.02.006
Kaczorowska, Z., 1962. Opady w Polsce w przekroju wieloletnim. Ed. Wyd. Geol. Warszawa, Prace Geogr. Instytut Geogr. PAN, 33. (In Polish)
Kanecka-Geszke, E. and Smarzyńska, K., 2007. Ocena suszy meteorologicznej w wybranych regionach agroklimatycznych Polski przy użyciu różnych wskaźników. Acta Sci. Pol. Formatio Circumiectus 6(2), 41–50. (In Polish)
Lawes, R.A. and Kingwell, R.S., 2012. A longitudinal examination of business performance indicators for drought-affected farms. Agric. Syst. 106, 94–101.
https://doi.org/10.1016/j.agsy.2011.10.006
Legates, D.R., and McCabe, G.J., 2005. A re-evaluation of the average annual global water balance.
Phys. Geogr. 26, 467–479. https://doi.org/10.2747/0272-3646.26.6.467
Li, Y., Zheng, X., Lu, F., and Ma, J., 2012. Analysis of drought evolvement characteristics based on Standardized Precipitation Index in the Huaihe River Basin. Procedia Engineering 28, 434–437.
https://doi.org/10.1016/j.proeng.2012.01.746
Lipiec, J., Doussan, C., Nosalewicz, A., and Kondracka, K., 2013. Effect of drought and heat stresses on plant growth and yield: a review. Int. Agrophys. 27, 463–477.
https://doi.org/10.2478/intag-2013-0017
Łabędzki, L., 2006. Susze rolnicze – zarys problematyki oraz metody monitorowania i klasyfikacji. Rozpr.
Nauk. Monografie, Falenty: IMUZ, Woda-Środowisko-Obszary-Wiejskie, 17, 107. (In Polish) Łabędzki, L., Bąk, B., Kanecka-Geszke, E., Kasperska-Wołowicz, W., and Smarzyńska, K., 2008. Związek
między suszą meteorologiczną i rolniczą w różnych regionach agroklimatycznych Polski. Rozpr.
Nauk. Monografie, Falenty: IMUZ, Woda-Środowisko-Obszary-Wiejskie 25. (In Polish)
Łabędzki, L., Kanecka-Geszke, E., Bąk, B., and Słowinska, S., 2011. Estimation of reference evapotranspiration using the FAO Penman-Monteith method for climatic Conditions of Poland.
Evapotranspiration. Ed. Prof. Leszek Łabędzki, InTech. 275–294.
Martyniak, L., Dabrowska-Zielinska, K., Szymczyk, R., and Gruszczynska, M., 2007. Validation of satellite-derived soil-vegetation indices for prognosis of spring cereals yield reduction under drought conditions – case study from central-western Poland. Adv. Space Res. 39, 67–72.
https://doi.org/10.1016/j.asr.2006.02.040
Meza, F.J., 2013. Recent trends and ENSO influence on droughts in Northern Chile: An application of the Standardized Precipitation Evapotranspiration Index. Weather Climate Extr. 1, 51–58.
https://doi.org/10.1016/j.wace.2013.07.002
Mitosek, H., 1960. Letnio-jesienna susza 1959 r. Post. Nauk Rol., 1(61), 53–64. (In Polish)
Paltineanu, C., Chitu, E., and Mateescu, E., 2011. Changes in crop evapotranspiration and irrigation water requirements. Int. Agrophys. 25, 369–373.
Penmann, H.L., 1948. Natural evaporation from open water, bare soil and grass. Proc. Roy. Soc. of London. 193, 120–145. https://doi.org/10.1098/rspa.1948.0037
Podolska, G. Hołubowicz-Kliza, G., 2005. Uprawa pszenicy ozimej na cele młynarskie. IUNG-PIB.
User’s of Dissemination, 106. (In Polish)
Rhee, J., Im, J., and Carbone, G.J., 2010. Monitoring agricultural drought for arid and humid regions using multi-sensor remote sensing data. Remote Sens. Environ. 114, 2857–2887.
https://doi.org/10.1016/j.rse.2010.07.005
Rojek, M., 1987.Rozkład czasowy i przestrzenny klimatycznych i rolno-klimatycznych bilansów wodnych na terenie Polski. Zesz. Nauk. AR. Wrocław, 62, 67. (In Polish)
Son, N.T., Chen, C.F., Chen, C.R., Chang, L.Y., Minh, V.Q., 2012. Monitoring Agricultural drought in the Lower Mekong Basin using Modis NDVI and land surface temperature data. International Journal of Applied Earth Observation and Geoinformation, 18, 417-427.
https://doi.org/10.1016/j.jag.2012.03.014
Ustawa z 2005. O dodatkowych opłatach za ubezpieczenie upraw rolnych i zwierząt gospodarskich Art.150, 1249 ze zmianami.(In Polish)
Wałkowski, T., Bartkowiak-Broda, I., Krzymański, J., Wielebski, F., Wójtowicz, M., Mrówczynski, M., Korbas, M., Paradowski, A., and Ochocki, P., 2002: Rzepak ozimy. Ed. IHAR Poznań. (In Polish) Wu, J., Zhou, L., Liu, M., Zhang, J., Leng, S., and Diao, C., 2013. Establishing and assessing the
Integrated Surface Drought Index (ISDI) for agricultural drought monitoring in mid-eastern China. Int. J. Appl. Earth Obs. Geoinf. 23, 397-410. https://doi.org/10.1016/j.jag.2012.11.003 Vergni, L., and Todisco, F., 2011. Spatio-temporal variability of precipitation, temperature and
agricultural drought indices i Central Italy. Agric. For. Meteorol. 151, 301–313.
https://doi.org/10.1016/j.agrformet.2010.11.005