DOI:10.28974/idojaras.2018.2.5
IDŐJÁRÁS
Quarterly Journal of the Hungarian Meteorological Service Vol. 122, No. 2, April – June, 2018, pp. 177–203
Severe convective supercell outbreak over western Bulgaria on July 8, 2014
Lilia Bocheva*1,Tsvetelina Dimitrova2, Rosen Penchev3, Ilian Gospodinov1, and Petio Simeonov1
1 National Institute of Meteorology and Hydrology - BAS, 66, Tsarigradsko shoes Blvd., 1784 Sofia, Bulgaria
2 Hail Suppression Agency,
17, Hristo Botev Blvd., 1606 Sofia, Bulgaria
3 Bulgarian Air Traffic Services Authority 1, Brucssels Blvd., Sofia, Bulgaria
*Corresponding author E-mail: Lilia.Bocheva@meteo.bg (Manuscript received in final form April 11, 2017)
Abstract⎯ Bulgaria is situated in a geographical area with high frequency and intensity of thunderstorms and hail events. Like in many other countries, an upward trend of weather- induced damage has been observed during the last 15 years in Bulgaria. Much of it was caused by extreme weather events such as torrential precipitation associated with severe thunderstorms or/and wind storms. The series of flash floods and extreme hail storms, which hit Bulgaria in the warm half of 2014, were in line with that trend.
On July 8, 2014, three supercell storms developed over West Bulgaria and heavily impacted urban areas in the afternoon. The extremely strong hail storms over Sofia and Montana were accompanied by strong wind gusts (about 85 km h–1) and torrential rain. The giant hail stones in Sofia had diameter of up to 10 cm and irregular shape. The severe hail and rain, and very strong wind caused substantial damage to infrastructure, buildings, vehicles, and agriculture. More than 40 people were injured by hail stones or collaterally by broken windows. One man was killed by a fallen tree. In Sofia alone, the reported damage was worth more than 100 million euro according to data from insurance companies.
The paper presents the analysis of the evolution of the convective clouds based on radar data. The Doppler radar data revealed the existence of a mesocyclone, mesoanticyclone, microburst, and three-body scatter signature. The cloud top reached up to 17 km, and the maximum radar reflectivity factor was 69–71 dBZ. Analysis of the available radiosounding data, simulation with a numerical model, and the synoptic patterns are also presented.
Key-words: severe convective storms, radar analyses, split cells, hail
1. Introduction
In the middle latitudes, there are two types of long-lived thunderstorms producing damaging hail - multicells and supercells. Supercells (SC) – first defined by Browning (1977) – are the most violent thunderstorms producing severe weather: hail with diameter higher than 1.9 cm, flash floods, wind gusts >
25 m s–1, tornadoes. Weisman and Klemp (1986) defined the main features of the supercells: 1) single, quasi-steady, rotating updraft, which may have a lifetime of several hours; 2) propagating continuously to the right (left) of the mean winds; 3) an elongation of the reflectivity pattern in the direction of the mean vertical wind shear vector; 4) a maximum gradient in the reflectivity field along the right (left) rear flank; 5) an overhang of middle-level reflectivity field over the low-level reflectivity field on the flank of the storm by several kilometers, indicating the presence of a strong updraft; 6) a hook-like echo structure at the storm’s right rear (left rear) flank, and often a bounded weak echo region (BWER) appearing at middle levels above the edge of the low-level reflectivity gradient, indicating the presence of both strong updraft and strong rotation around a vertical axis in its vicinity. Doswell and Burgess (1993) defined another important feature, a deep (several kilometers) mesocyclone. They described that the hook echo and other typical features were the direct results of the mesocyclonic (mesoanticyclonic) circulations of a supercell. On the other hand, in some cases no hook or BWER were detected in the supercells. It is possible that they existed but were not detected because of the width of the radar beam at this range (Nielsen-Gammon and Read, 1995).
Many authors studied the conditions favorable for development of right- moving or left-moving supercells. Numerical simulations made by Weisman and Klemp (1982, 1984) have shown that the environmental buoyancy and vertical shear of the environmental wind were important factors in determining the storm structure. The authors reported that the relationship between the storm type, the wind shear in the 0-6 km above-ground level (AGL) layer, and the buoyancy could be represented in the form of a bulk Richardson number (BRN). Weisman and Klemp (1984) found that supercells form when the BRN is low. Davies- Jones et al. (1990) suggested the use of storm-relative helicity (SRH) for estimation of the likelihood for supercell development. It was calculated for the lowest 3 km layer AGL. Rasmussen and Blanchard (1998) confirmed that SRH discriminated well the supercells and ordinary cells. The helicity (SRH) and instability (CAPE) are combined in energy helicity index (EHI), which performed well in forecasting supercells (Hart and Korotky, 1991; Rasmussen and Blanchard, 1998; Rasmussen, 2003).
Supercells often start with cluster splitting processes to account for hodograph curvature. According to Weisman and Klemp (1986), a moderate, unidirectionally sheared environment led to the development of symmetrically splitting supercells with the anticyclonic supercell moving left of the direction of
the midlevel wind and the cyclonic supercell moving right. When, in the Northern Hemisphere, the wind shear vector rotates clockwise with height, the right-moving storm is favored, and if the wind shear vector rotates counter clockwise, the left-moving storm is favored. In the typical supercells, developing in the Northern Hemisphere, which usually are right-moving, the rotation is mesocyclonic, while in the rare left-moving supercells the rotation is mesoanticyclonic (e.g., House et al., 1993; Nielsen-Gammon and Read, 1995;
Lindsey and Bunkers, 2005).
Its geographical location and diverse terrain characterize Bulgaria as one of the most thundery- and hail-stormy countries in Europe. It is a fact that during the last 10–15 years, the frequency and severity of hail storms and heavy rains increased. West Bulgaria is the region with the highest frequency of thunderstorms in the country (Bocheva et al., 2013), as well as other high- impact events including hailstorms, torrential precipitation, and severe convectively-induced wind storms (Zamfirov et al., 2014; Gospodinov et al., 2015; Bocheva and Simeonov, 2015).
In this paper, extreme convective thunderstorms which affected West Bulgaria on July 8, 2014 and caused significant damage in the towns and fields along their paths are presented. On that date, three supercells developed only for a period of six hours over Bulgaria, and two of them showed specific splitting behavior. The Doppler capability of the radars, data from which is used here, allowed their detection and analysis. Such cases of splitting hailstorms (left and right) over Bulgaria were firstly presented by Zamfirov et al. (2014).
2. Data and methods
The synoptic scale analysis is based on images provided by the NOAA/ESRL Physical Sciences Division, Boulder, Colorado from their website at http://www.esrl.noaa.gov/psd/ based on the National Centers for Environmental Prediction’s (NCEP) reanalysis of Kalnay et al., (1996), as well as on the archive of EUMETSAT satellite images, and data from meteorological network of the National Institute of Meteorology and Hydrology (NIMH). There has not been hailpad network in Bulgaria since 1990. Data from visual observations from nearby synoptic, climate, and rain-gauge stations of NIMH, as well as from rocket sites of the Hail Suppression Agency (HSA) are used in this study. The analysis of damage is based on information from the Monthly Bulletin of NIMH, reports of the national civil protection authority, local government authorities, media, and insurance companies. Upper-air sounding data from the15614 radiosonde stations of WMO (World Meteorological Organization) and the GFS (Global Forecast System) model of NOAA (National Oceanic and Atmospheric Administration) are also used.
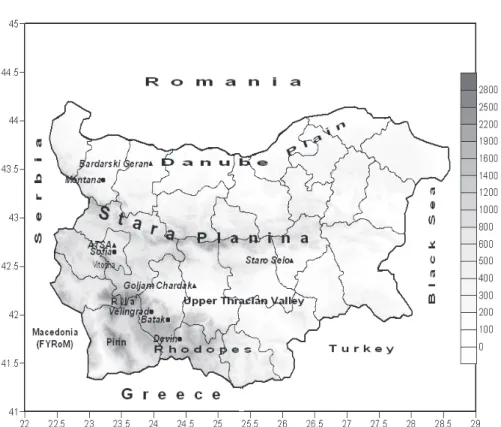
The analysis of the splitting process and the evolution of the convective cells rely on the S-band Doppler radars of HSA, equipped with IRIS (Interactive Radar Information System) software of Vaisala, and the C-band Doppler radars of the Bulgarian Air Traffic Services Authority (BULATSA), equipped with RAINBOW software. HSA operates three radars (in Bardarski geran, Vratsa district; Goljam chardak, Plovdiv district; and Staro selo, Sliven district), and the first two of them are used in this study (see Fig. 1). A full 150 km scan is made every 4 minutes with 14 elevations at degrees from near 0° to 85°. The BULATSA weather radar Meteor-360 AC is located near Sofia. It is a C-band Doppler radar with a range of 250 km and continuous operation. A full 250 km scan is made every 5 minutes using 13 elevations at degrees from near 0° to 40°.
In this study, the Advanced Research-Weather Research and Forecasting (WRF-ARW) model version 3.4.1, implemented in the National Center for Atmospheric Research (NCAR) and the NCEP of the United States, is used (NCEP, 2014).
Fig. 1. Map of Bulgaria with the names of cities, towns, radar locations (black triangles), and mountains mentioned in the text. Left axis – latitude in degrees; bottom scale – longitude in degrees; color scale – altitude in m.
3. General overview of severe convective events on July 8, 2014
3.1. Analysis of the large scale environment of the storms
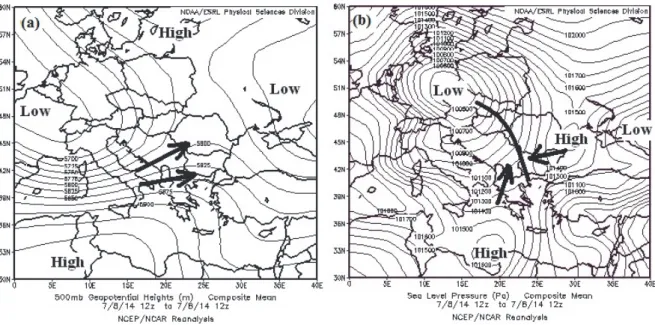
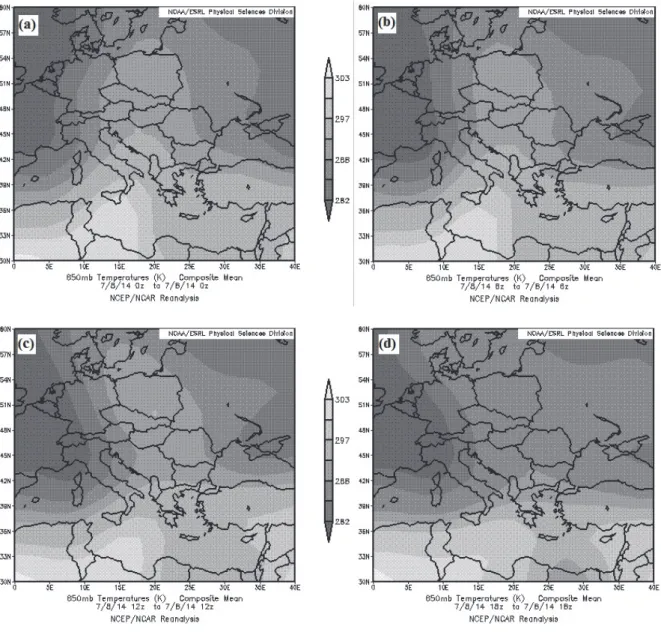
Bulgaria was in a saddle on July 8, 2014 between two lows to west and east and two highs to north and south (Fig. 2). The low to the northwest was associated with a cold air mass moving from west to east in the Western and Central Mediterranean. Thanks to the saddle circulation pattern in the middle troposphere (Fig. 2a), however, the flow was divergent in the region of Western Bulgaria and on the date of our interest. Near the surface, the northern high propagated to Eastern Bulgaria (Fig. 2b), which defined easterly or southeasterly winds in most of the country (Fig. 4b). At the ground level, the saddle was positioned exactly at the southeast corner of Bulgaria. Therefore, the southern high defined more southern winds in that region (Fig. 4b). These two features explained the convergence pattern in the lower troposphere at the time of the storms. Upper level divergence and lower level convergence were a precondition for strong convection. At the synoptic scale, the pattern resembled an occlusion which can be illustrated with the evolution of the temperature field at the 850 hPa level in Fig. 3. The warm-air tongue in Central and Southeastern Europe tended to close within the day which indicated occlusion-like dynamics in the region of Bulgaria.
Fig. 2. Synoptic scale patterns on July 8, 2014, 12:00 UTC: (a) geopotential height (m) at 500 hPa; (b) sea level pressure (Pa). Black arrows in (a) and (b) show the direction of the air flow over Bulgaria at the corresponding level. Black curve on map (b) shows the line of instability (or pseudo-occlusion). (Source: NOAA/ESRL Physical Sciences Division, Boulder Colorado; http://www.esrl.noaa.gov/psd/)
Fig. 3. Synoptic scale temperature (K) pattern at the 850 hPa level on July 8, 2014:
(a) 00:00 UTC; (b) 06:00 UTC; (c) 12:00 UTC; (d) 18:00 UTC. (Source: NOAA/ESRL Physical Sciences Division, Boulder Colorado; http://www.esrl.noaa.gov/psd/)
Fig. 4. (a) 24-hour accumulated precipitation amount (grey scale, mm) from 07:30 local time (LT) on July 8, 2014 to 07:30 LT on July 9, 2014. (b) Wind speed (length of the arrow, m s-1) and direction on July 8, 2014, 12:00 UTC; grey scale - terrain altitude.
Fig. 4a shows the precipitation pattern for the date. It illustrates how the storm systems did not manage to propagate much further than the central part of Bulgaria, where they tended to decay which can be seen in Fig. 5d. The most significant precipitation spots were in the western part of the country and were associated with the strongest phase of the storm systems on July 8. There were two distinctively separated precipitation patterns: one to the northwest of the country and another one to the south, in the West Rhodopes Mountain. This reflected the divergent leading upper flow. Fig. 4b represents the analysis of the 10 m wind at 12:00 UTC on July 8, right before the hail storm hit Sofia. The overall easterly or southeasterly winds in North and East Bulgaria are well visible. They are the result of the influence of the northeastern high-pressure center. In the southwestern corner of the country, one can notice the more southerly oriented winds. From one side, they were defined by the local orography and followed the principal axes of the river valleys in the region. But, from the other side, they experienced the influence of the southwestern high (Fig. 2b), which pulled the general wind direction from south.
3.2. Evolution of the storms
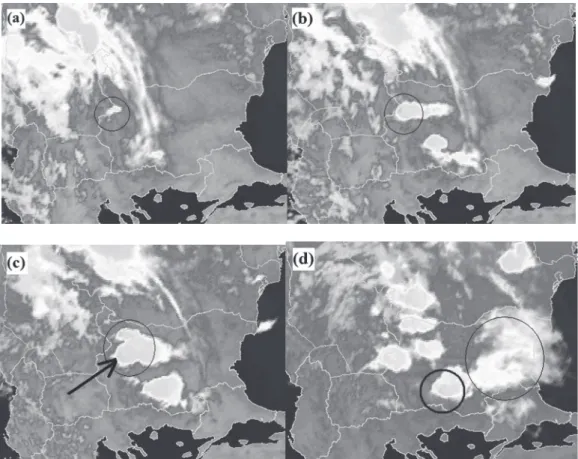
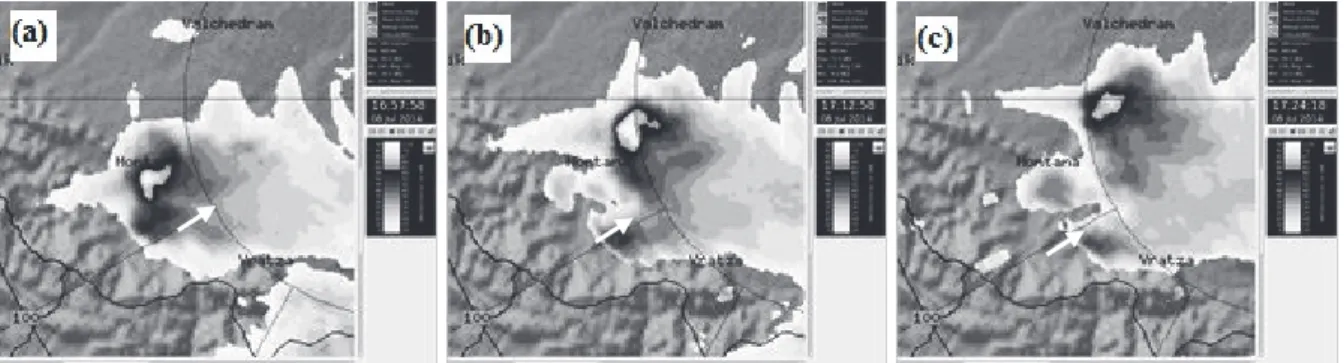
Fig. 5 illustrates the evolution of the analyzed storms from satellite perspective.
The thin black circles show the position of the analyzed hail storm system, which has hit Sofia, at its origin (a), growth (b), split (c), and decay (d). The thick black circle in (d) highlights the southern storm, which has hit Velingrad and Devin in the Rhodopes. Black arrow points to the position of the hailstorm over Sofia. The Sofia cloud first appeared near the western Bulgarian border at around 11:00 UTC (Fig. 5a). Then it strengthened by going eastwards (Fig. 5b) and split (Fig. 5c). The northern, left-moving storm went beyond Stara Planina (a mountain ridge) and hit the region of Montana. The southern, right-moving storm is the one which has later produced the severe hail fall in Sofia.
The northern and the southern storms dissipated later in the day (Fig. 5d), but others appeared behind them along the same storm line, stretching from the Rhodopes to the northwestern corner of Bulgaria, because the large scale conditions did not evolve significantly. In this later generation of convective storms, there was another significant one developing in South Bulgaria. It appeared first over Rila Mountain around and after 15:00 UTC (not shown) and moved in southeasterly direction to the West Rhodopes, which can be seen in Fig. 5d, where it hit Velingrad first and Devin later.
Fig. 5. Infrared satellite images on July 8, 2014: (a) 11:00 UTC; (b) 12:30 UTC;
(c) 13:30 UTC; (d) 17:00 UTC. (Source: NIMH archive of EUMETSAT satellite images.) Circles and arrow point to the location of the analyzed storms.
3.3. Aerological analysis of sounding data
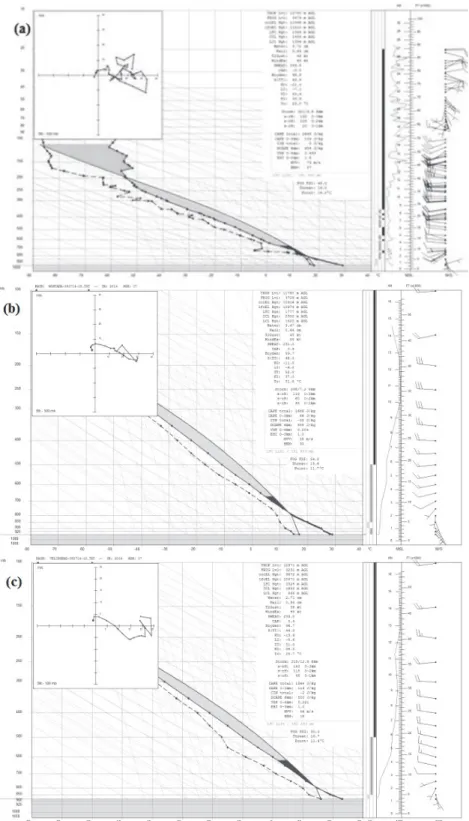
The most vigorous one of the three analyzed storms developed over Sofia, the capital city. The NIMH operates a WMO aerological station (number 15614) in Sofia, where the regular sounding takes place at 12:00 UTC. Therefore data from that sounding on July 8 was used to analyze the environment of the storm over Sofia (Fig. 6a). For the other storms, however (over Montana – Fig. 6b and over Velingrad – Fig. 6c), pseudo-sounding data at 15:00 UTC, derived from the operational GFS model, was used. Those storms were relatively far from Sofia (Fig. 1), and their strongest part was later than the time of the operational sounding at station 15614. The pseudo-sounding data is combined with real measured surface data from other synoptic stations nearby. The data were processed by the RAwinsonde OBservation (RAOB) sounding software. This approach had already been used in Simeonov et al. (2013). The height of the 0 ºC isotherm (freezing level), was found to be 3231 m for Velingrad, 3479 m for Sofia, and 3728 m for Montana. Stability and wind shear indices were calculated and analyzed (Table 1).
The lifted index (LI) for example points to strong instability. Its values are: -7.1 ºC for Sofia; –6.2 ºC for Montana; and –5.6 ºC for Velingrad. The values of CAPE are about 2648 J kg–1 for Sofia, 1686 J kg–1 for Montana, and 1564 J kg–1 for
Velingrad. These values, determined from surface parcels, suggested that the environment would support thunderstorms. The Total Totals (TT) index is higher than 50 and indicates a potential development of severe storms.
Fig. 6. Stuve diagramme, hodograph, and basic environmental characteristics on July 8, 2014 (processed by RAOB). Buoyant energy is shaded and the wind profile is illustrated at right in m s-1: (a) Sofia sounding – 12:00 UTC, (b) Montana sounding – 15:00 UTC, (c) Velingrad sounding – 15:00 UTC.
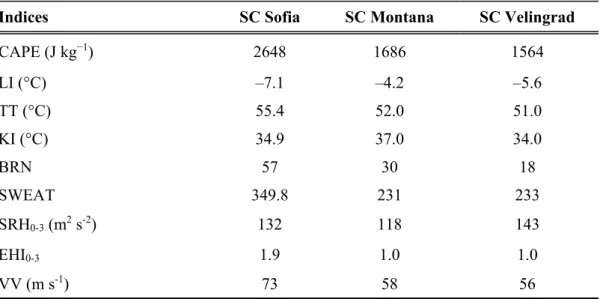
Table 1. Stability and wind shear indices for the three suppercells on July 8, 2014
Indices SC Sofia SC Montana SC Velingrad
CAPE (J kg−1) 2648 1686 1564
LI (°C) –7.1 –4.2 –5.6
TT (°C) 55.4 52.0 51.0
KI (°C) 34.9 37.0 34.0
BRN 57 30 18
SWEAT 349.8 231 233
SRH0-3 (m2 s-2) 132 118 143
EHI0-3 1.9 1.0 1.0
VV (m s-1) 73 58 56
The shapes (Fig. 6) of the wind hodograph in low levels (0–6 km) suggest a wind profile that would support rotating convection. The hodographs, corresponding to the environment of the left-moving storm over Montana and the right-moving storm over Velingrad, have typical supercell shapes (Weisman and Klemp, 1986) with tendency to be more linear above 2 km AGL. The curvature of the hodograph of the left-moving SC Montana turns clockwise (Fig. 6b). Similar cases of left-moving supercells, despite the shear vectors exhibiting clockwise curvature, were obtained and discussed by other authors (Grasso and Hilgendorf, 2001; Bunkers, 2002). The hodograph for the SC Sofia exhibits well pronounced clockwise curvature to 180 degrees in the lower 0–6 km (Fig. 6a). According to Weisman and Klemp (1986), significant shear magnitude and depth of the shear profile are sufficient to produce strong positive vertical pressure gradient force on the right flank of the initial updraft. It is fact, that after the splitting of the initial cell, the right flank evolved into a quasi- steady supercell (Sofia), which moved to the right of the mean winds, whereas the left flank evolved into a weak and short-lived cell. Wind shear indices BRN, SRH0-3, and EHI0-3 for layer 0–3 km AGL were calculated for the diagnosis of the supercell’s development (Table 1). The BRN indices were 57 m2 s–2 (SC Sofia), 30 m2 s–2 (SC Montana), and 18 m2 s–2 (SC Velingrad). The values of SRH0-3 for the environment of the three examined supercells were higher than the threshold of 100 m2 s–2 for supercell development (see Table 1). EHI0-3 has values between 0.6 (SC Montana) and 1.5 (SC Sofia). All indices, therefore, show an environment favoring supercell development. The calculated maximum vertical velocities are high (more than 55 m s–1). This indicates significant development of convective clouds topping above the equilibrium level (EL), with an attendant risk for heavy rain and hail.
4. Analysis of Doppler radar data of severe convective storms
4.1. Sofia supercell
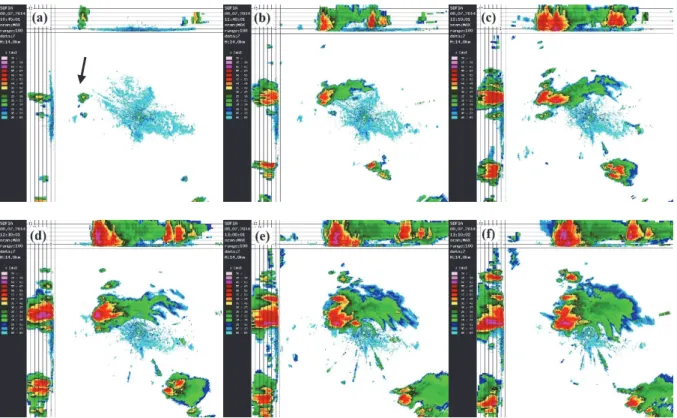
In the early afternoon, at 10:35 UTC, an isolated cell was first detected 70 km northwest of Sofia outside the territory of Bulgaria. The maximum radar reflectivity factor (Zmax) of the cell was 35 dBZ between 6 and 10 km (–12 °C and –40 °C, see – Fig. 7a). The cell developed rapidly and Zmax reached 50–55 dBZ at 10:50 UTC. During the period between 11:30 UTC and 12:10 UTC, new cells developed about 10 kilometers away from the first one, and a cluster formed. The new cells quickly merged in single storm (Figs. 7c, d), and the maximum radar reflectivity exceeded 60 dBZ. At 13:00 UTC, the storm split (Fig. 7e), producing a cyclonically rotating supercell (SC Sofia) moving to the right of the mean midlevel winds. It passed over Sofia and dissipated at 15:35 UTC out of the city. The second cell moved to the left of the mean midlevel winds. It had no severe development and dissipated 20 minutes after splitting.
Fig. 7. Formation and development of Sofia supercell based on maximum radar reflectivity obtained by C band radar, located at Sofia airport: (a) at 10:45 UTC, the cell is showed by an arrow ; (b) at 11:40 UTC; (c) at 12:10 UTC; (d) at 12:30 UTC;
(e) at 13:00 UTC; (f) at 13:10 UTC.
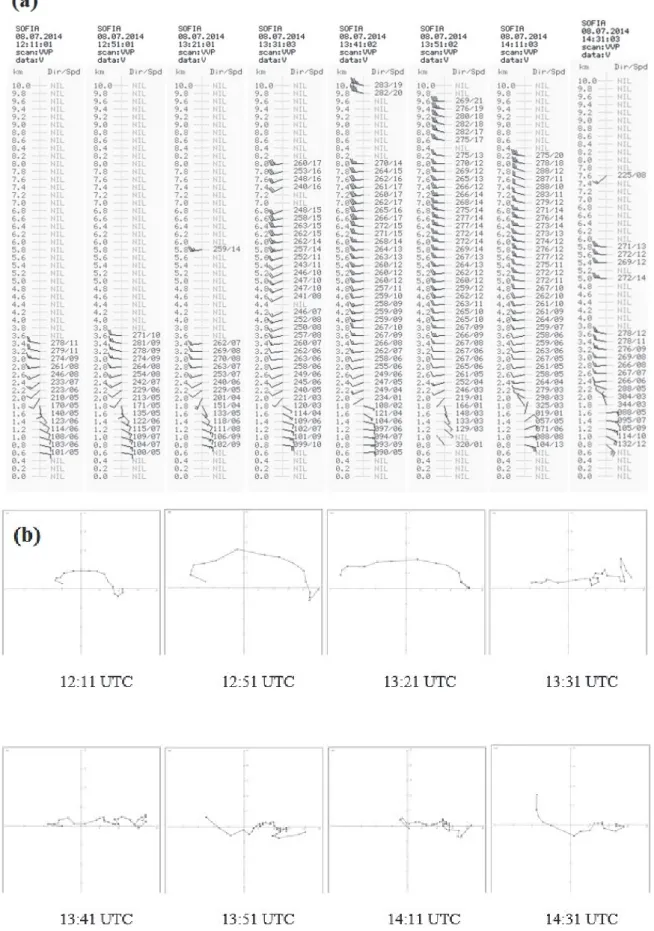
The vertical wind pattern was analyzed by using the VVP (velocity volume processing) product in time between 12:11 UTC and 14:31 UTC. The analysis showed a low-level backing of the wind, implying a clockwise turning of the hodograph and confirmed the possibility of right-moving thunderstorms (Fig. 8a) (Klemp and Wilhelmson, 1978; Nielsen-Gamon and Read, 1995).
Detailed analysis of the hodograph plot by RAOB (Fig.8b) showed that before 13:00 UTC, when the storm had split, the hodograph had well pronounced clockwise curvature to 180 degrees in the lower 2.2 km with growth of the magnitude and the depth of the shear profile. During the period of severe hail (13:31 UTC – 14:11 UTC), the hodograph changed its form to approximately straight line.
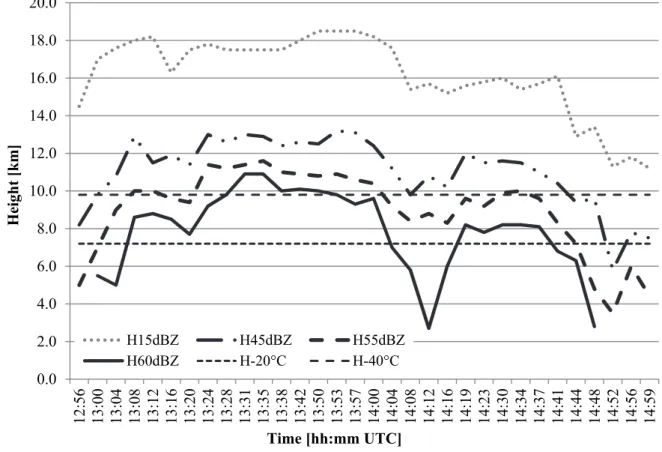
Immediately after splitting, the area of radar reflectivity factor of 60 dBz reached a height of over the –20 °C isotherm, held for next 90 minutes (Figs. 9 and 10a), and it was wide more than 30 km2 (not shown). According to Blair et al. (2011), this is a criterion for the existence of giant hailstones. According to meteorological stations reports, the observed size of hailstones on ground in Sofia was more than 5 cm.
The storm severity and the presence of large hail stones were confirmed by VIL (vertical integrated liquid) and VILD (VIL density) value. VIL values exceeded 65 mm and lasted for 1 hour and 40 minutes (13:04 UTC – 14:44 UTC). The high values of VIL indicate that the storm had high reflectivity distributed over a large depth of the atmosphere, and that it is a good indicator for the potentiality of severe weather (Nielsen-Gamon and Read, 1995; Edwards and Thompson, 1998). In the same time, VILD (Amburn and Wolf, 1997) had values higher than 3 g m–3 which is the severe hail (> 2 cm) threshold obtained for Bulgaria (Dimitrova et al., 2013).
The strongest development of SC Sofia was between 13:30 UTC and 14:05 UTC, when the maximum reflectivity was 70 dBZ and the echo top (15 dBZ) was between 17 km and 18 km. The southeast end of SC Sofia became comma- head shaped at 13:50 UTC (Fig. 10b).
Fig. 8. Wind profiles of the supercell propagation during the period 12:11 UTC - 14:31 UTC, obtained by C band radar, located at Sofia airport: a) "raw" wind data b) a plot of a series of hodographs by RAOB.
Fig. 9. Time series of radar reflectivity factors during the lifetime of SC Sofia.
H15 − height of area of 15 dBZ radar reflectivity; H45 − height of area of 45 dBZ radar reflectivity; H55 − height of area of 55 dBZ radar reflectivity; H60 − height of area of 60 dBZ radar reflectivity; H-20 °C – height of -20 °C isotherm; H-40
°C – height of -40 °C isotherm. The radar data are obtained by S band radar.
Fig. 10. A PPI (at 1.7° elevation) reflectivity image of SC Sofia during its maximum development, obtained by S band radar a) at 13:39 UTC (16:39 LT); b) at 13:50 UTC (16:50 LT).
0.0 2.0 4.0 6.0 8.0 10.0 12.0 14.0 16.0 18.0 20.0
12:56 13:00 13:04 13:08 13:12 13:16 13:20 13:24 13:28 13:31 13:35 13:38 13:42 13:50 13:53 13:57 14:00 14:04 14:08 14:12 14:16 14:19 14:23 14:30 14:34 14:37 14:41 14:44 14:48 14:52 14:56 14:59
Height [km]
Time [hh:mm UTC]
H15dBZ H45dBZ H55dBZ
H60dBZ H-20°C H-40°C
The extreme hail event, accompanied with strong wind gust, heavy rain, and high lightning frequency was registered between 13:30 UTC and 14:00 UTC. The giant hailstones had diameter up to 10 cm and irregular shape.
TBSS (three body scattering signature) was observed (Fig. 7f) during the period between 13:00 UTC and 13:30 UTC. Such cases have been analyzed in detail by Lemon (1998), who suggested that it could be expected that hail stones equal to or greater than 2.5 cm in diameter would reach the surface within the next 10–30 min. In confirmation of these conclusions, in our case, the TBSS appeared 30 minutes before the registration of severe hail on the ground.
Thunderstorm mesocyclone is manifested on Doppler velocity scans. The rotation was evident between 4 and 6.5 km height (Fig. 11a). In the southeastern part of the rotation core, radial velocities of –13 m s–1 (towards the radar) and on the opposite side, radial velocities of +13 m s–1 (outwards) were observed. Higher values could have been expected, but these are the maximum that the radar can detect. The registered values of the horizontal wind shear (combination of the so- called radial shear and the azimuthal shear) were above 14 m s−1 km−1. In accordance with Holleman (2008), these values exceeded the threshold of 8 m s−1 km−1, determined by the author, which suggested the existence of a microburst (indicated by an arrow in Fig. 11b). Many uprooted and/or broken trees in Sofia bring evidence of strong surface winds by the microburst.
Fig. 11. (a) CAPPI 5.9 km of Doppler velocity of SC Sofia at 13:38 UTC (16:38 LT). A zoom image of mesocyclon rotation is given in the right corner of the images. (b) A horizontal wind shear at 0.2° elevation of SC Sofia at 13:57 UTC (16:57 LT).
4.2. Montana supercell
Left of SC Sofia, a new cell formed and developed as supercell (noted as SC Montana) moving to the left of the mean midlevel winds and characterized by anticyclonic rotation. Its first registration was at 13:00 UTC and, like for SC
Sofia, the first radar echo with maximum radar reflectivity 25 dBZ was between the heights of 5 km and 10 km, where the temperature reached –35 °C (Fig. 12a). By analogy with SC Sofia, the convective cell had strong development. At 13:23 UTC, the height of the area with 45 dBZ was above 10 km, and the maximum radar reflectivity was 55 dBZ. In Fig. 12b it can be seen, that within the radar range of 150 km, there were only two supercells - SC Sofia and SC Montana. SC Sofia moved southeast and SC Montana moved northeast. At 14:00 UTC, SC Montana split and its left-oriented part acquired supercell structure (Fig. 13). The right-moving cell had short life time and reached maximum reflectivity of 50 dBZ only. The left-moving supercell had lifetime of more than 4 hours.
Fig. 12. (a) SC Montana thunderstorm formation at 13:00 UTC (16:00 LT) – showed by an arrow. A radar vertical cross section of the cell is given in the right corner of the image. (b) Maximum radar reflectivity image of the coexistence of SC Sofia and SC Montana at 13:46 UTC (16:46 LT).
Fig. 13. Maximum radar reflectivity during the Montana storm splliting: (a) at 14:01 UTC (17:01 LT) ; (b) at 14:12 UTC (17:12 LT); (c) at 14:24 UTC (17:24 LT). The second weaker cell is showed by an arrow.
SC Montana
SC Sofia
The left-moving supercell was characterized by long lifetime of severe stage.
At 13:38 UTC, radar reflectivity above 60 dBZ was registered and was kept above that level for the next 90 minutes. In the 10 minutes following the splitting at 14:00 UTC, the maximum radar reflectivity factor increased sharply and reached a maximum value of 74.5 dBZ at 14:12 UTC. The height of the area of 55 dBZ was above 12 km and that of the area of 60 dBZ – above 10 km. The area of radar reflectivity factor of 60 dBZ reached 30 km2 (not shown) at height above –20 °C and lasted more than 30 minutes (Fig. 14). VIL increased rapidly between 13:00 UTC and 13:28 UTC, and its values were higher than 65 mm for about 1 hour. Between 13:44 UTC and 14:52 UTC, VILD was higher than3.0 g m–3. In the same time, the registered hailstones on the ground had size larger than 2.5 cm.
Fig. 14. Time series of the radar reflectivity factor during the lifetime of SC Montana.
H15 − height of area of 15 dBZ radar reflectivity; H45 − height of area of 45 dBZ radar reflectivity; H55 − height of area of 55 dBZ radar reflectivity; H60 − height of area of 60 dBZ radar reflectivity; H-20 °C – height of -20 °C isotherm; H-40 °C – height of -40 °C isotherm. The radar data are obtained by S-band radar.
The TBSS appeared at 13:31 UTC, 20 minutes before hail registration on the ground and 44 minutes before severe hail registration on the ground. The flare was observed for 80 minutes, and its length reached more than 40 km
0.0 2.0 4.0 6.0 8.0 10.0 12.0 14.0 16.0 18.0 20.0
12:52 13:00 13:08 13:16 13:24 13:32 13:40 13:48 13:56 14:04 14:12 14:20 14:28 14:36 14:44 14:52 15:00 15:08 15:16 15:24
Height [km]
Time [hh:mm, UTC]
H15dBZ H45dBZ H55dBZ H60dBZ H-20 H-40
(Fig. 15a). TBSS is associated with Non-Rayleigh scattering from large, wet hailstones, whose diameter to wavelength ratio is greater than 1/16th of the radar wavelength (Lemon, 1998; Zrnić, 1987). On the other hand, the large area of 60 dBZ and high horizontal gradients (12 dBZ per 1 km) at the northern end of the storm led to a sidelobe spike emergence at 13:38 UTC, 20 minutes before the severe hailfall on the ground (Fig. 15a). According to Manros et al., 2010, sidelobe contamination in radar data occurs when there are strong horizontal (or vertical) gradients of reflectivity, on the order of 40 dB per 1 degree. This type of gradient is usually connected with strong thunderstorms capable of producing hail. Тhe presence of the artefacts (TBSS and sidelobe spike), each having different origin, confirms the theory that they can be linked to the existence of large hailstones. Between 13:52 UTC and 14:54 UTC, during their registration, the hail stones size reached 6 cm (information from rocket sites of HSA).
Fig. 15. (a) Maximum radar reflectivity of SC Montana with TBSS and sidelobe observation at 14:16 UTC (17:16 LT). A radar vertical cross section of the cell is given in the right corner of the images. (b) PPI at 4.5° elevation of Doppler velocity of SC Montana at 14:17 UTC (17:17 LT). A zoom image of mesoanticyclon rotation is given in the right corner of the image. Radar information is given by S-band radar.
During the period of maximum development of SC Montana, the analysis of Doppler velocity showed anticyclonic rotation. It was observed for 10 minutes. Evidence of rotation can be found at the levels between 5 and 7 km (Fig. 15b). The southern side of the hail core (viewed by the radar) had Doppler velocities away from the radar, while the northern side of the hail core had Doppler velocities toward the radar. The SC Montana is the first documented case of anticyclonically rotating core of supercell developed over Bulgaria. The
Sidelobe
TBSS
vigorous development of the cell accompanied by high updraft velocity is confirmed by the fact, that the speeds in the center of the core are close or equal to zero (Fig. 15b). This conclusion is based on the relationship between the Doppler radial velocities in the TBSS area, the storm core, the vertical velocities associated with hydrometeors (Zrnić, 1987; Carbunaru et al., 2010), and the presence of high positive Doppler velocity in the beginning of TBSS.
4.3. Velingrad supercell
Another squall line formed at 15:10 UTC to the southeast of the dissipated SC Sofia (Figs. 16a, b). At 15:50 UTC, one of the cells of that squall line developed rapidly and evolved into a supercell (SC Velingrad). Its lifetime was more than two hours (Fig. 16c).
The cell had smaller area than the other two supercells, but kept high values of other radar characteristics and had recognizable features of supercell.
VIL increased rapidly from values of 38 mm to 62.5 mm (not shown) at 15:56 UTC and kept values higher than 60 g m–3 during the period of 16:00–
17:30 UTC. In the same time, the maximum radar reflectivity was higher than 60 dBZ with height above –20 °C. The maximum registered value of radar reflectivity was 70 dBZ. The values of VILD were higher than 3.0 g m–3 pointing to the existence of severe hail (Dimitrova et al., 2013). The supercell had cyclonic rotation (Fig. 17a). A mesocyclone was observed at the levels between 5.5 km and 6.5 km. TBSS was registered and lasted 35 minutes (Fig. 17b). Due to the passage of the cell over a mountainous area, there was no information of the size of hailstones based on ground observation. Bearing in mind the high values of the radar characteristics, it could have been expected to have hailstones larger than 2 cm.
Fig. 16. Formation and development of Velingrad thunderstorm (a) at 10:45 UTC, the storm is showed by an arrow ; a) at 15:03 UTC (18:03 LT); (b) at 15:36 UTC (18:36 LT);
(c) at 16:12 UTC (19:12 LT) when supercell was formed (showed by an arrow). Radar information is obtained by S-band radar.
Fig. 17. (a) Maximun radar reflectivity of SC Velingrad with TBSS observation at 17:00 UTC (20:00 LT). (b) PPI at 7.0° elevation of Doppler velocity of SC Velingrad at 17:01 UTC (20:01 LT). A zoom image of the mesocyclon rotation is given in the left corner of the image. Radar information is given by S-band radar.
5. Model simulation
This section deals with numerical simulations of the supercells. 24-hour simulations were carried out with initial conditions at 00:00 UTC on July 8, 2014. In the first six hours, the model fields were spin-upped. The time frame of interest was between 13:00 and 16:00 UTC.
The initial and boundary conditions for air temperature, wind speed, humidity, pressure, and total cloud cover were taken from the operational GFS distributed by the NCEP with a spatial resolution of 0.5°. The model configuration uses the non- hydrostatic approximation. The model domain is resolved by a grid in Lambert conformal projection with three nests, correspondingly with a spatial resolution of 15:5:1.8 km. The two-way nesting technique is used for better boundary conditions.
The domain covers Bulgaria and adjacent regions, and the third domain with the finest resolution is selected in a way to cover the mountain chains in the western part of the country, and the center is located in Sofia, where atmosphere sounding is performed every day at 12:00 UTC. The vertical coordinate system is sigma terrain-following, with 65 levels. Several numerical experiments are performed to configure and tune the model parameters in order to obtain adequate mode results.
The most important parameters are related to the parameterization of the sub-grid physical processes (Penchev. and Peneva, 2013). The following parameterization schemes are used in the model:
• for microphysical processes in the clouds: WRF Double-Moment 6 class scheme (Lim and Hong, 2010),
• longwave radiation processes: RRTM (Rapid Radiative Transfer Model) (Mlawer et al., 1997),
• shortwave radiation processes: Dudhia scheme (Dudhia, J., 1989), TBSS
• air-surface exchange processes: Noah Land-Surface Model,
• planetary boundary layer parameterization: Yonsei University scheme, and
• convective processes parameterization: Kain-Fritsch scheme (Kain, 2004). This scheme is used only in the first and second domains, and in the third domain, where resolution is 1.8 km, the convection is not parameterized.
The aerological diagram (not shown), calculated by the WRF model, shows the presence of wind shear in the layer at altitude of about 2 km, a not very well defined layer of dry air, and a layer, in which the presence of significant CAPE can be expected. The analysis of some convective parameters such as CAPE and CIN (convective inhibition) (Fig. 18) indicates, that in the afternoon of July 8, in the western part of Bulgaria, the weather conditions were unstable with CAPE more than 1300 J kg–1 and CIN close to 0 m2 s–2. The combination of both parameters shows that the best conditions for convection were in the period between 11:00 UTC and 14:00 UTC.
Fig. 18. CAPE and CIN time series based NWP model calculations for Sofia.
Evidences for the presence of deep convection was the development of three convective cells – two of them north of Sofia and one over Rhodope Mountains, as shown on the image of maximum 10 cm radar reflectivity field (Fig. 19a).
Fig. 19. a) Modeled radar reflection in dBz, for wavelength of 10 cm, combined with the field of wind of 500hPa; b) elevation of the reflection on AB axis, combined with the field of wind in the vertical plane of the section (wind barbs show the direction of movement vertically and horizontally).
In the simulation, SC Sofia is shifted northeastwardly and the impact of hydrometeors in the simulated radar image was lower than the observed one.
The model convection occurred with an about two-hour delay. Well-developed cells appear at 15:00 UTC and lasted until 19:00 UTC, when they were still about 50 dBz. As the observed phenomena were commensurate with the resolution of the model, the latter failed to completely simulate the evolution of the formation of the first supercell. However, the numerical model successfully generated the convective phenomena, but with less intensity. For example, the amount of rain fallen for one hour in the period of maximum development of supercell did not exceed 8 mm. Also, the measured vertical speeds in the areas with maximum impact reached 17 m s–1. The motion of SC Sofia and the shape of its radar reflectivity are shown in Fig. 19b. This corresponds very well to the convective events observed in the late afternoon on this day near Sofia.
6. Analysis of damage data
The giant hail stones in Sofia had diameter up to 10 cm size and irregular shape.
The hail path was about 30 km long and more than 10 km wide and passed trough the central parts of the city. According to the meteorological station data, the duration of continuous hail was about 20 min and the measured precipitation amount during the process was above 35% of the monthly normal. The severe hail with rain and very strong wind (wind gust up to 23 m s–1) caused substential damage to infrastructure, buildings, and vehicles. More than 40 people were injured by hail stones or colaterally broken windows in Sofia. One man was
killed by a falling tree. In Sofia alone, the reported damage was worth more than 123 million euro according to data from insurance companies (Viktor et al., 2015).
The hail stones in the region of Montana were sized from walnut to egg, and the duration of the hailfall was about 13 min. The hail storm stroked 4 municipalities in the district of Montana. The severe hail with torrential rain and strong wind (wind gust 17–20 m s–1) caused damage to infrastructure, roofs, vehicles, and agriculture. More than 45% of corn crops, vegetables, and fruits were destroyed in fields and villages in the region. About 10 villages were left without electric supply for more than 12 hours after the storm. Many houses were flooded.
There is less available data for damage related to the passage of the third storm over the Western Rhodopes. This is mainly due to the sparse network of weather stations and the small number of settlements in the area. The peak of the storm was over the mountainous woodland. Nevertheless, the hailstorm was registered by three meteorological stations (rain gauges) in the region. There were also a few damage reports from Devin, where heavy rain (30 mm per 2 hours) caused local floods.
7. Conclusions
This study shows the splitting of convective cells over West Bulgaria on July 8, 2014, which was detected on S-band and C-band Doppler radar and satellite images. Three supercell storms formed and developed over Bulgaria on that day.
One of them (over Montana) exhibited anticyclonic rotation.
Thermodynamic analysis showed high instability of the atmosphere on July 8, 2014. CAPE reached extreme instability values (CAPE > 2500 J kg–1) pointing to strong updraft – a precondition for severe hail formation. Highly negative LI (between –5.6 ºC and –7.1 ºC) conformed to the same conclusion.
Wind shear indices were in line with the existence and evolution of the supercells. The BRN index was 57 m2 s–2 (SC Sofia), 30 m2 s–2 (SC Montana), and 18 m2 s–2 (SC Velingrad). The values of SRH0-3 concerning the environments of the three examined supercells were higher than the threshold of 100 m2 s–2 for the supercell development. The shapes of wind hodographs at low levels of 0–6 km matched a wind profile that would support rotating convection.
The radar signatures illustrated, that during the hailfall, VIL was greater than 65 mm and was linked to reflectivity larger than 65 dBZ near the surface.
The area of radar reflectivity factor of 60 dBz reached a height higher than the –20 °C isotherm and lasted for 90 minutes, which confirms the criterion of Blair et al. (2011) for the existence of giant hailstones. Hailstones with sizes up to 10 cm of diameter were registered. VILD had values higher than 3 g m–3, which is the threshold for severe hail obtained for Bulgaria (Dimitrova et al., 2013).
They lasted for more than 1 hour. TBSS was observed about 30 minutes before severe hail fell on ground in all of the 3 analyzed supercell cases. The values of the horizontal wind shear (combination of the so-called radial shear and the azimuthal shear) for the Sofia supercell were above 14 m s−1 km−1. These values exceeded the threshold of 8 m s−1 km−1 (Holleman, 2008), for the existence of microburst.
The hailstorm of July 8, 2014 in Sofia has been the strongest in terms of both duration and strength for the last 75 years – according to national weather- data archives. The damage to infrastructure, buildings, and vehicles was extreme. One man was killed by a falling tree. The insurance claims, after the Sofia hailstorm, were worth more than 120 million Euros.
The WRF-ARW numerical model successfully simulated the convective processes, but, because of the lower intensity of the dynamic processes in the model, the convective flows formed slowly, and this resulted in a delay of the formation of the simulated convection cells, which also had lower intensity compared to the real ones. Due to the small size of the initial convective cells, the model failed to simulate well the initial stages of their evolution.
References
Amburn, S.A. and Wolf, P.L., 1997: VIL density as a hail indicator. Weather Forecast. 12, 473–478.
https://doi.org/10.1175/1520-0434(1997)012<0473:VDAAHI>2.0.CO;2
Blair, S., Deroche, D., Boustead, J., Leighton, J., Barjenbruch, B., and Gargan, W., 2011: A Radar-Based Assessment of the Detectability of Giant Hail, E-J. Severe Storms Meteorol. 6, 7, 1–30.
Bocheva, L., Simeonov, P., and Marinova T., 2013: Variations of thunderstorm activity in non- mountainous regions of Bulgaria (1961 – 2010). BJMH 18, 38-47.
Bocheva L. and Simeonov P., 2015: Spatio-temporal variability of hailstorms for Bulgaria during the period 1961–2010. 15th International Multidisciplinary Scientific GeoConference SGEM 2015, ISBN 978-619-7105-38-4 / ISSN 1314-2704, June 18-24, 2015, Book4, 1065–1072.
Browning, K.A., 1977: The structure and mechanics of hailstorms, Hail: A Review of Hail Science and Hail Suppression. Meteorol. Monogr., No 38, Amer. Meteorol., Soc., 1–43.
Bunkers, M.J., 2002: Vertical wind shear associated with left-moving supercells. Weather Forecast 17, 845–855. https://doi.org/10.1175/1520-0434(2002)017<0845:VWSAWL>2.0.CO;2
Carbunaru, D.V., Burcea S., Sasu, M., Antonescu B., and Bell, A., 2010: Three Body Scatter Signature climatology in Romania. ERAD 2010 - The sixth European conference on radar in meteorology and hydrology.
Davies-Jones, R., Burgess, D., and Foste,r M., 1990: Test Of Helicity As A Tornado Forecast Parameter. Preprints, 16th Conf. on Severe Local Storms, Kananaskis Park, Alberta, Canada, Amer. Meteor. Soc., 588–592.
Dimitrova, Ts., Mitzeva, R., Pisarova, Y., Betz, H.D., and Peneva, E., 2013: Relationship between lightning characteristics and radar estimated parameters during pre-severe and severe stages of hail producing thunderstorms developed over Bulgaria. 7th European Conference on Severe Storms (ECSS2013), 3–7 June, Helsinki, Finland.
Doswell, C.A. III and Burgess, D.W., 1993: Tornadoes and tornadic storms: A review of conceptual models. In (Eds. Church et al.) The Tornado: Its Structure, Dynamics, Prediction, and Hazards Amer. Geophys. Union, Geophys. Monogr. 79, 161–172.
Dudhia, J., 1989: Numerical study of convection observed during the Winter Monsoon Experiment using a mesoscale two–dimensional model. J. Atmos. Sci. 46, 3077–3107.
https://doi.org/10.1175/1520-0469(1989)046<3077:NSOCOD>2.0.CO;2
Edwards, R. and Thompson, R., 1998: Nationwide Comparisons of Hail Size with WSR-88D Vertically Integrated Liquid Water and Derived Thermodynamic Sounding Data, Weather Forecast. 13, 277–285.
https://doi.org/10.1175/1520-0434(1998)013<0277:NCOHSW>2.0.CO;2
Gospodinov, I., Dimitrova, Ts., Bocheva, L., Simeonov, P., and Dimitrov, R., 2015: Derecho-like event in Bulgaria on 20 July 2011. Atmos. Res. 158, 254–273.
https://doi.org/10.1016/j.atmosres.2014.05.009
Grasso, L.D. and Hilgendorf, E.R., 2001: Observations of a severe left moving thunderstorm. Weather Forecast. 16, 500–511.
https://doi.org/10.1175/1520-0434(2001)016<0500:OOASLM>2.0.CO;2
Hart, J.A., and Korotky, W. 1991: The SHARP workstation v1.50 users guide. National Weather Service, NOAA, U.S. Department of Commerce.
Holleman, I., 2008. Wind observations with Doppler weather radar. TECO-2008 — WMO Technical Conference on Meteorological and Environmental Instruments and Methods of Observation, St.
Petersburg, Russian Federation, 27–29 November 2008.
http://www.wmo.int/pages/prog/www/IMOP/publications/IOM-96_TECO- 2008/P1(28)_Holleman_Netherlands.pdf
House, R.A, Schmid, W., Fovell, R.G., and Schiesser, H., 1993: Hailstorms in Switzerland: Left Movers, Right Movers, and False Hooks, Month. Weather Rev. 121, 3345–3370.
https://doi.org/10.1175/1520-0493(1993)121<3345:HISLMR>2.0.CO;2
Kain, J.S., 2004: The Kain–Fritsch convective parameterization: An update. J. Appl. Meteor., 43, 170–
181. https://doi.org/10.1175/1520-0450(2004)043<0170:TKCPAU>2.0.CO;2
Kalnay, E., Kanamitsu, M., Kistler, R., Collins, W., Deaven, D., Gandin, L., Iredell, M., Saha, S., White, G., Woollen, J., Zhu, Y., Chelliah, M., Ebisuzaki, W., Higgins, W., Janowiak, J., Mo K.C., Ropelewski, C., Wang, J., Leetmaa, A., Reynolds, R., Jenne, R., and Joseph, D., 1996: The NCEP/NCAR Reanalysis 40-year Project. Bull. Amer. Meteor. Sosc 77, 437–471.
https://doi.org/10.1175/1520-0477(1996)077<0437:TNYRP>2.0.CO;2
Klemp, J. and Wilhelmson, R., 1978: Simulations of right- and left-moving storms produced through storm splitting. J. Atmos. Sci. 35, 1097–1110.
https://doi.org/10.1175/1520-0469(1978)035<1097:SORALM>2.0.CO;2
Lemon L., 1998: The Radar ‘‘Three-Body Scatter Spike’’: An Operational Large-Hail Signature, Weather Forecast. 13, 327–340.
https://doi.org/10.1175/1520-0434(1998)013<0327:TRTBSS>2.0.CO;2
Lindsey, D.T., and Bunkers, M.J., 2005: Observations of a severe, left-moving supercell on 4 May 2003. Month. Weather Rev. 20, 15–22. https://doi.org/10.1175/WAF-830.1
Lim, K.–S.S. and Hong, S.–Y., 2010: Development of an effective double–moment cloud microphysics scheme with prognostic cloud condensation nuclei (CCN) for weather and climate models.
Month. Weather. Rev. 138, 1587–1612. https://doi.org/10.1175/2009MWR2968.1
Manros K., Ortega К., and Pietrycha А., 2010: Examining radar 'sidelobe spikes' for severe hail identification. https://ams.confex.com/ams/pdfpapers/175930.pdf
Mlawer, Eli. J., Steven. J. Taubman, Patrick. D. Brown, M.J. Iacono, and S. A. Clough, 1997:
Radiative transfer for inhomogeneous atmospheres: RRTM, a validated correlated–k model for the longwave. J. Geophys. Res. 102, 16663–16682. https://doi.org/10.1029/97JD00237
NCEP, 2014: User’s Guide for the ARW WRF Modeling System Version 3.5
http://www2.mmm.ucar.edu/wrf/users/docs/user_guide_V3.5/ARWUsersGuideV3.pdf
Nielsen-Gammon, J. and Read, W., 1995: Detection and Interpretation of Left-Moving Severe Thunderstorms Using the WSR-88D: A Case Study, Weather Forecast. 10, 127–140.
https://doi.org/10.1175/1520-0434(1995)010<0127:DAIOLM>2.0.CO;2
Penchev R., Peneva E, 2013: Numerical simulation of extreme convective events during 2012 in Bulgaria using the weather forecast model WRF, Proceedings of the 2nd National Congress in Physical Sciences, 25-29 September 2013, Sofia (in Bulgarian)
http://optics.phys.uni-sofia.bg/disk_CONGRESS/html/pdf/S0751.pdf
Rasmussen, E.N., 2003: Refined supercell and tornado forecast parameters. Weather Forecast. 18, 530–535. https://doi.org/10.1175/1520-0434(2003)18<530:RSATFP>2.0.CO;2
Rasmussen, E.N., and Blanchard, D.O., 1998: A Baseline Climatology Of Sounding-Derived Supercell And Tornado Forecast Parameters. Weather Forecast. 13, 1148–1164.
https://doi.org/10.1175/1520-0434(1998)013<1148:ABCOSD>2.0.CO;2
Simeonov P., Bocheva L., and Gospodinov I., 2013: On space-time distribution of tornado events in Bulgaria (1956-2010) with brief analyses of two cases. Atmos.Res. 123, 61–70.
https://doi.org/10.1016/j.atmosres.2012.07.003
Viktor E., Reese S., and Zimmerli P., 2015: Hail losses under the microscope - Comparing losses from three major hail events of the recent past. 8th European Conference on Severe Storms, 14-18 September 2015, Wiener Neustadt, Austria
http://meetingorganizer.copernicus.org/ECSS2015/ECSS2015-19.pdf
Weisman, M.L. and Klemp, J.B., 1982: The dependence of numerically simulated convective storms on vertical wind shear and buoyancy. Mon. Weather Rev. 110, 504–520.
https://doi.org/10.1175/1520-0493(1982)110<0504:TDONSC>2.0.CO;2
Weisman, M. L, and Klemp, J.B., 1984: The structure and classification of numerically simulated convective storms in directionally varying wind shears. Mon. Weather Rev. 112, 2479–2498.
https://doi.org/10.1175/1520-0493(1984)112<2479:TSACON>2.0.CO;2
Weisman, M.L. and Klemp, J.B., 1986: Characteristics of isolated convective storms. In (Ed. P.S. Ray) Mesoscale Meteorology and Forecasting. Amer. Meteor. Soc., 331–358
https://doi.org/10.1007/978-1-935704-20-1_15
Zamfirov I., Georgiev Ch.G., and Stotanova, J., 2014: Case study of two splitting hailstorms over Bulgaria on 20 May 2013. ERAD 2014 – The Eight European Conference on Radar in Meteorology and Hydrology.
http://www.pa.op.dlr.de/erad2014/programme/ExtendedAbstracts/053_Zamfirov.pdf
Zrnić, D., 1987: Three-body scattering produces precipitation signature of special diagnostic value.
Radio Sci. 22, 76–86. http://ready.arl.noaa.gov/READYamet.php