DOI:10.28974/idojaras.2018.4.4
IDŐJÁRÁS
Quarterly Journal of the Hungarian Meteorological Service Vol. 122, No. 4, October – December, 2018, pp. 409–432
Rainfall erosivity and extreme precipitation in the Netherlands
Tin Lukić1,2, Biljana Basarin1, Tanja Micić1, Dajana Bjelajac1*, Tiemen Maris1,3, Slobodan B. Marković1, Dragoslav Pavić1,
Milivoj B. Gavrilov1, and Minučer Mesaroš1
1Faculty of Sciences, University of Novi Sad,
Department of Geography, Tourism and Hotel Management, Trg Dositeja Obradovića 3, 21000 Novi Sad, Serbia;
2Faculty of Geography, University of Belgrade, Studentski trg 3/3, 11000 Belgrade, Serbia
3Nijmegen School of Management, Radboud University, Heyendaalseweg 141 6525 AJ Nijmegen, The Netherlands
Corresponding author E-mail: dajana.bjelajac92@gmail.com (Manuscript received in final form October 10, 2017)
Abstract⎯ In order to assess the rainfall erosivity of the Netherlands, several parameters which describe distribution, concentration, and variability of precipitation were used (the annual amount of precipitation, the precipitation concentration index and the modified Fournier index), as well as eleven extreme precipitation indices (maximum1-day precipitation amount, maximum 5-day precipitation amount, simple daily intensity index, number of heavy precipitation days, number of very heavy precipitation days, number of days above 25 mm, consecutive dry days, consecutive wet days, very wet days, extremely wet days, and annual total wet-day precipitation). The precipitation data for calculating the above mentioned parameters is obtained from the Royal Netherlands Meteorological Institute for the period 1957–2016. Based on statistical analysis and the calculated values, the results have been presented with the Geographic Information System (GIS) to point out the most vulnerable parts of the Netherlands with regard to pluvial erosion. This study presents the first results of combined rainfall erosivity and extreme precipitation indices for the investigated area. Trend analysis implies a shift from being largely in the low erosivity class to being completely in the moderate erosivity class in the future, thus indicating an increase in rainfall erosivity. Furthermore, the observed precipitation extremes suggest that both the amount and the intensity of precipitation are increasing.
The results of this study suggest that the climate conditions in the Netherlands are changing, and that this change might have a negative influence on the rainfall erosivity of the country.
Key-words: erosion, hazard, rainfall erosivity, precipitation, extreme precipitation indices, precipitation concentration index, modified Fourier index, Netherlands
1. Introduction
Soil erosion is described as one of the biggest hazards and main environmental problems in many areas in Europe (e.g., Vallejo et al., 2005; de Luis et al., 2010, 2011; Blinkov, 2015; Lukić et al., 2016). Erosion is the primary physical phenomenon which causes the movement of soil and rock particles via water, wind, ice, and gravity. Bosco et al. (2015) pointed out that soil erosion by water is one of the most widespread forms of soil degradation.
The major climatic variable affecting water erosion is precipitation (Wischmeier and Smith, 1978; Mello et al., 2013). Nevertheless, soil erosion by water is a complex phenomenon. Certain authors argue that there is no exact relationship between the soil erosion and the total amount of rainfall, as well as relationship with the intensity of rainfall and its distribution in time (Kirkby and Neale, 1987; de Luis et al., 2010; 2011). It is also pointed out in the various investigations of the respective authors, that soil erosion by rainfall can be considered as a natural hazard (Rawat et al., 2011; Berger and Rey, 2004; Gares et al., 1994; Mather, 1982) intrinsically entangled with many other natural hazard types (Markantonis et al., 2012).
The potential of rain to generate soil erosion is known as rainfall erosivity, and its estimation is fundamental for the understanding of climatic vulnerability of a given region (de Luis et al., 2011; Mello et al., 2013). Therefore, erosion and precipitation distribution are important elements concerning the implications of climate variability and change. Also, the occurrence of extreme events and their impacts on society have become a fundamental issue due to the greater climate change effects on them (e.g., very heavy precipitation episodes).
Analysis of precipitation events was seldom performed in climatological studies.
On the other hand, the precipitation variability is one of the best indicators of climatic change (Handmer et al., 1999). The predictions announced by the IPCC (Intergovernmental Panel on Climate Change) reports (IPCC, 2013) indicate that extreme events are very likely to change concerning their intensity, frequency, and location in the 21st century. The report points out human influence as a likely cause of global warming and changes in the hydrological cycle, with a precipitation decrease in subtropical areas and intensification of extremes (Trenberth, 2011). These changes in precipitation and derived extreme events have been associated with climate dynamics over different European regions (e.g., Casanueva et al., 2014).
Study of Boardman and Poesen (2006) indicate that soil erosion by rainfall and runoff is one of the main soil threats in Europe. Due to the global climate variability, there is a great uncertainty about the future development of soil erosion by water, because the reliability of model outputs for precipitation are less accurate than those for air temperatures (Christensen et al., 2007). Lately, a number of models and approaches in a GIS environment have been developed using the available database for erosion factors at the scale of Europe. This
research was focused on the countries within the European Union, but data about water erosion is often missing (Blinkov, 2015). Regional analysis of potential erosion should take into account the variability of precipitation in space and time, and this should be achieved by using dense spatial information.
At present, there are many datasets on a global or continental scale (e.g., Klein- Tank et al., 2002; Wijngaard et al., 2003), but these are not useful at sub- regional level because of the low density of observations. This situation is especially critical in areas with high variability of rainfall in Europe.
During the last century, precipitation in the Netherlands has increased by approximately 25% (Buishand et al., 2013). The increasing sea surface temperatures (Attema et al., 2014) and changes in circulation (Van Haren et al., 2013; Van Oldenborgh and Van Ulden, 2003) are considered to be the main reasons for this increase in precipitation. A larger increase can be seen along the West Coast region, where this is most likely caused by the enhanced coastal effect (Lenderink et al., 2009), but other factors like the topography and ongoing urbanization in these areas might have contributed as well.
The rainfall regime reflects the aggressiveness of erosion on the geological substrate and soil through the volume, duration, and intensity of precipitation. In this study, a parameter based on mean monthly data averages, modified Fournier index (MFI), defined by Arnoldus (1980) will be used. This parameter is derived from temporal precipitation distribution, calculated using the precipitation concentration index (PCI). Agreement between MFI and USLE R factor (rainfall aggressivity factor) has been described in several studies (e.g., Renard and Freimund, 1994; Gabriels, 2001; Loureiro and Coutinho, 2001; Diodato and Bellocchi, 2007; de Luis et al., 2010; Mello et al., 2013), and as a consequence, they are commonly used as the input aggressivity factor in the development of regional models (Gregori et al., 2006; Bosco et al., 2015). Subsequently, the precipitation extremes (heavy precipitation events), which have great potential impacts on human society, land cover, and ecosystems in general will be investigated in this study. Thus, it can be highlighted that understanding the potential links between extreme weather events and erosion triggering factors induced by climate conditions is very important in the context of vulnerability and adaptation to climate change.
Rainfall erosivity (R factor) and extreme precipitation events have been widely investigated in numerous studies for different parts of the world. Beside studies that were based on MFI parameter (e.g., Oduro- Afriyie, 1996; Ferro et al., 1999; Lujan and Gabriels, 2005; Apaydin et al., 2006; Costea, 2012; Yue et al., 2014; Hernando and Romana, 2015), PCI was also used as a stand-alone factor in analysis of precipitation distribution and concentration (Martınez- Casasnovas et al., 2002; de Luis et al., 2011; Zhao et al., 2011; Iskander et al., 2014). As far as the extreme precipitation indices are concerned, there are many papers from the respective authors from all around the world (e.g., Easterling et
al., 2000; Alexander et al., 2006; Van Minnen et al., 2013; Donat et al., 2013;
Van den Hurk et al., 2015).
This study strives to analyze rainfall aggressiveness trends, extreme precipitation indices, and their spatial variability over the Netherlands. Results from this study can be used for development of prevention activities and for the promotion of mitigation measures at all levels. The objectives of this study are to analyze the relationship between trends of precipitation (Pt), extreme precipitation indices, MFI, and PCI in order to describe the evolution of rainfall aggressivity during 1957–2016 (two climatological cycles) in the Netherlands, and to look for spatial distribution patterns. This is of great importance, when assessing the risk impact not only for the present time, but for future scenarios as well. Investigation resulting from this study can aid in creating suitable strategies in order to avoid or reduce the impacts of rainfall aggressivity not only in the investigated area, but in the surrounding countries (or regions) as well.
2. Material and methods
2.1. Study area
The territory of the Netherlands is located in Western Europe, and it covers 41.543 km2. It borders in the east with Germany, in the south with Belgium, and in the north and west with the North Sea. The population of Netherlands is approximately 17 million people. That gives the country a population density of 502 person per km2 (CBS, 2017).
Fig. 1 shows a map of the investigated area, and it displays the locations of the meteorological stations which were used for the collection of precipitation data applied for this study. The stations were selected on the basis of the availability of data and its completeness for the investigated period 1957–2016.
Additionaly, an equal spatial distribution of the stations from north to south of the country was taken into account.
The geography of the Netherlands is unique in a way that a large part of its land has been reclaimed from the sea and lies below sea level, protected by dikes. The country can be split into two areas: the low and flat lands in the west and north, and the higher lands with minor hills in the east and south. The highest point of the Netherlands, Vaalserberg, is 322.7 meters above the sea level. Six geological/geomorphological agents have been active in the Netherlands: tectonics, ice, wind, rivers, sea, and life. These forces have created six different landscapes, namely the aeolian dune fields, foothills of the Ardennes, alluvial plains, peat landscape, sandur plains, and the sea clay landscape (Lambert, 1971; Meijer, 1985). The maritime climate in the Netherlands is described as temperate with cool summers and mild winters. This climate is caused by predominant southwest wind, and has a typically high
3.1 °C (January) to 17.9 °C (July). Precipitation has relatively uniform distribution throughout the year, with summer and autumn months being slightly wetter (Meijer, 1985; KNMI - the Dutch National Weather Service).
Fig. 1. Geographical location of meteorological stations in the Netherlands used in this study.
2.2. Data and methods
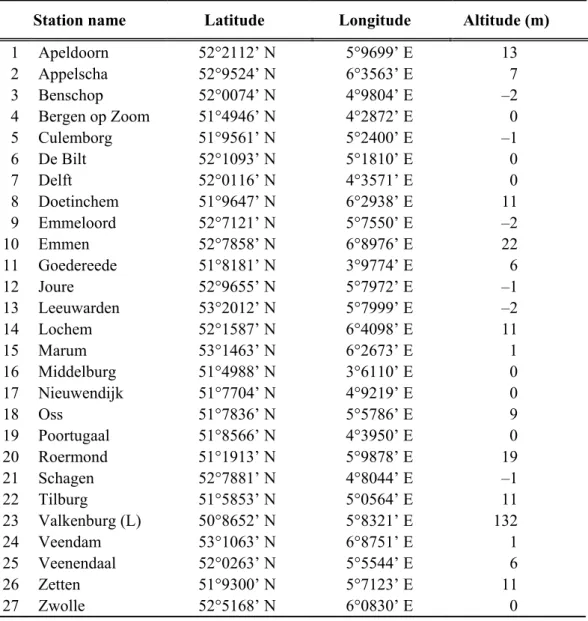
The daily and monthly values of precipitation were used for the calculation of extreme precipitation, as well as the rainfall erosivity indices. This data is recorded and provided by the Royal Netherlands Meteorological Institute (KNMI) in accordance with standards recommended by the World Meteorological Organization (WMO). A list of the meteorological stations is given in Table 1.
Table 1. List of meteorological stations and their geographical coordinates and altitudes
Station name Latitude Longitude Altitude (m)
1 Apeldoorn 52°2112’ N 5°9699’ E 13
2 Appelscha 52°9524’ N 6°3563’ E 7
3 Benschop 52°0074’ N 4°9804’ E –2
4 Bergen op Zoom 51°4946’ N 4°2872’ E 0
5 Culemborg 51°9561’ N 5°2400’ E –1
6 De Bilt 52°1093’ N 5°1810’ E 0
7 Delft 52°0116’ N 4°3571’ E 0
8 Doetinchem 51°9647’ N 6°2938’ E 11
9 Emmeloord 52°7121’ N 5°7550’ E –2
10 Emmen 52°7858’ N 6°8976’ E 22
11 Goedereede 51°8181’ N 3°9774’ E 6
12 Joure 52°9655’ N 5°7972’ E –1
13 Leeuwarden 53°2012’ N 5°7999’ E –2
14 Lochem 52°1587’ N 6°4098’ E 11
15 Marum 53°1463’ N 6°2673’ E 1
16 Middelburg 51°4988’ N 3°6110’ E 0
17 Nieuwendijk 51°7704’ N 4°9219’ E 0
18 Oss 51°7836’ N 5°5786’ E 9
19 Poortugaal 51°8566’ N 4°3950’ E 0
20 Roermond 51°1913’ N 5°9878’ E 19
21 Schagen 52°7881’ N 4°8044’ E –1
22 Tilburg 51°5853’ N 5°0564’ E 11
23 Valkenburg (L) 50°8652’ N 5°8321’ E 132
24 Veendam 53°1063’ N 6°8751’ E 1
25 Veenendaal 52°0263’ N 5°5544’ E 6
26 Zetten 51°9300’ N 5°7123’ E 11
27 Zwolle 52°5168’ N 6°0830’ E 0
Before the calculation, the homogeneity of the meteorological datasets for precipitation was examined according to the Alexandersson (1986) test. The homogeneity analysis indicated that the data for all observed stations are homogeneous. Precipitation concentration index (PCI) was calculated using the approach given by Oliver (1980) which was described in detail by Michiels et al.
(1992) and Lukić et al. (2016). Calculation of the PCI on seasonal and supra seasonal scales was performed using the approach of de Luis et al. (2011), Martınez-Casasnovas et al. (2002), Lujan and Gabriels (2005), Mello et al.
(2013) and Lukić et al. (2016). Modified Fournier index (MFI) was calculated according to the guidelines given by Arnoldus (1980).
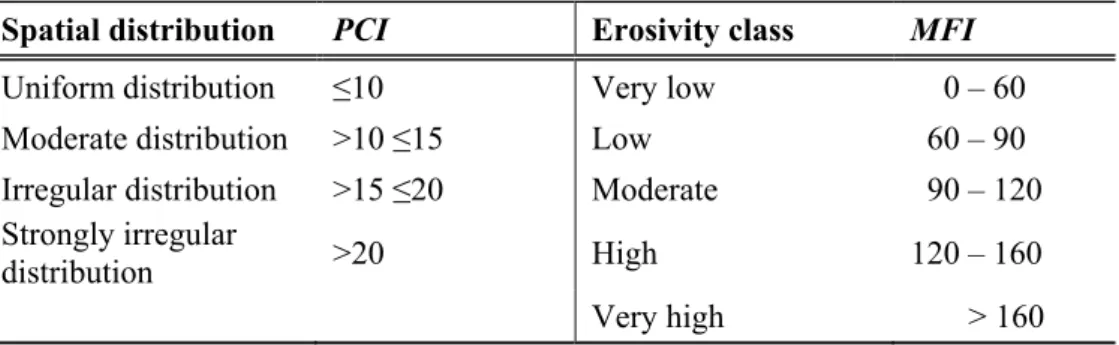
Table 2 shows the classes of the PCI values and the rainfall erosivity classes determined by means of the MFI (e.g., Arnoldus, 1980; Oliver, 1980;
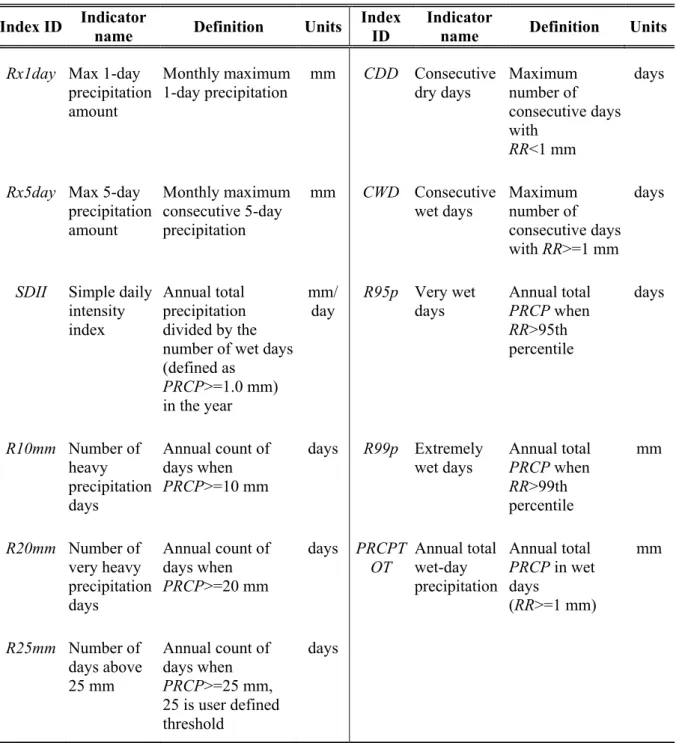
Sfîru et al., 2011; Costea, 2012; Iskander et al., 2014; Lukić et al., 2016). The extreme values of precipitation were calculated following the indices developed by the ETCCDI (http://cccma.seos.uvic.ca/ETCCDI) (Table 3). The RclimDex software package was used for this occasion. This is a software package designed to provide a user friendly interface to compute indices of climate extremes for monitoring and detecting climate change. Eleven precipitation indices were used for further analysis, and they are presented in Table 3.
Table 2. PCI value classes and MFI erosivity classes (based on Arnoldus, 1980)
Spatial distribution PCI Erosivity class MFI Uniform distribution ≤10 Very low 0 – 60 Moderate distribution >10 ≤15 Low 60 – 90 Irregular distribution >15 ≤20 Moderate 90 – 120 Strongly irregular
distribution >20 High 120 – 160
Very high > 160
The Mann-Kendall (MK) nonparametric test was used to evaluate the presence of long-term trends in the time series of rainfall erosivity indices and precipitation indices (Mann, 1945; Kendall, 1976). The MK test compares the relative magnitudes of data rather than the data values themselves (Gilbert, 1987). Two hypotheses are tested in the MK test: the null hypothesis (H0), that states there is no trend in the time series, and the alternative hypothesis (Ha) which states there is a significant trend in the series, for a certain significance level. Statistical significance (as seen as the probability p) takes values between 0 and 100 in %. In fact, p is used to test the level of confidence in H0. If the computed p value is lower than the chosen significance level, α (e.g., α = 5%), the H0 should be rejected, and Ha should be accepted. On the other hand, if the computed p value is greater than the significance level α, the H0 cannot be rejected (Gilbert, 1987).
Table 3. Definitions of 11 precipitation indices used in this study Index ID Indicator
name Definition Units Index ID
Indicator
name Definition Units Rx1day Max 1-day
precipitation amount
Monthly maximum 1-day precipitation
mm CDD Consecutive dry days
Maximum number of consecutive days with
RR<1 mm
days
Rx5day Max 5-day precipitation amount
Monthly maximum consecutive 5-day precipitation
mm CWD Consecutive wet days
Maximum number of consecutive days with RR>=1 mm
days
SDII Simple daily intensity index
Annual total precipitation divided by the number of wet days (defined as
PRCP>=1.0 mm) in the year
mm/
day
R95p Very wet days
Annual total PRCP when RR>95th percentile
days
R10mm Number of heavy precipitation days
Annual count of days when PRCP>=10 mm
days R99p Extremely wet days
Annual total PRCP when RR>99th percentile
mm
R20mm Number of very heavy precipitation days
Annual count of days when PRCP>=20 mm
days PRCPT OT
Annual total wet-day precipitation
Annual total PRCP in wet days
(RR>=1 mm)
mm
R25mm Number of days above 25 mm
Annual count of days when PRCP>=25 mm, 25 is user defined threshold
days
The presence of a positive serial correlation in a data set was found to increase the number of false positive results of the MK trend test (Von Storch and Navarra, 1995). In order to prevent this, prior to application of the MK test, Yue-Pilon pre-whitening test was applied (Yue et al., 2002). First, the slope of the trend in each time series was estimated using the Theil-Sen approach (TSA).
If the slope was found to differ from zero, the identified trend was assumed to be linear and subtracted from the sample data. The resulting residual series is
referred to as the detrended series. Next, the lag-1 serial correlation coefficient of the detrended series was computed and removed from the series. Finally, the identified trend and the modified residual series were combined, and then the MK test was applied (e.g., Yue et al., 2002; Basarin et al., 2016, 2017). For this purpose, the ZYP package in R (http://www.r-project.org) was utilized.
The Geographic Information System (GIS) and numerical modeling are becoming powerful tools not only in geographic sciences but also in climatic data processing. GIS represent a useful solution to the management of vast spatial climate datasets for a wide number of applications (Franke, 1982; Lam, 1983; Burrough, 1986; Watson and Philip, 1987; McCullagh, 1988; Franke and Nielson, 1991; Collins and Bolstad, 1996). All climatological data can be used for mapping and spatial modeling with GIS. This study uses numerical approaches for interpolating rainfall erosivity and precipitation indices applying the ArcMap software. The most suitable interpolation method for the visualization of complex data in this paperwork is the empirical bayesian kriging, which was employed through the ArcMap extension Spatial Analyst.
The advantages of this interpolation (e.g., standard errors of prediction are more accurate than with other rriging methods) have been explained in detail by Pilz and Spöck (2007).
3. Results
3.1. Precipitation concentration index (PCI)
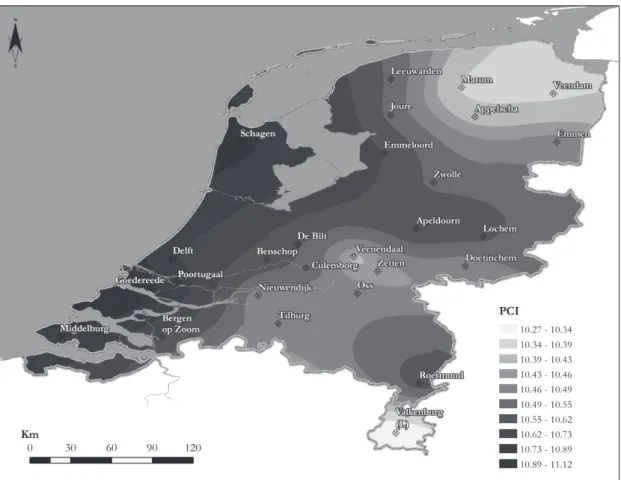
The PCI results for the 27 weather stations are shown in Fig. 2. The PCI values in the Netherlands range from 10.27 to11.12 respectively. Thus, the Netherlands has a moderate precipitation concentration distribution. The lowest PCI value is found for the Valkenburg station (10.27) in the southern parts, while the highest value (11.12) is observed for the Goedereede station in the western part of the country. Trend analysis shows presence of a significant positive trend of PCI values for the Valkenburg station, where the PCI increases by 0.22 per year (p<0.05), and for the Delft station where the PCI increases by 0.01 per year (p<0.1). The obtained values are almost uniformly shifting from relatively higher values in the west to lower values in the southeastern and northeastern parts of the country. Noteworthy is that in the central parts of the Netherlands, alongside the river Rhine and the Ijssel, the PCI exhibits slightly higher values that also belong to the class of a moderate precipitation concentration. This implies that the recorded increasing trend (for 59% of the observed stations) in the distribution of the PCI values could lead to a shift from moderate to irregular distribution for the future period. Calculated values of this index are of great importance for the stations with recorded statistical significance (located in the southern and western part of the country), where values of the PCI display an increase by 2.2 and 0.1 per decade respectively.
Fig. 2. Precipitation concentration index (PCI) on an annual basis for the observed period.
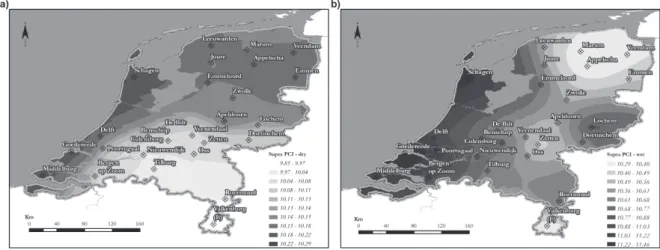
As for the distribution of precipitation during dry (Fig. 3a) and wet (Fig. 3b) periods, a clear difference can be seen. During the dry season (April-September), the PCI values range from 9.85 for the Valkenburg station (in the south) to 10.29 for the Apeldoorn station (in the central part of the Netherlands). Thus, it can be pointed out that during the dry season, the country falls somewhere in between the uniform precipitation distribution and the moderate precipitation concentration class. 30% of the stations exhibit an increasing trend at the given significance level of 90% (p<0.1), two stations (Bergen op Zoom and Leeuwarden) display an increasing trend for the significance level of 95% (p<0.05), while the stations Appelscha and Delft are showing positive trends at a significance level of 99%
(p<0.01). The supra-seasonal PCI values for the wet season (October-March) range from 10.29 for the Appelscha station to 11.46 for the Goedereede station.
Therefore, it can be stated that during the wet season, the investigated area has a moderate precipitation concentration. Trend analysis show a statistically significant increasing trend for the Valkenburg station, where the value increases by 0.02 per year (p<0.01), while a decreasing trend of –0.01 per year is observed for the Lochem station (p<0.1). Thus, it can be observed that the precipitation distribution shows more uniformity during the dry than the wet season.
Fig. 3. Supra-seasonal PCI for dry (a) and wet (b) season for the observed period.
The PCI values during the summer season (June-August) are ranging from 3.20 for the Valkenburg station to 3.40 for the Goedereede station. Based on the trend analysis it can be noted that 26% of the stations show a decreasing trend in PCI value. A significant increasing trend is found for the station of Appelscha (in the north), where the PCI value increases by 0.01 per year (p<0.01). The station of Valkenburg shows a significant rising trend (0.004 per year; p<0.05), as well as the station of De Bilt, where the PCI value imperceptibly increases by 0.003 per year (p<0.1).
During the autumn season (September-November), the values range from 3.19 for the Leeuwarden station to 3.48 for the Goedereede station. All the observed stations show an increasing trend, with the exception of the Veendam station where a minimum decline of –0.006 PCI value per year is detected. Only the station, in Roermond indicates a significant positive trend, where the PCI value increases by 0.004 per year (p<0.1).
Since all the observed seasonal PCI values weight below 10, it can be concluded that there is a uniform precipitation distribution within the investigated area. The winter season indicates much higher PCI values than the other seasons, but variation within the seasons themselves is low. Nevertheless, a difference can be observed in the spatial distribution of the PCI values between the different seasons.
3.2. Modified Fournier index (MFI)
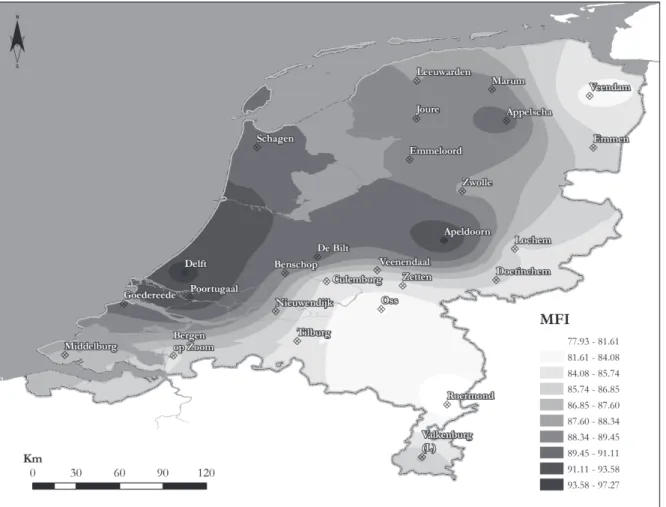
The results of the MFI and its spatial distribution are presented in Fig. 4. The MFI values for the Netherlands range from 77.93 for the Roermond station (in the southeast) to 97.27 for the Apeldoorn station (in the central parts). 37% of the stations have a positive trend at the given significance level of 99%
(p<0.01), while 26% of the stations display a significant increasing trend at the
given significance level of 95% (p<0.05). The stations Culemborg and Lochem show an increasing trend at the significance level of 90% (p<0.1), where the MFI values are experiencing an increase by 0.18 per year. The only statically significant decreasing trend (p<0.1) was found for the Valkenburg station in the south of the country, where the MFI value declines by 0.01 per year.
Fig. 4. Modified Fournier index (MFI) variability during the observed period.
It can be observed that the largest part of the Netherlands falls within the low erosivity class (with values ranging from 78 to 90). Only the regions in the northern, central and western parts of the country (30% of stations analyzed in this study) fall in the moderate erosivity class with values ranging from 90 to 97.
Based on the calculated MFI values (Fig. 4) it can be seen that the western part of the country display higher values of erosivity. The lowest MFI values are
found in the region of Veendam in the northeast, and for the stations Oss and Roermond in the southeast part of the country.
This implies that the recorded significant increasing trend (for 70% of the observed stations) in MFI value could lead to a shift from being largely in the low erosivity class to being completely in the moderate erosivity class in the future, thus indicating an increase in rainfall erosivity.
The calculated MFI results are not completely in line with previous research on soil erosion in the Netherlands since soil erosion is determined by several parameters, not just rainfall erosivity. According to Renes (1988), soil erosion by water occurs in the Netherlands, mainly on the 40.000 ha of loess soils in the province of South-Limburg, where a hilly topography prevails.
Whereas, the results of the calculated MFI values show higher erosivity classes for the western parts of the country. This difference can be explained by the fact that the MFI is a relatively simple estimator of the rainfall erosivity (R). Also, this index is based on the mean monthly and annual rainfall amount. Therefore, consideration of other physical factors associated with atmospheric variables must be taken into account in future investigations. Bearing in mind that the soil erosion in South-Limburg province mainly occurs on the slopes (e.g., Winteraeken and Spaan, 2010), whereas the other parts of the Netherlands are basically flat, more research is needed to improve methods for estimating soil erosion rates and variability using various models and statistical approaches, upon which mitigation strategies can be assessed and implemented.
3.3. Extreme precipitation indices
Precipitation extremes (heavy precipitation events), have been calculated for the period 1957–2016. These indices were analyzed in order to identify possible changes in precipitation related to climate extremes over the Netherlands, which could lead to increase of rainfall erosivity.
The spatial variability of the calculated RX1day show that all investigated stations has a positive trend, with acceptance of the Poortugaal station. The stations Delft and Veendam display a significant increasing trend (p<0.01), respectively by 0.24 and 0.20 mm per year. Four stations (Goedereede, Middelburg, Roermond, and Tilburg) exhibit a significant increasing trend at a significance level of 95% (p<0.05). A significant positive trend (p<0.1) is found for the stations Apeldoorn (0.16 mm per year) and Nieuwendijk (0.20 mm per year).
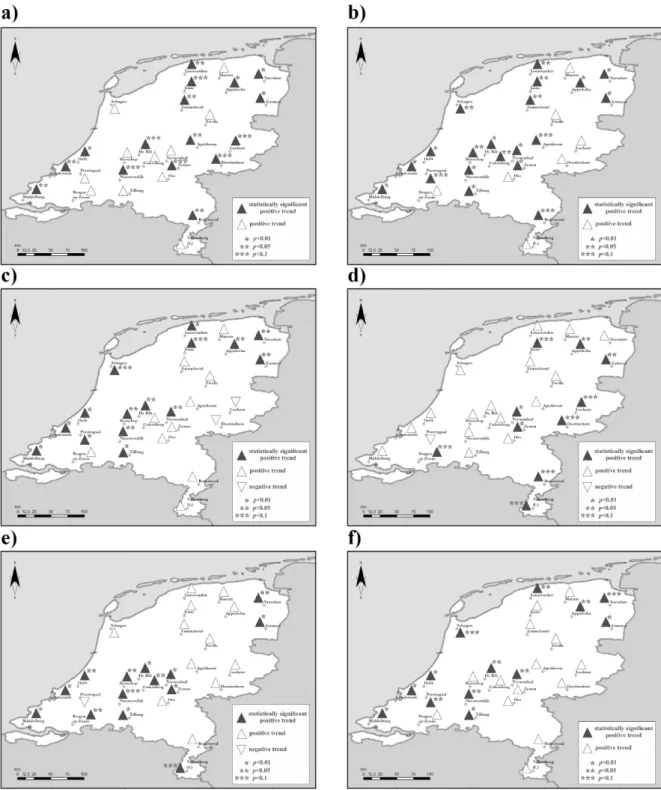
The results of the Rx5days exhibit a positive trend for all of the observed stations (Fig. 5a). Four stations (Appelscha, Delft, Emmen, and Veendam) have a statistically significant trend at a confidence level of 99% (p<0.01), six stations (Apeldoorn, Emmeloord, Goedereede, Leeuwarden, Middelburg, and Roermond) exhibit a positive significant trend at the given significance level of 95% (p<0.05), while another six stations (De Bilt, Doetinchem, Joure, Lochem,
Nieuwendijk, and Zetten) have an increasing significant trend at a significance level of 90% (p<0.1). Since the observed values display positive trend within 96% of the analyzed stations, linking precipitation extremes, their spatial variability and trends are of great importance when it comes to the erosion vulnerability assessment.
Fig. 5. Tendencies for the a) Rx5day, b) SDII, c) R10mm, d) R25mm, e) R95p, and f) PRCPTOT indices for the observed period.
Values of SDII are presented in Fig. 5b. All of the stations exhibit a positive trend, while 74% of them are displaying statistical significance at their given significance level. 41% of the analyzed stations have a significant increasing trend at the given significance level of 99% (p<0.01), 22% of the observed stations show a positive trend at a significance level of 95% (p<0.05), while the stations Apeldoorn, Poortugaal, and Roermond have a statically significant positive trend values by respectively 0.01 mm/day per year (p<0.1).
Therefore, the observed SDII values display a positive trend for all investigated stations for the 1957–2016 period, implying the continuous pronunciation of the observed extremes.
The results of the R10mm are shown in Fig. 5c. Six stations (Delft, Goedereede, Leeuwarden, Middelburg, Poortugaal, and Tilburg) have a significant increasing trend at p<0.01, while seven stations (Appelscha, Benschop, De Bilt, Emmen, Nieuwendijk, Veendam, and Veenendaal) show a significant positive trend at a significance level of 95% (p<0.05). The stations Joure and Schagen have a significant increasing trend by respectively 0.07 days per year at p<0.1. The only negative trends are observed for the stations Doetinchem and Lochem, but these trends show no statistical significance.
The results of the R20mm show that stations Delft and Emmen have a significant increasing trend by 0.05 and 0.06 days per year, respectively, at p<0.01. A total of six stations (Goedereede, Middelburg, Tilburg, Valkenburg, Veenendaal, and Zetten) show a significant positive trend at a significance level of 95% (p<0.05). The stations of Schagen and Poortugal display a negative trend, but these trends have no statistical significance.
The results of the R25mm are shown in Fig. 5d. The stations of Veenendaal and Zetten display a significant increasing trend by respectively 0.04 and 0.03 days per year (p<0.01), whereas the stations of Appelscha and Emmen both show a significant increasing trend by 0.02 days per year at p<0.05. A total of six stations (Bergen op Zoom, Doetinchem, Joure, Lochem, Roermond, and Valkenburg) have a significant positive trend at a significance level of 90%
(p<0.1). The stations of Schagen and Poortugal have a negative, but not statistically significant trend. The obtained results for the R10mm, R20mm, and R25mm are in line with the results of previous studies (e.g., Donat et al., 2013;
IPCC, 2007, 2012, 2013), which report that many of the precipitation indices consistently indicate increases in precipitation extremes (in some cases significantly). Therefore, the frequency of heavy precipitation days and the percentage of events contributing to precipitation totals are expected to increase as confirmed by this study. This implies higher susceptibility to pluvial erosion in the Netherlands.
None of the calculated values of CDD indicate a significant trend. 37% of the stations display none significant positive trend, while the other 63% of the stations have none significant negative trend. The obtained results indicate the presence of wetter conditions in the investigated area.
The results for the CWD indicate that only two stations show a significant trend. The station Poortugaal shows a significant positive trend by 0.06 days per year at a significance level of 95% (p<0.05), while Tilburg has displayed a significant positive trend by 0.03 days per year at p<0.1. Both Poortugaal and Tilburg are located in the southwest of the Netherlands. A total of nine stations have a negative (but not significant trend), while fourteen stations (52%) display a positive (but not significant) trend. According to Casanueva et al.
(2014), positive phases of the North Atlantic Oscillation (NAO) cause occurrence of heavier precipitation and a decrease in CDD (which also could lead to an increase in CWD values) in the north of Europe and the opposite in the south of the continent. For the case study of the Netherlands, an increase in CWD values is observed for 67% of the investigated stations. Stations with negative tendency of CWD values are located in northern and southeastern parts of the country.
Fig. 5e presents the spatial distribution pattern of the R95p. Poortugaal is the only station that shows a negative trend, but this trend is not significant. A total of six stations have a significant increasing trend at a significance level of 99% (p<0.01), and four stations show a significant increasing trend at p<0.05. The stations Nieuwendijk and Valkenburg have a significant positive trend by respectively 0.90 and 1.04 mm per year at p<0.1. Most of the stations with a significant trend are found in the central and southwestern parts of the Netherlands. Generally, positive tendency of R95p is observed for 96% of the analyzed stations. These results are in agreement with the findings of Trenberth et al. (2007), who concluded that the number of heavy precipitation events (e.g., 95th percentile) increases within many land regions, even in regions with a reduction in total precipitation amounts. The respective authors did not pick up on sub regional and local differences in trends, because the study was focused on the whole of Europe. In addition, results from this study can give a certain focus to the regions in Western Europe, i.e., the Netherlands.
According to Casanueva et al. (2014), the CWD and CDD are more related to large-scale atmospheric circulations, while the R95p has a convective origin and depends more on local processes and moisture fluxes. The annual increase of R95p could be related to an intensification of the hydrological cycle associated with a warming-related increase of atmospheric moisture content (e.g., Casanueva et al., 2014; Schmidli et al., 2007). Therefore, the increase of moisture due to intensified warming (Trenberth, 2011) may cause stronger changes in convective precipitation than in large-scale precipitation (e.g.
Casanueva et al., 2014). Similar connections could be applied to the area of the Netherlands.
The tendency of the R99p indicate that stations Bergen op Zoom and Delft have a significant positive trend by respectively 0.80 and 1.03 mm per year (p<0.01), while six of the stations display a significant positive trend at p<0.05. The stations De Bilt, Goedereede, and Middelburg have a significant
positive trend at a significance level of 90% (p<0.1). The stations Poortugaal and Zwolle show not significant decreasing trend. Positive tendency of R99p is observed for 93% of the analyzed stations.
Certain model simulations suggest that more extreme precipitation scenarios will have significant consequences for soil water dynamics at both shallow and deep soil depths. Because more extreme precipitation patterns represent permanent, as opposed to transient, changes in terrestrial ecosystems (e.g., those related to disturbances), resource levels will also be chronically altered either directly, through soil water dynamics, or indirectly, through the effects of soil water on the availability of other resources (Knapp et al., 2008;
Bosco et al., 2015). The investigation of the extreme precipitation parameters is of great importance for the Netherlands, since the intensity of rainfall is one of the main factors driving soil water erosion processes.
The results for the PRCPTOT are shown in Fig. 5f. All of the stations display a positive trend. For four of the stations this trend is significant at the given significance level of 99% (p<0.01), while six stations have a significant trend at p<0.05. The stations Schagen and Veendam have a significant positive trend respectively by 1.47 and 1.73 mm per year at p<0.1.
These results are in agreement with previous studies, which pointed out that for the European continent, a growing intensity of heavy precipitation over the last five decades can be expected. Klein-Tank and Können (2003) reported primarily positive linear trends in extreme precipitation indices up to 5% per decade from their analysis of daily station data for the period 1945–1995.
Similar conclusions were derived on the continental scale, and various regional studies (Easterling et al., 2000; Trenberth et al., 2007; Frei and Schär, 2001;
Groisman et al., 2005; Zolina et al., 2005, 2008; Brunetti et al., 2004, 2006;
Moberg et al., 2006; Alexander et al., 2006).Van Minnen et al. (2013) pointed out that the frequency in which extreme precipitations in the Netherlands take place have increased since the last century. This happened primarily in winter and predominantly in the western part of the Netherlands. The respective authors explain the increase in extreme precipitation primarily by an increase in the amount of rain during already rainy days. The results from this study support the findings of the respective authors.
Using standardized indices for extreme climate events that have been defined by ETCCDI, a comprehensive understanding of variation patterns in precipitation extremes is gained for the Netherlands. The results of the precipitation extremes are in good agreement with the results of other studies conducted for the Netherlands and the European continent as well. In a majority of cases in this study, most precipitation indices suggest that there is an increase not only in the amount, but also in the intensity of precipitation.
Changes in precipitation extremes were examined and evaluated in this study, because this approach can provide a more detailed insight of driving factors of rainfall erosivity, its spatial distribution, and impact. The main reason for
this lays in the fact that heavy precipitation events rank among the natural hazards with the most disastrous impact on human societies and anthropogenic systems in general.
4. Conclusions
The potential of rain to generate soil erosion is known as rainfall erosivity, and its estimation is fundamental for the understanding of climatic vulnerability of a given region. Also, the occurrence of extreme events and their impacts on society have become a fundamental issue due to the greater climate variability effects on them (e.g., very heavy precipitation episodes). Observation of rainfall erosivity in the Netherlands was carried out on the basis of the analysis of rainfall aggressiveness trends, extreme precipitation indices, and their spatial variability for the period 1957–2016. This study presents the first results of combined rainfall erosivity and extreme precipitation indices for the investigated area. The analysis, applied to the present climate conditions, reveal necessary information which can be used by decision makers on various levels, for the development of prevention activities and for the promotion of mitigation measures at all levels.
The results of this study indicate that, on an annual basis, the PCI values range within a moderate precipitation concentration distribution class, but trend analyses implies a shift from moderate to irregular distribution for the future period. However, during the dry season (April-September), the supra-seasonal PCI values are ranging between the uniform precipitation distribution and the moderate precipitation concentration class. Trend analysis implies a shift from being partly in the uniform and moderate class to being completely in the moderate distribution class for the future period. The supra-seasonal PCI values for the wet season (October-March) indicate a moderate precipitation concentration. When observing the results for the different seasons, it can be concluded that the winter season (December-February) indicates much higher PCI values than the other seasons. Since all the observed seasonal PCI values weight below 10, it can be concluded that there is a uniform precipitation distribution within the investigated area.
The MFI values for the Netherlands suggest that the largest part of the area falls within the low erosivity class (with values ranging from 78 to 90). Only the regions in northern, central, and western parts of the country (30% of stations analyzed in this study) fall in the moderate erosivity class with values ranging from 90 to 97. However, trend analysis implies a shift from being largely in the low erosivity class to being completely in the moderate erosivity class in the future, thus indicating an increase in rainfall erosivity.
The precipitation extremes suggest that both the amount and the intensity of precipitation are increasing, which is in a good agreement with the studies conducted for the Netherlands, as well as the ones done for the entire European
continent. The results of this study suggest that the climate conditions in the Netherlands are changing, and that this change might have a negative influence on the rainfall erosivity for the country.
The results of this study can contribute to the erosivity studies, since the focus is given to the dynamics of the main climatological agent of erosion – the precipitation. Hence, utilization of the more complex and sensitive indices such as EI30 along with physically based models for deriving soil erosion rates (e.g., RUSLE), can provide a more suitable approach for detailed rainfall erosivity estimation in some future studies. Since erosion is highly dependent on topography and land use, the next stage of the investigation of these parameters could be oriented towards incorporation into the GIS environment in order to determine erosion potential and its spatial causality.
Acknowledgements: This research was supported by Projects 176020 and 43002 of the Serbian Ministry of Education, Science and Technological Development and by Project 142-451-2511/2017- 02 of Provincial Secretariat for Science and Technological Development, Vojvodina Province. Part of the research was supported by the HUSRB/1602/11/0057 – WATER@RISK – Improvement of drought and excess water monitoring for supporting water management and mitigation of risks related to extreme weather conditions. Authors are grateful to the anonymous reviewer/s whose comments and suggestions greatly improved the manuscript.
References
Alexander, L. V., Zhang, X., Peterson, T. C., Caesar, J., Gleason, B., Klein Tank, A.M.G., Haylock, M., Collins, D., Trewin, B., Rahimzadeh, F., Tagipour, A., Rupa Kumar, K., Revadekar, J., Griffiths, G., Vincent, L., Stephenson, D.B., Burn, J., Aguilar, E., Brunet, M., Taylor, M., New, M., Zhai, P., Rusticucci, M., and Vazquez-Aguirre, J.L., 2006: Global observed changes in daily climate extremes of temperature and precipitation. J. Geophys. Res: Atmospheres 111, D05109.
Alexandersson, H., 1986: A homogeneity test applied to precipitation data. J. Climatology 6, 661–675.
https://doi.org/10.1002/joc.3370060607
Apaydin, H., Erpul, G., Bayramin, I., and Gabriels, D., 2006: Evaluation of indices for characterizing the distribution and concentration of precipitation: A case for the region of Southeastern Anatolia Project, Turkey. J. Hydrology 328, 726–732.
https://doi.org/10.1016/j.jhydrol.2006.01.019
Arnoldus, H. M., 1980: An approximation of the rainfall factor in the Universal Soil Loss Equation. In:
(Eds.de Boodts M, Gabriels D.) Assessments of Erosion. John Wiley and Sons Ltd., Chichester, 127–132.
Attema, J.J., Loriaux, J.M., and Lenderink, G., 2014: Extreme precipitation response to climate perturbations in an atmospheric mesoscale model. Environ. Res. Letters 9, 1–12.
https://doi.org/10.1088/1748-9326/9/1/014003
Basarin, B., Lukić, T., Pavić, D., and Wilby, R.L., 2016: Trends and multi-annual variability of water temperatures in the river Danube, Serbia. Hydrol.Proc. 30, 3315–3329.
https://doi.org/10.1002/hyp.10863
Basarin, B., Lukić, T., Mesaroš, M., Pavić, D., Đorđević, J., and Matzarakis, A., 2017: Spatial and temporal analysis of extreme bioclimate conditions in Vojvodina, Northern Serbia. Int. J.
Climatol 38, 142-157. https://doi.org/10.1002/joc.5166
Berger, F. and Rey, F., 2004: Mountain protection forests against natural hazards and risks: new French developments by integrating forests in risk zoning. Nat. Hazards 33, 395–404.
https://doi.org/10.1023/B:NHAZ.0000048468.67886.e5
Blinkov, I., 2015: The Balkans: The most erosive part of Europe?. Glasnik Šumarskog fakulteta 111, 9–20.
Brunetti, M., Maugeri, M., Monti, F., and Nanni, T., 2004: Changes in daily precipitation frequency and distribution in Italy over the last 120 years. J. Geophys. Res. Atmospheres 109, D05102 https://doi.org/10.1029/2003JD004296
Brunetti, M., Maugeri, M., Nanni, T., Auer, I., Böhm, R., and Schöner, W., 2006: Precipitation variability and changes in the greater Alpine region over the 1800–2003 period. J. Geophys.
Res. Atmospheres 111, D11107. https://doi.org/10.1029/2005JD006674
Boardman, J. and Poesen, J., 2006: Soil erosion in Europe: major processes, causes and consequences.
Wiley. 477–487. https://doi.org/10.1002/0470859202
Bosco, C., de Rigo, D., Dewitte, O., Poesen, J., and Panagos, P., 2015: Modelling soil erosion at European scale: towards harmonization and reproducibility. Nat. Hazards Earth Sys. Sci. 15, 225–245. https://doi.org/10.5194/nhess-15-225-2015
Buishand, T.A., De Martino, G., Spreeuw, J.N., and Brandsma, T., 2013: Homogeneity of precipitation series in the Netherlands and their trends in the past century. Int. J. Climatol. 33, 815–833.
https://doi.org/10.1002/joc.3471
Burrough, P.A., 1986: Principles of geographical information systems for land resources assessment.
Clarendon, Oxford.
Casanueva V.A., Rodríguez-Puebla, C., Frías, M.D., and González-Reviriego, N., 2014: Variability of extreme precipitation over Europe and its relationships with teleconnection patterns. Hydrol.
Earth Syst. Sci. 18, 709–725. https://doi.org/10.5194/hess-18-709-2014
CBS 2017. Bevolking; kerncijfers. http://statline.cbs.nl/statweb/publication/?vw=tanddm=slnlandpa=
37296nedandd1=0-2,8-13,19-21,25-35,52-56,68andd2=0,10,20,30,40,50,60,64- 65andhd=151214-1132andhdr=g1andstb=t (Last access June 26, 2017)
Collins, F.C. and Bolstad, P.V., 1996: A comparison of spatial interpolation techniques in temperature estimation. Proceedings of the Third International Conference/Workshop on Integrating GIS and Environmental Modeling, Santa Fe, New Mexico, January 21– 25, 1996. Santa Barbara, California: National Center for Geographic Information Analysis (NCGIA).
Costea, M., 2012: Using the Furnier indexes in estimating rainfall erosivity. Case study – the Secual Mare basin. Aerul si Apa: Componente ale Mediului 1, 313–320.
Christensen, J.H., Hewitson, A., Busuioc, A., Chen, X., Gao, I., Held, R., Jones, R. K., Kolli, W.T., Kwon, R., Laprise, V., Magana Rueda, L., Mearns, C.G., Menendez, J., Ranen, A., Rinke, A., Sarr, A., and Whetton, P., 2007: Regional climate projections. In (Eds. Solomon, S., Quin, D., Manning, M., Chen, Z., Marquis, M., Averyt, K.B., Tignor, M., Miller, H.L.) Climate Change 2007: The Physical Science Basis. Contribution of Working Group I to the Fourth Assessment Report of the Intergovernmental Panel on Climate Change. Cambridge University Press:
Cambridge and New York, NY, 848– 940.
Diodato, N. and Bellocchi, G., 2007: Estimating monthly (R) USLE climate input in a Mediterranean region using limited data. J. Hydrology 345, 224–236.
https://doi.org/10.1016/j.jhydrol.2007.08.008
Donat, M. G., Alexander, L. V., Yang, H., Durre, I., Vose, R., and Caesar, J., 2013: Global land-based datasets for monitoring climatic extremes. Bull. Amer. Meteorol. Soc. 94, 997–1006.
https://doi.org/10.1175/BAMS-D-12-00109.1
Easterling, D.R., Meehl, G.A., Parmesan, C., Changnon, S.A., Karl, T.R., and Mearns, L.O., 2000:
Climate extremes: observations, modeling, and impacts. Science 289-5487, 2068–2074.
Ferro, V., Porto, P., and Yu, B., 1999: A comparative study of rainfall erosivity estimation for southern Italy and southeastern Australia. Hydrol. Sci. J. 44, 3–24.
https://doi.org/10.1080/02626669909492199
Franke, R., 1982: Scattered data interpolation: tests of some methods. Math. Comput. 38, 181–200.
Franke, R. and Nielson, G., 1991: Scattered data interpolation and applications: a tutorial and survey.
In (Eds: Hagen H, Roller D) Geometric modelling: methods and applications. Springer, Berlin, 131–160.
Frei, C. and Schär, C., 2001: Detection probability of trends in rare events: Theory and application to heavy precipitation in the Alpine region. J. Climate 14, 1568–1584.
https://doi.org/10.1175/1520-0442(2001)014<1568:DPOTIR>2.0.CO;2
Gabriels, D., 2001: Rain erosivity in Europe. In: Man and Soil in the Third Millenium, III International Congress of European Society for Soil Conservation. 31–43.
Gares, P.A., Sherman, D.J., and Nordstrom, K.F., 1994: Geomorphology and natural hazards.
Geomorphology 10, 1–4, 1–18.
Gilbert, R.O., 1987: Statistical methods for environmental pollution monitoring. Van Nostrand Reinhold, New York, 1-336.
Gregori, E., Costanza, M., and Zorn, G., 2006: Assessment and classification of climatic aggressiveness with regard to slope instability phenomena connected to hydrological and morphological processes. J. Hydrology 329, 489–499.
https://doi.org/10.1016/j.jhydrol.2006.03.001
Groisman, P.Y., Knight, R.W., Easterling, D.R., Karl, T.R., Hegerl, G.C., and Razuvaev, V.N., 2005:
Trends in intense precipitation in the climate record. J. Climate 18, 1326–1350.
https://doi.org/10.1175/JCLI3339.1
Handmer, J.W., Dovers, S., and Downing, T.E., 1999: Societal Vulnerability to Climate Change and Variability. Mitig. Adaptat. Strategies Glob. Change 4, 267–281.
https://doi.org/10.1023/A:1009611621048
Hernando, D. and Romana, M.G., 2015: Estimating the rainfall erosivity factor from monthly precipitation data in the Madrid Region (Spain). J. Hydrol. Hydromechanics 63, 55–62.
https://doi.org/10.1515/johh-2015-0003
IPCC 2007. Climate change 2007: the physical science basis. Cambridge University Press, Cambridge, UK.
IPCC 2012. Summary for Policymakers. In (Eds.: Field, C.B., Barros, V., Stocker, T.F., Qin, D., Dokken, D.J., Ebi, K.L., Mastrandrea, M.D., Mach, K.J., Plattner, G.-K., Allen, S.K., Tignor, M., and Midgley, P.M.) Managing the Risks of Extreme Events and Disasters to Advance Climate Change Adaptation, , A Special Report of Working Groups I and II of the Intergovernmental Panel on Climate Change, Cambridge University Press, Cambridge, UK, and New York, NY, USA, 1–19.
IPCC 2013. Climate Change 2013. The Scientific Basis, Cambridge University Press, New York, NY.
Iskander, S.M., Rajib, M.A., and Rahman, M.M., 2014: Trending regional precipitation distribution and intensity: use of climatic indices. Atmosph. Climate Sci. 4, 385–393.
https://doi.org/10.4236/acs.2014.43038
Kendall, M.G., 1976: Rank Correlation Methods. 4th Ed. Griffin.
Kirkby, M.J. and Neale, R.H., 1987: A Soil Erosion Model Incorporating Seasonal Factors. In (Ed.
Gardiner V) International geomorphology, Vol. II. John Wiley and Sons Ltd, Chichester: 179–210.
Klein-Tank, A.M.G., Wijngaard, J.B., Können, G.P., Bohm, R., Demare, G., Gocheva, A., Mileta, M., Pashiardis, S., Hejkrlik, L., Kern-Hansen, C., Heino, R., Bessemoulin, P., Muller-Westermeier, G., Tzanakou, M., Szalai, S., Pals-dotir, T., Fitzgerald, D., Rubin, S., Capaldo, M., Maugeri, M., Leitass, A., Bukantis, A., Aberfeld, R., Van Engelen, A.F.V., Forland, E., Mietus, M., Coelho, F., Mares, C., Razuvaev, V., Nieplova, E., Cegnar, T., Lopez, J.A., Dahlstrom, B., Moberg, A., Kirchhofer, W., Ceylan, A., Pachaliuk, O., Alexander, L.V., and Petrovic, P., 2002: Daily dataset of 20th-century surface air temperature and precipitation series for the European Climate Assessment. Int. J. Climatol. 22, 1441–1453. https://doi.org/10.1002/joc.773
Klein-Tank, A.M.G. and Können, G.P., 2003: Trends in indices of daily temperature and precipitation extremes in Europe, 1946–99. J. Climate 16, 3665–3680.
https://doi.org/10.1175/1520-0442(2003)016<3665:TIIODT>2.0.CO;2
Knapp, A. K., Beier, C., Briske, D. D., Classen, A. T., Luo, Y., Reichstein, M., Melinda D. Smith, M.D., Smith, S.D., Bell, J.E., Fay, P.F., Heisler, J.L., Leavitt, S.W., Sherry, R., Smith, B., Weng, E., 2008: Consequences of more extreme precipitation regimes for terrestrial ecosystems. AIBS Bull. 58, 811–821.
Lam, N.S., 1983: Spatial interpolation methods: a review. Amer. Cartogr. 10, 129–149.
https://doi.org/10.1559/152304083783914958
Lambert, A.M., 1971: The making of the Dutch landscape: an historical geography of the Netherlands.
Seminar Press Ltd, 1–412.
Lenderink, G., van Meijgaard, E., and Selten, F., 2009: Intense coastal rainfall in the Netherlands in response to high sea surface temperatures: analysis of the event of August 2006 from the perspective of a changing climate. Clim. Dynam. 32, 19–33.
https://doi.org/10.1007/s00382-008-0366-x
Loureiro, N.D. and Coutinho, M.D., 2001: A new procedure to estimate the RUSLE EI30 index, based on monthly rainfall data and applied to the Algarve region, Portugal. J. Hydrology 250, 12–18.
https://doi.org/10.1016/S0022-1694(01)00387-0
de Luis, M., Gonzales-Hidalgo J.C., and Longares, L.A., 2010: Is rainfall erosivity increasing in Mediterranean Iberian Peninsula. Land Degradat. Develop. 21, 139-144.
de Luis, M., Gonzales-Hidalgo, J.C., Bruneti, M., and Longares, L.A., 2011: Precipitation concentration changes in Spain 1946–2005. Nat. Haz. Earth Syst. Sci. 11, 1259-1265.
https://doi.org/10.5194/nhess-11-1259-2011
Lujan, D.L. and Gabriels, D., 2005: Assessing the rain erosivity and rain distribution in different agro- climatological zones in Venezuela. Sociedade and Natureza- Special Issue 1, 16–29.
Lukić, T., Leščešen, I., Sakulski, D., Basarin, B., and Jordaan, A., 2016: Rainfall erosivity as an indicator of sliding occurrence along the southern slopes of the Bačka loess plateau: a case study of the Kula settlement, Vojvodina (North Serbia). Carpathian J. Earth Environ. Sci. 11, 303–318.
Mann, H.B., 1945: Non-parametric tests against trend. Econometrica 13, 245–259.
https://doi.org/10.2307/1907187
Markantonis, V., Meyer, V., and Schwarze, R., 2012: Valuating the intangible effects of natural hazards-review and analysis of the costing methods. Nat. Haz. Earth Syst. Sci. 12, 1633–1640.
https://doi.org/10.5194/nhess-12-1633-2012
Martınez-Casasnovas, J.A., Ramos, M.C., and Ribes-Dasi, M., 2002: Soil erosion caused by extreme rainfall events: mapping and quantification in agricultural plots from very detailed digital elevation models. Geoderma 105, 125–140. https://doi.org/10.1016/S0016-7061(01)00096-9 Mather, A. S., 1982: The changing perception of soil erosion in New Zealand. Geographic. J.148,
207–218. https://doi.org/10.2307/633772
McCullagh, M.J., 1988: Terrain and surface modelling systems: theory and practice. Photogrammetric Rec. 12, 747–779. https://doi.org/10.1111/j.1477-9730.1988.tb00627.x
Meijer, H., 1985: Compact geography of the Netherlands. ERIC Clearinghouse. Fifth edition.
Mello, C.R., Viola, M.R., Beskow, S., and Norton, L.D., 2013: Multivariate models for annual rainfall erosivity in Brazil. Geoderma 202-203, 88–102. https://doi.org/10.1016/j.geoderma.2013.03.009 Michiels, P., Gabriels, D., and Hartmann, R., 1992: Using the seasonal and temporal precipitation
concentration index for characterizing monthly rainfall distribution in Spain. Catena 19, 43–58.
https://doi.org/10.1016/0341-8162(92)90016-5
Moberg, A., Jones, P. D., Lister, D., Walther, A., Brunet, M., Jacobeit, J., Lisa V. Alexander, Paul M.
Della-Marta, P.M., Luterbacher, J., Yiou, P., Chen, D., Klein Tank, A.M.G., Saladie, O., Sigro, J., Aguilar, E., Alexandersson, H., Almarza, C., Auer, I., Barriendos, M., Begert, M., Bergstrom, H., Bohm, R., Butler, C.J., Caesar, J., Drebs, A., Founda, D., Gerstengarbe, F.W., Micela, G., Maugeri, M., Osterle, H., Pandzic, K., Petrakis, M., Srnec, L., Tolasz, R., Tuomenvirta, H., Werner, P.C., Linderholm, H., Philipp, A., Wanner, H., and Xoplaki, E., 2006: Indices for daily temperature and precipitation extremes in Europe analyzed for the period 1901–2000. J.
Geophys. Res.: Atmospheres 111, D22106.https://doi.org/10.1029/2006JD007103 Oduro-Afriyie, K., 1996: Rainfall erosivity map for Ghana. Geoderma 74, 161–166.
https://doi.org/10.1016/S0016-7061(96)00054-7
Oliver, J.E., 1980: Monthly precipitation distribution: A comparative index. Prof. Geographer 32, 300–309. https://doi.org/10.1111/j.0033-0124.1980.00300.x
Pilz, J. and Spöck, G., 2007: Why Do We Need and How Should We Implement Bayesian Kriging Methods. Stoch. Environ. Res. Risk Assess. 22, 621–632.
Rawat, P.K., Tiwari, P.C., Pant, C.C., Sharama, A.K., and Pant, P.D., 2011: Modelling of stream run- off and sediment output for erosion hazard assessment in Lesser Himalaya: need for sustainable land use plan using remote sensing and GIS: a case study. Nat. Hazards 59, 1277–1297.
https://doi.org/10.1007/s11069-011-9833-5
Renard, K.G. and Freimund, J.R., 1994: Using monthly precipitation data to estimate the r-factor in the revised USLE. J. Hydrology 157, 287–306. https://doi.org/10.1016/0022-1694(94)90110-4 Renes, J., 1988: De geschiedenis van het Zuidlimburgse Cultuurlandschap. Van Gorcum, Assen.
Schmidli, J., Goodess, C.M., Frei, C., Haylock, M.R., Hundecha, Y., Ribalaygua, J., and Schmith, T.
2007: Statistical and dynamical downscaling of precipitation: An evaluation and comparison of scenarios for the European Alps. J. Geophys. Res.: Atmospheres 112, D04105.
Sfîru, R., Cârdei, P., Herea, V., and Ertekin, C., 2011: Calculation of rainfall erosion intensity (rainfall erosivity) in Valea Călugărească wine growing area. INMATEH – Agric. Engin. 34, 23–28.
Trenberth, K.E., Jones, P.D., Ambenje, P., Bojariu, R., Easterling, D., Tank, A.K., Parker, D., Rahimzadeh, F., Renwick, J.A., Rusticucci, M., Soden, B. and Zhai, P., 2007: Observations:
Surface and Atmospheric Climate Change, chap. 3 of Climate Change 2007: The Physical Science Basis. In (Eds. Solomon, S., Qin, D., Manning, M., Marquis, M., Averyt, KB, Tignor, M., Miller, HL and Chen, Z.) Contribution of Working Group I to the Fourth Assessment Report of the Intergovernmental Panel on Climate Change. 235–336.
Trenberth, K. E., 2011: Changes in precipitation with climate change. Climate Res. 47, 123–138.
https://doi.org/10.3354/cr00953
Vallejo, V.R., Diaz-Fierros, F., and De la Rosa, D., 2005: Impactos sobre los recursos edaficos. In (Ed. Moreno, J.M.) Evaluacion Preliminar General de Los Impactos en Espanapor Efecto del Cambio Climatico. Ministerio de Medio Ambiente: Madrid. (In Spain)
Van den Hurk, B., Siegmund, P., Klein-Tank, A., Attema, J., Bakker, A., Beersma, J., Bessembinder, J., Boers, J., Brandsma, T., van den Brink, T., Drijfhout, S., Eskes, H., Haarsma, R., Hazeleger, W., Jilderda, R., Katsman, C., Lenderink, G., Loriaux, J., van Meijgaard, E., van Noije, T., van Oldenborgh, G., Selten, F., Siebesma, P., Sterl, A., de Vries, H., van Weele, M., de Winter, R., and van Zadelhoff, G., 2015: KNMI14: climate change scenarios for the 21st century. Technical report, Technical report Royal Netherlands Meteorological Institute, The Netherlands.
Van Haren, R., Oldenborgh, G., Lenderink, G., Collins, M., and Hazeleger, W., 2013: SST and circulation trend biases cause an underestimation of European precipitation trends. Clim.
Dynam. 40, 1–20. https://doi.org/10.1007/s00382-012-1401-5
Van Minnen, J., Ligtvoet, W., van Bree, L., de Hollander, G., Visser, H., van der Schrier, G., and Klein- Tank, A.M.G., 2013: The effects of climate change in the Netherlands 2012. PBL, Utrecht.
Van Oldenborgh, G.J., and Van Ulden, A.A.D., 2003: On the relationship between global warming, local warming in the Netherlands and changes in circulation in the 20th century. Int. J.
Climatol.23, 1711–1724. https://doi.org/10.1002/joc.966
Von Storch H. and Navarra, A., 1995: Analysis of Climate Variability Applications of Statistical Techniques. Springer-Verlag Berlin Heidelberg New York.
https://doi.org/10.1007/978-3-662-03167-4
Watson, D.F. and Philip, G.M., 1987: Neighbourhood based interpolation. Geobyte 2, 12–16.
Wijngaard, J.B. and Klein-Tank, A.M., Können, G.P., 2003: Homogeneity of 20th century European Daily Temperature and Precipitation series. Int. J. Climatol. 23, 679–692.
Winteraeken, H. J., Spaan, W. P., 2010: A new approach to soil erosion and runoff in south Limburg - The Netherlands. Land Degradat. Develop. 21, 346–352.
Wischmeier, W.H. and Smith, D.D., 1978: Predicting Rainfall Erosion losses – A Guide to Conservation Planning, Agriculture Handbook. USDA. Washington, 1–51.
Yue, B.J., Shi, Z.H., and Fang, N.F., 2014: Evaluation of rainfall erosivity and its temporal variation in the Yanhe River catchment of the Chinese Loess Plateau. Nat. Hazards 74, 585.
Yue, S., Pilon, P., Phinney, B., and Cavadias, G., 2002: The influence of autocorrelation on the ability to detect trend in hydrological series. Hydrol. Proc. 16, 1807–1829.