DOI:10.28974/idojaras.2018.4.3
IDŐJÁRÁS
Quarterly Journal of the Hungarian Meteorological Service Vol. 122, No. 4, October – December, 2018, pp. 393–408
Wind speed and direction on the Polish Baltic coast and conditions for recreation
Czesław Koźmiński1 and Bożena Michalska2*
1Department of Tourism and Recreation, University of Szczecin, Mickiewicza 16, 70-383 Szczecin, Poland,
2Department of Meteorology and Green Areas Management, West Pomeranian University of Technology in Szczecin.
Papieża Pawła VI 3, 71-459 Szczecin,Poland,
Corresponding author E-mail: bozena.michalska@zut.edu.pl (Manuscript received in final form November 15, 2017)
Abstract⎯ Using the results of daily measurements of wind from 6 meteorological stations (Świnoujście, Kołobrzeg, Koszalin, Ustka, Łeba, Hel) operated by the Institute of Meteorology and Water Management of Poland (IMGW) for the period 2000–2016, the study presents the assessment of temporal and spatial variation of wind speed and direction on the Polish Baltic coast with respect to conditions for recreation and tourism.
For the purpose of assessing bioclimatic conditions, additional measurements were taken at 12 UTC in the period 2006–2015, which provided grounds for determination of thermal sensation using Hill’s index and heat load experienced by a person staying at the seaside. The analysis of wind speed and direction on the Polish Baltic coast shows high spatial variability and variation, which determines the stimuli character of this region.
Considering thermal sensation expressed with Hill’s index, the most favorable conditions for recreation on the Polish Baltic coast occur in the Bay of Pomerania and the Bay of Gdańsk, favorable conditions are recorded in the area of Rewal to Dąbki, and less favorable in the area of Darłowo to Władysławowo.
Key-words: wind, the Baltic sea coast, speed, direction, load, thermal sensations
1. Introduction and aims
Wind speed is a significant element of bioclimatic conditions of a given area, particularly the Baltic coastal zone – in addition to sunshine duration, air, and water temperature. Wind can further aggravate thermal discomfort in the case of low air temperature, as well as increase thermal comfort in the conditions of high air temperature and humidity. Therefore, wind speed recorded in a given area determines the conditions of aerotherapy as being mild, stimulating, or loaded (Kozłowska-Szczęsna et al., 2002; Koźmiński and Michalska, 2011;
Chojnacka-Ożga, 2013). The classification by Knoch (Jankowiak and Parczewski, 1978) is used in bioclimatology to describe the wind speed of 0.0–1.0 ms–1 as calm, 1.1–4.0 ms–1 as light, 4.1–8.0 ms–1 as moderate, and >8.0 ms–1 as strong wind causing negative effects on the human organism. The wind of moderate speed (4.1–8.0 ms–1) has a positive effect on the human organism in summer, as it results in a micromassage of exposed body area leading to the improvement of thermoregulatory mechanisms (Bogucki, 1999; Kozłowska- Szczęsna et al., 1997).
In comparison to the southern regions of Poland (apart from the mountain area), mean wind speed on the Baltic coastal zone is by 1.0–2.5 ms–1 higher, particularly in winter and spring (Koźmiński and Michalska, 2002). The Baltic coast area is characterized by particularly strong stimuli due to heavy wind, significant air cooling power, relatively low subjective temperature, and large weather variations (Kozłowska-Szczęsna et al., 2002; Szyga-Pluta, 2011). According to Woś (1999), the coastline is marked by the highest frequency of days with cool and cloudy weather, as well as cool weather without precipitation. High wind speed contributes to formation of waves on the surface of the sea, and intensifies wave breaking in the coastal zone, which results in an increased release of aerosols and oxygen to the atmosphere. Particularly during storm, the aerosols are enriched with iodine, selenium, calcium, magnesium, bromine, and other microelements significant to human health (Garbalewski, 1999; Marks, 2016).
High wind speed (>3 ms–1) is favored for water sports, e.g., sailing, windsurfing, or kitesurfing, which are becoming increasingly popular among tourist spending their vacation on the seaside or lakes. The appeal of this particular form of recreation often results in an increased health risk, as the wave of more than 1 m in height may lead to water aspiration, exhaustion, or cramps while swimming (Zalewski, 2016). The wind speed considered to be favorable for windsurfing ranges from approximately 3 to 6 ms–1, and as much as from 6 to 8 ms–1 for the more experienced surfers. Participating in water sports activities depends not only on wind speed, but also on its direction, e.g., wind along, towards or from the coastline. Particular wind direction has an effect on
water temperature at the beach and the phenomenon of upwelling, which is especially present in the region of Kołobrzeg, Łeba, and Władysławowo.
At the border of two environments, such as water and land, weather conditions show high variability, including speed and direction of wind, formation of sea breeze transporting oxygen and aerosols from the sea towards the beach (Marks, 2016). Considering the energy of wind, this element is included in various indices and bioclimatic models, such as the heat balance of the human body.
The aim of the present paper is the analysis of temporal and spatial (Matzarakis, 2006; Błażejczyk and Kunert, 2011) distribution of wind speed and direction on the Polish Baltic sea coast with respect to conditions of recreation.
2. Materials and methods
The study makes use of daily measurements of wind speed and direction recorded in the period 2000–2006, obtained from six of the Institute of Meteorology and Water Management of Poland (IMGW) meteorological stations located in Świnoujście (dune), Kołobrzeg (residential area), Ustka, Łeba, and Hel (in the vicinity of a beach), and Koszalin (airport). The characteristics of wind speed is presented using mean and extreme values and coefficient of variation.
Additionally, wind speed is analyzed per seasons of a year according to the 12-grade Beaufort scale. For the purpose of analyzing tourism and water sports the following wind speed classification was adopted: 3–5, 6–8, and >8 ms–1. 16 wind directions were taken into account in the study, and monthly frequencies of individual directions were illustrated in figures per selected stations. The assessment of the effect of wind on the human organism and conditions for recreation was made using the Hill’s index taking into account wind speed and air temperature values measured at 12 UTC in the period 2006–2015. Thermal sensation was determined using the scale by Petrovič and Kacvinsky (Table 1) and the heat load according to the scale by Conrad (Table 2), (Błażejczyk and Kunert, 2011).
For the purpose of establishing the dates of the beginning, termination and duration of periods with given heat load conditions (Conrad scale), mean values of the Hill’s index were determined for subsequent days in a year (12 UTC), and the trend lines were identified in the form of polynomial of degree 5.
Table 1. Petrovič and Kacvinsky scale
H [Wm–2] Thermal sensation
≤ 210.0 very hot 210.1–420.0 hot 420.1–630.0 mild
630.1–840.0 slightly cool 840.1–1260.0 cool
1260.1–1680.0 cold
1680.1–2100.0 very cold
2100.1< extremely cold and windy
Table 2. Conrad scale
H [Wm–2] Heat load
≤ 420.0 risk of hyperthermia 420.1–840.0 mild conditions (comfort) 840.1–1260.0 slightly loaded conditions
1260.1–1680.0 strongly loaded conditions 1680.1< risk of hypothermia
3. Results and discussion
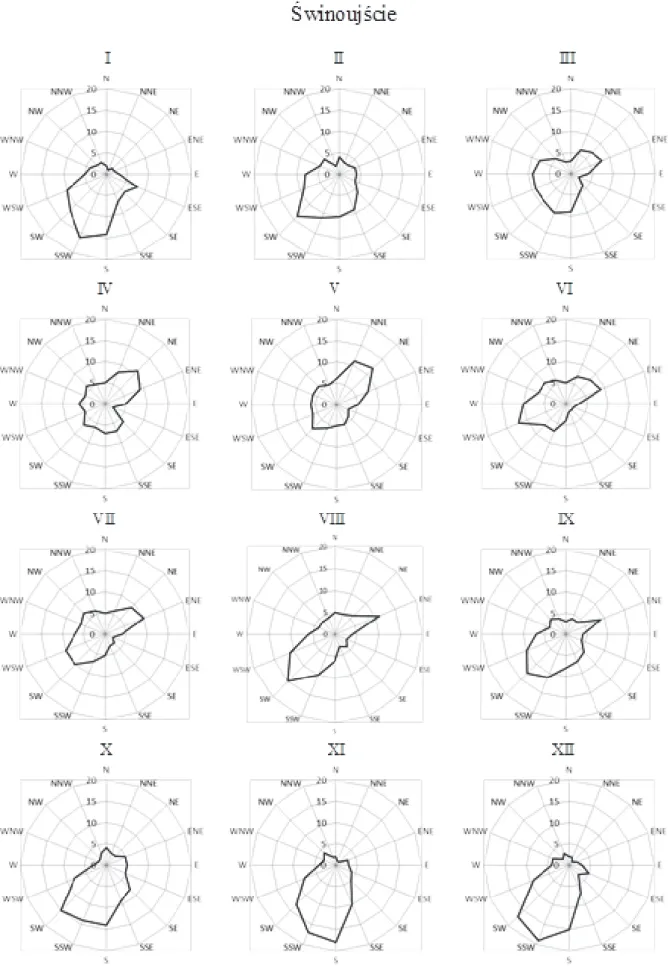
On the Polish Baltic coast, in a year, the most prevalent direction of wind is from the south-west, west, and north-east, yet there is a clear variation as to wind direction between the stations and seasons (Fig. 1). In the area of Świnoujście, from August till March, the wind from the south-west prevails, while from April to July there is a marked increase in the frequency of the wind from the north-east direction. The least frequent is the wind from the north, in particular from October till February. The stations in Łeba show slightly different distribution of wind direction frequencies, as from March till September, the most frequent is the wind from the west, and in April and May –
also from the north-east. In the autumn and winter months, the wind from the south-west is recorded most frequently, and the wind from the north and east is recorded least frequently.
Spatial variability of wind speed on the Polish Baltic coast is greater between the analyzed stations than the temporal variability between the individual months (Table 3). In the cold half-year (October-March), the seaside is characterized by wind which is often accompanied by air temperature considered low for a given period. This combination causes a significant inconvenience for tourists involved in leisure activities such as hiking, cycling, and others (Koźmiński and Michalska, 2004). In the conditions of low air temperature and high humidity, an increase in wind speed results in aggravation of the feeling of chill. This discourages tourist from walking along the beach despite the fact that the increase in wind speed and formation of waves at the shoreline fosters release of aerosols and oxygen (Garbalewski, 1999; Marks, 2016). Along the Polish Baltic coast, the winds from the south-west and west are predominant. Mean annual speed in Świnoujście amounts to 3.2 ms–1 and increases in Ustka to 5.3 ms–1(Table 3). The biggest difference in monthly wind speed between Świnoujście and Ustka are marked from October to February – more than 2.0 ms–1, and in December and January even more than 2.6 ms–1. In the cold half-year, wind speed can be as high as several meters per second in the western and central part of the coast, and approximately 20 meters per second in the eastern part. The lowest spatial variability in monthly wind speed between the eastern and western part of the coastline was found in May – 1.5 ms–1. The amplitudes between the lowest and the highest mean monthly wind speed in a year range from 0.7 ms–1 in Świnoujście to 1.3 ms–1 in Hel. Significant variability in wind speed from one year to another was found for the station in Świnoujście, whereas the station in Hel shows the lowest variability.
Considering the values of coefficient of variation presented in Table 3, a tourist coming to the seaside should expect high fluctuation in wind speed from one day to another.
Fig. 1. Frequency (%) of days with particular wind direction according to months in Świnoujście and Łeba in the period of 2000–2016.
Fig. 1. (Continued from the previous page.)
Table 3. Mean daily (a), maximum (b), and minimum (c) values and coefficient of variability (d) according to months in the period of 2000–2016
Station Jan Feb Mar Apr May June July Aug Sept Oct Nov Dec Jan- Dec Świnoujście
a 3.3 3.3 3.6 3.5 3.2 3.2 3.1 2.9 3.1 3.0 3.0 3.2 3.2 b 13.6 11.0 13.4 12.3 14.4 10.6 11.5 10.2 12.5 13.9 12.1 13.2 12.4 c 0.6 0.5 0.8 1.0 0.4 1.0 1.1 0.8 0.6 0.5 0.4 0.6 0.7 d 47.7 55.7 54.8 55.3 52.2 47.9 47.2 45.4 57.6 59.2 53.1 49.1 52.1 Kołobrzeg
a 3.8 3.7 3.6 3.4 3.0 3.0 2.9 2.8 2.8 2.8 3.4 3.7 3.2 b 12.9 10.6 11.3 12.5 8.5 10.9 12.3 10.7 13.6 9.9 12.3 11.6 11.4 c 0.5 0.6 0.8 0.9 0.6 1.0 0.8 0.5 0.6 0.6 0.3 0.3 0.6 d 51.3 48.2 45.2 44.4 42.0 49.0 50.0 54.2 58.1 51.5 52.7 46.2 49.4 Koszalin
a 3.8 3.6 3.5 3.3 3.0 3.1 2.9 2.8 2.8 2.9 3.5 3.6 3.2 b 10.0 10.3 9.7 9.8 8.0 9.2 8.3 8.8 9.1 9.5 10.7 11.5 9.6 c 0.4 0.3 1.0 0.8 0.8 0.8 0.9 0.9 0.4 0.0 0.5 0.0 0.6 d 48.5 45.4 44.8 40.6 37.7 39.1 36.0 37.8 41.7 46.5 44.0 43.3 42.1 Ustka
a 5.9 5.6 5.6 5.1 4.7 5.0 4.7 4.7 5.0 5.2 5.5 5.8 5.3 b 16.7 14.8 13.8 17.3 15.4 13.3 13.0 13.9 18.3 21.0 17.4 20.8 16.3 c 1.2 0.4 0.9 0.8 1.0 1.7 1.5 1.4 1.4 1.7 1.5 0.8 1.2 d 47.1 46.6 44.0 43.9 42.0 41.0 38.1 40.3 44.9 48.5 48.5 44.4 44.1 Łeba
a 5.4 5.1 5.0 4.4 4.3 4.7 4.3 4.2 4.2 4.4 4.8 5.2 4.7 b 16.7 16.5 16.7 13.3 12.1 14.0 12.8 14.3 12.1 13.9 13.9 14.4 14.2 c 0.8 0.1 0.6 1.1 1.2 1.5 0.5 0.4 0.9 0.6 0.4 0.4 0.7 d 56.3 57.1 51.1 47.2 46.0 47.1 45.5 47.5 47.7 51.4 51.4 51.0 49.9 Hel
a 4.6 4.2 3.9 3.4 3.3 3.5 3.3 3.4 3.7 4.0 4.4 4.5 3.9 b 8.8 7.7 7.6 6.1 5.9 6.3 5.7 6.6 6.8 7.0 7.8 10.5 7.2 c 2.1 1.7 1.8 1.8 1.9 1.9 1.8 1.8 1.9 1.7 1.9 1.1 1.8 d 36.0 35.9 35.0 29.9 27.6 30.8 29.0 32.1 32.8 35.0 32.8 35.0 32.7
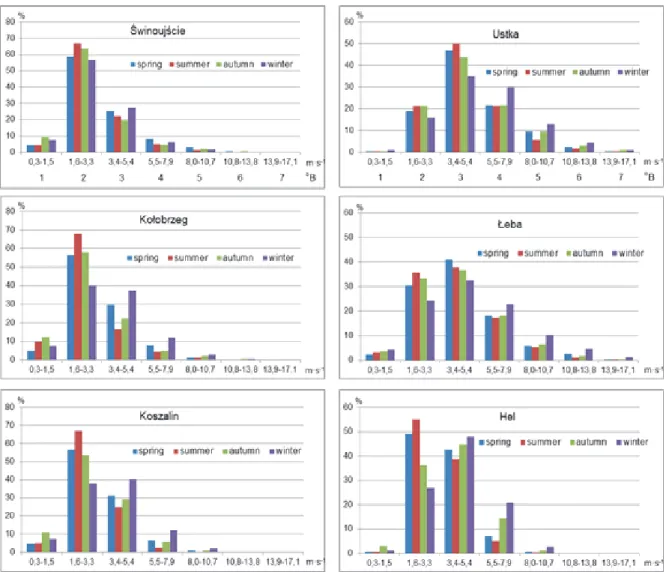
Those, who practice water sports such as windsurfing or kitesurfing, often adopt wind speed assessment according to the Beaufort scale. In the western and central part of the Polish Baltic sea, wind speed from 1.6 to 3.3 ms–1 (2oB) is the most frequent, and in the eastern section of the coast (stations in Ustka and Łeba) – the wind speed is from 3.4 to 5.4 ms–1 (3oB). The station in Hel shows occurrence of both scale 2 and 3 winds (Fig. 2). It must be emphasized, that in the area of Ustka and Łeba, strong wind of more than 8 ms–1 shows higher mean frequency – approximately 10% of the total number of days per season. In summer, wind below 3.4 ms–1 is prevalent on the entire coast. In winter, higher frequency of days with wind speed over 3.3 ms–1 is recorded in the western and central section, of the coast, and wind speed over 5.4 ms–1 in the east. According to data presented in Fig. 2, the area of Ustka, Łeba and Władysławowo is characterized by the most favorable conditions for water sports on the Polish Baltic coast, whereas the area of Świnoujście shows less favorable conditions.
Fig. 2. Frequency (%) of daily wind of various speed values according to the Beaufort scale in four seasons of a year in the period of 2000–2016.
Data from 12 UTC, i.e., the time of high tourist activity, is used in bioclimatology for the assessment of meteorological conditions for recreation.
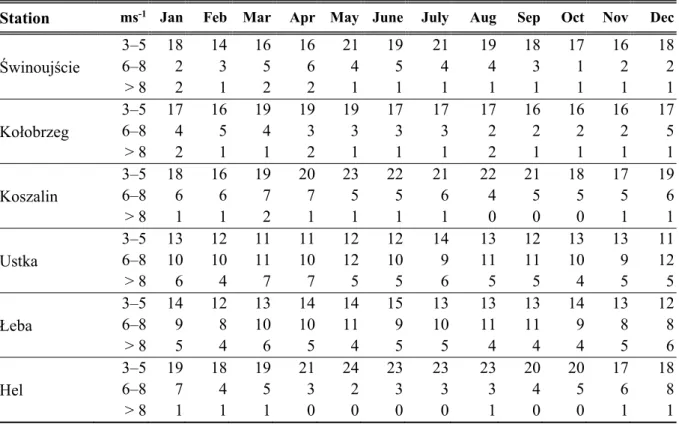
The wind speed recorded on the coastal zone at 12 UTC is generally 3–5 ms–1. Such wind is considered mild and shows the highest frequency in the warm half- year, on average 20 to 24 days per month in Hel, 16 to 20 days in Świnoujście, and significantly less, 11 to 14 days in Ustka (Table 4). A high average number of days with mid wind speed can also result from a frequent occurrence of sea breeze of average speed of 5 ms–1 (Radomski, 1987). The moderate wind speed of 6–8 ms–1 is most frequently recorded in Ustka and Łeba – 8–12 days, less frequently in Hel – 2–8 days, and very rarely in Świnoujście and Kołobrzeg – 1–6 days in a month. The wind speed of more than 8 ms–1 is recorded mainly in the stations located in Ustka and Łeba, on average 4–7 days in a month. Such wind speed values, particularly when combined with low air temperature, may
discourage from leisure activities (walks along the beach) in the northern part of the coastline. According to Araźny et al., (2007), wind speed values >8 ms–1 recorded in Central Europe show a statistically significant increase in the number of days by 0.7 days for 10 years, which results in increasing frequency of extreme weather phenomena. In the western and central part of the Baltic coast, wind speed >8 ms–1 taken at 12 UTC is recorded sporadically, on average 1 to 2 days in a month, yet, as the study by Tarnowska (2011) shows, between 12 and 3 p.m. on particular days, there is a risk of increased occurrence of strong wind. Data presented in Table 4 show increased stimuli of the bioclimate in the northern sector of the Baltic coast from Darłowo to Władysławowo, where in the summer season, the temperature of seawater is below 14 °C. One of the safety criteria of mini swimming marathons is the water temperature which must be above 14 °C, preferably over 18 °C, and the wind speed must be below 5 on the Beaufort scale.
Table 4. Mean number of days with wind speed 3–5, 6–8, and > 8 ms–1 at 12 UTC according to months in the period of 2006–2015
Station ms-1 Jan Feb Mar Apr May June July Aug Sep Oct Nov Dec 3–5 18 14 16 16 21 19 21 19 18 17 16 18
Świnoujście 6–8 2 3 5 6 4 5 4 4 3 1 2 2
> 8 2 1 2 2 1 1 1 1 1 1 1 1
3–5 17 16 19 19 19 17 17 17 16 16 16 17
Kołobrzeg 6–8 4 5 4 3 3 3 3 2 2 2 2 5
> 8 2 1 1 2 1 1 1 2 1 1 1 1
3–5 18 16 19 20 23 22 21 22 21 18 17 19
Koszalin 6–8 6 6 7 7 5 5 6 4 5 5 5 6
> 8 1 1 2 1 1 1 1 0 0 0 1 1
3–5 13 12 11 11 12 12 14 13 12 13 13 11 Ustka 6–8 10 10 11 10 12 10 9 11 11 10 9 12
> 8 6 4 7 7 5 5 6 5 5 4 5 5
3–5 14 12 13 14 14 15 13 13 13 14 13 12
Łeba 6–8 9 8 10 10 11 9 10 11 11 9 8 8
> 8 5 4 6 5 4 5 5 4 4 4 5 6
3–5 19 18 19 21 24 23 23 23 20 20 17 18
Hel 6–8 7 4 5 3 2 3 3 3 4 5 6 8
> 8 1 1 1 0 0 0 0 1 0 0 1 1
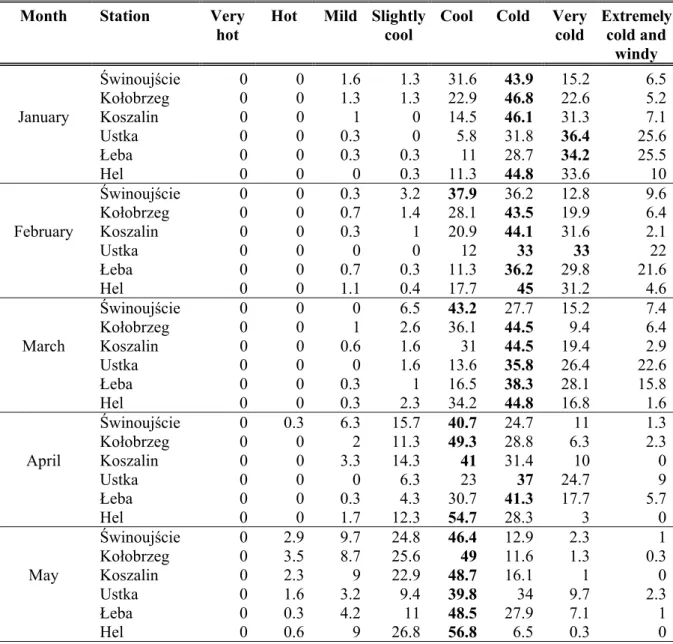
The data (Table 5), obtained using Hill’s index and thermal sensation scale by Petrovič and Kacvinsky show that sensations of a person staying on the coast in a year may range from very hot in July and August to extremely cold and windy in the period from November to April. However, most frequent thermal sensations is cool in late spring and early autumn, followed by cold in the cold half year.
Thermal sensation termed slightly cod and mild occur most frequently in the warm
half-year, particularly from June to August. The frequency of days with thermal sensation slightly cold is highest in June – 42.0% in Hel, 36.7% in Kołobrzeg, and 36% in Świnoujście. Thermal sensation mild is prevalent in July, and in Świnoujście and Hel also in August, whereas in Ustka and Łeba the predominant thermal sensation in July is cool. Considering the values of air cooling power expressed with the Hill’s index, favorable bioclimatic conditions for recreation occur in the western part of the coast and the Bay of Gdańsk. The conditions are less favorable in the area of Ustka to Władysławowo. In summer, August is marked by days with thermal comfort (classes slightly cold and mild) in Świnoujście, Kołobrzeg, and Hel from 65% to 78%, and only 46.2% in Ustka (Table 5).
Table 5. Frequency (%) of days with thermal sensations experienced by a person staying on the seaside, determined with the use of the value of air cooling power index H (data from 12 UTC)
Month Station Very hot
Hot Mild Slightly cool
Cool Cold Very cold
Extremely cold and
windy
Świnoujście 0 0 1.6 1.3 31.6 43.9 15.2 6.5
Kołobrzeg 0 0 1.3 1.3 22.9 46.8 22.6 5.2 January Koszalin 0 0 1 0 14.5 46.1 31.3 7.1
Ustka 0 0 0.3 0 5.8 31.8 36.4 25.6
Łeba 0 0 0.3 0.3 11 28.7 34.2 25.5
Hel 0 0 0 0.3 11.3 44.8 33.6 10
Świnoujście 0 0 0.3 3.2 37.9 36.2 12.8 9.6
Kołobrzeg 0 0 0.7 1.4 28.1 43.5 19.9 6.4 February Koszalin 0 0 0.3 1 20.9 44.1 31.6 2.1
Ustka 0 0 0 0 12 33 33 22
Łeba 0 0 0.7 0.3 11.3 36.2 29.8 21.6
Hel 0 0 1.1 0.4 17.7 45 31.2 4.6
Świnoujście 0 0 0 6.5 43.2 27.7 15.2 7.4
Kołobrzeg 0 0 1 2.6 36.1 44.5 9.4 6.4 March Koszalin 0 0 0.6 1.6 31 44.5 19.4 2.9 Ustka 0 0 0 1.6 13.6 35.8 26.4 22.6
Łeba 0 0 0.3 1 16.5 38.3 28.1 15.8
Hel 0 0 0.3 2.3 34.2 44.8 16.8 1.6
Świnoujście 0 0.3 6.3 15.7 40.7 24.7 11 1.3
Kołobrzeg 0 0 2 11.3 49.3 28.8 6.3 2.3 April Koszalin 0 0 3.3 14.3 41 31.4 10 0
Ustka 0 0 0 6.3 23 37 24.7 9
Łeba 0 0 0.3 4.3 30.7 41.3 17.7 5.7
Hel 0 0 1.7 12.3 54.7 28.3 3 0
Świnoujście 0 2.9 9.7 24.8 46.4 12.9 2.3 1
Kołobrzeg 0 3.5 8.7 25.6 49 11.6 1.3 0.3 May Koszalin 0 2.3 9 22.9 48.7 16.1 1 0
Ustka 0 1.6 3.2 9.4 39.8 34 9.7 2.3
Łeba 0 0.3 4.2 11 48.5 27.9 7.1 1
Hel 0 0.6 9 26.8 56.8 6.5 0.3 0
Table 5. (Continued from the previous page)
Month Station
Very hot
Hot Mild Slightly cool
Cool Cold Very cold
Extremely cold and
windy
Świnoujście 0 6 19.7 36 31 7 0.3 0
Kołobrzeg 0 4.3 17.7 36.7 33.7 7 0.6 0 June Koszalin 0 4.7 17.7 28.3 44 5 0.3 0 Ustka 0 0.7 7 18.6 49.7 21.3 2.7 0
Łeba 0 1.3 7.7 21.1 49.2 19.1 1.7 0
Hel 0 1 22.3 42 32.7 2 0 0
Świnoujście 2.7 12.9 34.4 32.7 17.1 0.6 0 0
Kołobrzeg 1 11.7 35.9 31.7 16.8 2.9 0 0 July Koszalin 1.9 11.7 29.5 27.8 27.2 1.9 0 0 Ustka 1 3.9 20.1 24.6 42.7 7.7 0 0
Łeba 1.6 6.2 17.3 27.4 39.4 7.8 0.3 0
Hel 0.7 9.4 39.4 32.9 16.3 1.3 0 0
Świnoujście 1.3 9 38.1 35.5 15.5 0.6 0 0
Kołobrzeg 1.3 11.6 31.3 33.9 18.7 3.2 0 0 August Koszalin 1 11 31.7 29.7 25.8 1 0 0 Ustka 0.3 5.2 18.1 28.1 42.2 6.1 0 0
Łeba 0.3 5.5 19.2 30.2 38.0 6.5 0.3 0
Hel 0 5.2 42.3 36.1 15.8 0.6 0 0
Świnoujście 0 2.3 26.0 28.7 35.4 7.3 0.3 0
September Kołobrzeg 0 3.0 25.1 34.4 31.8 5.0 0.7 0 Koszalin 0 1.0 19.3 29.0 45.0 5.7 0 0 Ustka 0 0.7 10.0 19.1 44.2 24.4 1.3 0.3
Łeba 0 0 8.7 21.3 50.0 19.3 0.7 0
Hel 0 0.3 14.0 39.0 43.0 3.7 0 0
Świnoujście 0 0 8.7 25.8 52.9 9.0 2.3 1.3
Kołobrzeg 0 0 7.1 27.4 53.6 10 1.9 0 October Koszalin 0 0.3 3.5 15.6 60.6 19.4 0.6 0 Ustka 0 0 3.2 6.1 48.5 31.9 9.0 1.3
Łeba 0 0 1.6 8.4 45.9 36.9 6.5 0.7
Hel 0 0 1.9 15.8 57.1 22.6 2.6 0
Świnoujście 0 0 1.0 15.0 52.3 24.3 4.7 2.7
Kołobrzeg 0 0 0.6 9.0 52.4 29.3 7.0 1.7 November Koszalin 0 0 0.6 3.3 36.9 45.8 12.4 1.0
Ustka 0 0 0 2.0 27.4 41.9 22.7 6.0
Łeba 0 0 1.0 2.7 29.4 37.8 24.4 4.7
Hel 0 0 0.7 3.3 36.8 45.8 12.4 1.0
Świnoujście 0 0 0.3 3.5 44.9 40.0 7.1 4.2
December Kołobrzeg 0 0 1.3 2.6 28.7 48.7 16.8 1.9 Koszalin 0 0 1.0 1.6 21.0 54.2 18.7 3.5
Ustka 0 0 0 0.3 11.3 32.9 42.6 12.9
Łeba 0 0 1.0 1.3 12.9 34.9 34.7 15.2
Hel 0 0 0.3 1.0 18.7 51.3 22.3 6.4
By way of example, the course of mean values of the Hill’s index according to days (12 UTC) in a year is presented in Fig. 3 for two stations
(Świnoujście and Łeba). The largest variation from one day to another is recorded in the period from November to May, particularly in February and March, and the smallest in the summer season, from June to August. Even though the results for the period of 10 years are given as average, in many instances the variations in the values at both stations occur on the same days.
According to the Conrad scale, the heat load in the cold half-year may shift within a few days from strongly loaded to slightly loaded conditions, and vice versa. In summer, the fluctuations from one day to another are markedly smaller and within the category of mild conditions.
Fig. 3. The course of daily Hill’s index values in a year in Świnoujście and Łeba with indicated dates of occurrence of particular heat load according to the Conrad scale in the period of 2006–2015.
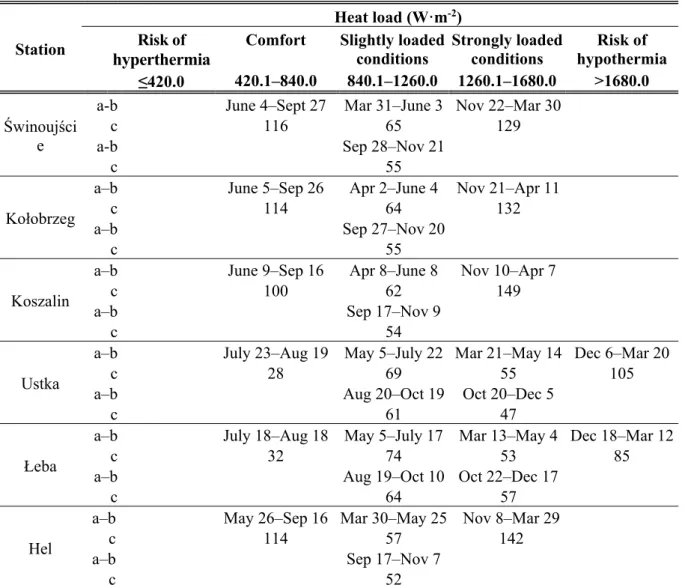
For the purpose of assessment of bioclimatic conditions, the dates of beginning and termination of particular heat loads in the coastal zone were
determined from the trend lines for the six analyzed stations (Table 6). In a year, in the western part of the coast and the Bay of Gdańsk, the period with strongly loaded conditions shows the longest duration, from 129 days in Świnoujście to 142 days in Hel, whereas in the northern part of the coast, the number of days amounts to 102 in Ustka and 110 in Łeba. However, the stations in Ustka and Łeba are marked by additional occurrence of heat load category risk of hypothermia, from 85 days in Łeba to 105 days in Ustka. Relatively low spatial variation in a year is recorded in a period with slightly loaded conditions, from 109 days in Hel to 138 days in Łeba. The most favorable bioclimatic conditions for the human organism are the conditions with heat load termed as mild (comfort). Duration of a period with such conditions is the longest, i.e., more than 110 days in the western and central part of the coast and in the area of Hel, whereas in Ustka and Łeba, the duration is four times shorter, 28 and 32 days, respectively (Table 6).
Table 6. Mean date of beginning (a), termination (b), and the duration (in days) (c) of periods with heat load according to the Conrad scale in the period of 2006–2015
Station
Heat load (W·m-2) Risk of
hyperthermia
≤420.0
Comfort 420.1–840.0
Slightly loaded conditions 840.1–1260.0
Strongly loaded conditions 1260.1–1680.0
Risk of hypothermia
>1680.0
Świnoujści e
a-b c a-b c
June 4–Sept 27 116
Mar 31–June 3 65 Sep 28–Nov 21
55
Nov 22–Mar 30 129
Kołobrzeg a–b
c a–b c
June 5–Sep 26 114
Apr 2–June 4 64 Sep 27–Nov 20
55
Nov 21–Apr 11 132
Koszalin a–b
c a–b c
June 9–Sep 16 100
Apr 8–June 8 62 Sep 17–Nov 9
54
Nov 10–Apr 7 149
Ustka
a–b c a–b c
July 23–Aug 19 28
May 5–July 22 69 Aug 20–Oct 19
61
Mar 21–May 14 55 Oct 20–Dec 5
47
Dec 6–Mar 20 105
Łeba
a–b c a–b c
July 18–Aug 18 32
May 5–July 17 74 Aug 19–Oct 10
64
Mar 13–May 4 53 Oct 22–Dec 17
57
Dec 18–Mar 12 85
Hel
a–b c a–b c
May 26–Sep 16 114
Mar 30–May 25 57 Sep 17–Nov 7
52
Nov 8–Mar 29 142
4. Conclusion
In summer, in the western part of the coast, the prevalent direction of wind is from the south-west and north-east, while in the central and eastern part it is from the west and north-east. In the winter months, the coastal zone is characterised by wind from the south-west.
Mean annual wind speed shows an increase from the west to the east, from 3.2 ms–1 in Świnoujście to 5.3 ms–1 in Ustka, reaching its highest values in the cold half-year, when in the eastern part of the coast, wind speeds in a day exceeds 20 ms–1.
In the western and central parts of the Polish Baltic coast, the most frequently recorded daily wind speed is from 1.6 to 3.3 ms–1 (2°B), and in the eastern part represented by the stations in Ustka and Łeba the prevalent daily wind speed is from 3.4 to 5.4 ms–1 (3°B). The area of Hel is marked by the occurrence of wind of both Beaufort scales (2 and 3).
Wind speed recorded on the coast at 12 UTC is mostly from 3 to 5 ms–1, and in the area of Ustka and Łeba, it is 6–8 ms–1. Such wind speed values create conditions which facilitate taking part in water sports activities in the warm half year, though the frequent occurrence of cool days in summer may create unfavorable conditions for outdoor activities.
In summer, the most frequently recorded heat load on the coast is the mild (comfort) category and slightly loaded conditions, although on individual days, there may occur strongly loaded conditions. In winter, the dominant atmospheric conditions range from strongly loaded to risk of hypothermia.
Among several heat load categories recorded on the coast, mild conditions show the greatest spatial variation in terms of duration, from 28 in the area of Ustka to 116 in Świnoujście. In the analyzed period, the weather condition risk of hyperthermia were recorded only sporadically.
Taking into consideration the thermal sensation expressed with the Hill’s index, the most favorable conditions for recreation on the Polish Baltic coast occur in the Bay of Pomerania and the Bay of Gdańsk, favorable conditions are recorded in the area of Rewal to Dąbki, and less favorable in the area of Darłowo to Władysławowo.
References
Araźny, A.; Przybylak, R.; Vízi, Z.; Kejna, M.; Maszewski, R.; and Uscka-Kowalkowska, J., 2007:
Mean and Extreme Wind Velocities in Central Europe 1951–2005 on The Basis of Data from NCEP/NCAR Reanalysis. Extreme hydrometeorological events in Poland and their impact Europan context. Faculty of Earth Scientes University of Silesia. Geographia Polonica 80, 69–78.
Błażejczyk, K. and Kunert , A., 2011: Bioklimatyczne uwarunkowania rekreacji i turystyki w Polsce.
Institute of Geography and Spatial Organization, Polish Academy of Sciences, Warszawa, Monographs, 13, 291. (in Polish)
Bogucki, J. (ed.), 1999: Biometeorologia turystyki i rekreacji. Academy of Physical Education, Poznań, 347. (in Polish)
Chojnacka-Ożga , L. and Ożga, W., 2013: Ocena warunków wypoczynku człowieka nad zbiornikiem wodnym w świetle wybranych wskaźników bioklimatycznych – na przykładzie Zbiornika Sulejowskiego.. Studia i materiały CEPL in Rogowo. 15, 37/4, 239–244. (in Polish)
Garbalewski, C., 1999: Fizyka aerozolowej aktywności morza. Polish Academy of Sciences Institute of Oceanology in Sopot. Monographs 12, (in Polish)
Jankowiak, J. and Parczewski, W., (ed.), 1978: Bioklimat uzdrowisk polskich. Wyd. Komunikacji Łączności. Warszawa, 429 (in Polish)
Kozłowska-Szczęsna, T., Błażejczyk, K., Krawczyk, B., 1997: Bioklimatologia człowieka. Institute of Geography and Spatial Organization, Polish Academy of Sciences, Warszawa, Monographs 1,200. (in Polish)
Kozłowska-Szczęsna, T., Błażejczyk, K., Krawczyk, B., Limanówka, D., 2002: Bioklimat uzdrowisk polskich i możliwości jego wykorzystania w lecznictwie. Institute of Geography and Spatial Organization, Polish Academy of Sciences, Warszawa, Monographs 3, 611, (in Polish)
Koźmiński, C. and Michalska, B., 2002: Charakterystyka prędkości wiatru i cisz w Polsce. Acta Agrophysica 78, 133–150. (in Polish)
Koźmiński, C. and Michalska, B.,(ed.), 2004: Atlas zasobów I zagrożeń klimatycznych Pomorza., Agricultural University, Szczecin, Poland. (in Polish)
Koźmiński, C. and Michalska, B., 2011: Meteorologiczne uwarunkowania rozwoju turystyki I rekreacji w strefie polskiego wybrzeża Bałtyku. Acta Balneologica, t.LIII, 1 (123), 68–74. (in Polish) Koźmiński, C. and Michalska, B., 2015: Ocena długości sezonu kąpielowego na polskim wybrzeżu
Bałtyku. Europa Regionum, University of Szczecin, XXIV, 55–66. (in Polish)
Marks, R., 2016: Znaczenie aerozoli morskich w rekreacji I turystyce. In: Health, wellness and bioclimatic tourism, (Ed. Koźmiński, C) University of Szczecin, 198–204. (in Polish)
Matzarakis, A., 2006: Weather and climate-related information for tourism”. Tourism hospital. plan.
develop. 3, 99–115.
Radomski, C., 1987: Agrometeorologia. National Publishing Institute, Warszawa. (in Polish)
Szyga-Pluta, K., 2011: Wielkość ochładzająca powietrza na wybrzeżu na wybrzeżu klifowym w rejonie Białej Góry w sezonie letnim 2008 i 2009”. Geografia fizyczna R. II, (A62), 27–39. (in Polish) Tarnowska, K., 2011: Wiatry silne na polskim wybrzeżu Morza Bałtyckiego. Prace i Studia
Geograficzne 47, 197–204, (in Polish)
Woś, A., 1999: Klimat Polski. National Publishing Institute, Warszawa. (in Polish).
Zalewski, T., 2016: Analiza wybranych aspektów bezpieczeństwa w turystyce wodnej. In (Ed.:
Stankiewicz, B. and Prochorowicz, M.) Water tourism as a tourist product of the regionWest Pomeranian University of Technology in Szczecin. (in Polish)
![Table 1. Petrovič and Kacvinsky scale H [Wm –2 ] Thermal sensation ≤ 210.0 very hot 210.1–420.0 hot 420.1–630.0 mild 630.1–840.0 slightly cool 840.1–1260.0 cool 1260.1–1680.0 cold 1680.1–2100.0 very cold](https://thumb-eu.123doks.com/thumbv2/9dokorg/1405853.118222/4.892.147.760.131.393/table-petrovič-kacvinsky-scale-thermal-sensation-mild-slightly.webp)