DOI:10.28974/idojaras.2019.1.8
IDŐJÁRÁS
Quarterly Journal of the Hungarian Meteorological Service Vol. 123, No. 1, January – March, 2019, pp. 127–133
Comparison of regression models of PM
10particulate concentration in relation to selected meteorological elements based on the example of Sosnowiec, Poland
Adam Adamek and Agnieszka Ziernicka-Wojtaszek*
Department of Ecology, Climatology and Air Protection, Faculty of Environmental Engineering and Land Surveying,
University of Agriculture in Kraków, al. Mickiewicza 24/28, 30-059 Krakow, Poland
*Corresponding author E-mail: a.ziernicka-wojtaszek@ur.krakow.pl (Manuscript received in final form: February 27, 2018)
Abstract⎯ The aim of the study was to construct linear regression and multiple regression models, describing the dependence of PM10 particulate concentration in the city of Sosnowiec on selected meteorological elements: air temperature, precipitation and wind speed. Three multiple regression models were constructed: a generic variant without regard to the barometric situation, and two models separately for high-pressure and low- pressure situations. The data used in the study were the average daily concentrations of PM10 registered during the 2013–2015 heating seasons at the Sosnowiec station on Lubelska Street, belonging to the Air Quality Monitoring System operated by the Voivodeship Environmental Protection Inspectorate in Katowice.
Key-words: air quality, particulate matter, regression model, heating season
1. Introduction
Poland is one of the countries with the worst air quality in Europe, with PM10
levels very often exceeding acceptable levels (European Environment Agency, 2016). Excessively high PM10 concentrations are noted during the heating season in nearly the entire country. Smog, i.e., extremely high concentrations of suspended particulates, is a common phenomenon that is harmful to human health. An association is observed between PM10 concentrations and emissions
of pollutants from industry, transport, and home furnaces. However, the concentration of air pollutants is also influenced by local meteorological elements, such as air temperature, wind speed, precipitation, and the type of atmospheric circulation (Majewski, 2005; Czarnecka and Kalbarczyk, 2008;
Leśniok and Caputa, 2009; Niedźwiedź and Małarzewski, 2016). This study deals with the concentration of PM10 particulates registered in the city of Sosnowiec in the central part of the Silesian Voivodeship.
Analyses of the dependence of concentrations of air pollutants on meteorological elements are frequently carried out using statistical methods. A common solution is to construct models based on linear regression or multiple regression analysis.
The aim of the study was to compare the accuracy of linear regression models and multiple regression models constructed in generic, anticyclone, and cyclone variants.
2. Materials and methods
The input data for the study were average daily PM10 concentrations recorded at the Air Quality Monitoring System station, managed by the Voivodeship Environmental Protection Inspectorate and located on Lubelska Street in Sosnowiec, as well as meteorological data for nearby Katowice, obtained from the Institute of Meteorology and Water Management. Data pertaining to PM10
concentrations and meteorological elements were considered in conjunction with data on the type of pressure system, determined according to the calendar of circulation types by Niedźwiedź (Niedźwiedź, 1981; Leśniok, et al., 2010). The analytical method chosen was the construction of linear regression models describing how the PM10 concentration depends on air temperature, wind speed, and precipitation, and multiple models that take into account all of these elements at the same time. Three multiple models were constructed: a generic model taking into account all situations, regardless of the type of pressure system, and separate models for both high and low pressure systems. The first stage of the study was the construction of linear regression models between PM10 concentration and each of the above-mentioned meteorological elements. The R2 coefficients obtained were compared to the R2 coefficient for multiple regression. Then, using only multiple regression, which produced more accurate results, anticyclone and cyclone situations were compared. It is widely accepted that changes in concentrations of air pollutants are seasonal (Majewski, 2007; Czarnecka and Nidzgorska-Lencewicz, 2010). Norms are very frequently exceeded during the heating season, when low- quality fuels are burned in home boilers, which are often outdated. Taking into account the variability of PM10 concentrations during the year, the months of the heating season (January, February, March, April, October, November, and December) in 2013–2015 were selected for the study period.
3. Results
For all recorded PM10 concentrations in the heating season, the mean value was 50.9 µg/m3 with a standard deviation of 29.6 µg/m3. The coefficient of variation was 58.1%. During the study period, anticyclone situations accounted for 54.7%.
The mean PM10 concentration in anticyclone situations was 55.3 µg/m3, with minimum and maximum concentrations of 16.0 and 235.0 µg/m3, respectively.
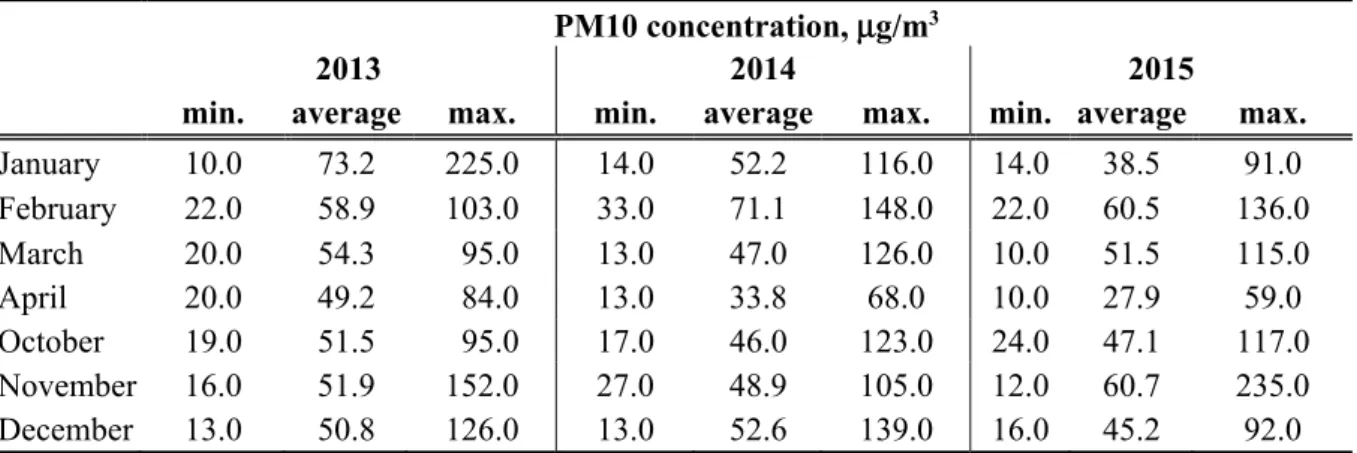
The standard deviation of the anticyclone population was 32.0 µg/m3, and the coefficient of variation was 56.3%. Cyclone situations accounted for 45.3%, with mean, minimum, and maximum PM10 concentrations of 45.2, 10.0, and 177.0 µg/m3, respectively. Taking into account the standard deviation of the population of cyclone situations of 25.0 µg/m3, the coefficient of variation was 55.3%. PM10 concentrations in the 2013–2015 heating seasons were characterized by a relatively high degree of variability, showing slightly greater variation during cyclone situations. Acceptable levels were exceeded on 40.0% of days. The 24-hour permissible limit of PM10 is 50.0 μg/m3 (Regulation of the Minister of the Environment of 24 August 2012 on the levels of certain substances in the air (Journal of Laws of 2012 item 1031)). In all months of the study, the maximum value exceeded the permissible limit. Table 1 presents the minimum, average, and maximum PM10 concentrations during the research period.
Table 1. Selected characteristics of mean daily PM10 concentrations in each month of the heating season in Sosnowiec (2013-2015)
PM10 concentration, μg/m3
2013 2014 2015 min. average max. min. average max. min. average max.
January 10.0 73.2 225.0 14.0 52.2 116.0 14.0 38.5 91.0
February 22.0 58.9 103.0 33.0 71.1 148.0 22.0 60.5 136.0
March 20.0 54.3 95.0 13.0 47.0 126.0 10.0 51.5 115.0 April 20.0 49.2 84.0 13.0 33.8 68.0 10.0 27.9 59.0 October 19.0 51.5 95.0 17.0 46.0 123.0 24.0 47.1 117.0
November 16.0 51.9 152.0 27.0 48.9 105.0 12.0 60.7 235.0
December 13.0 50.8 126.0 13.0 52.6 139.0 16.0 45.2 92.0
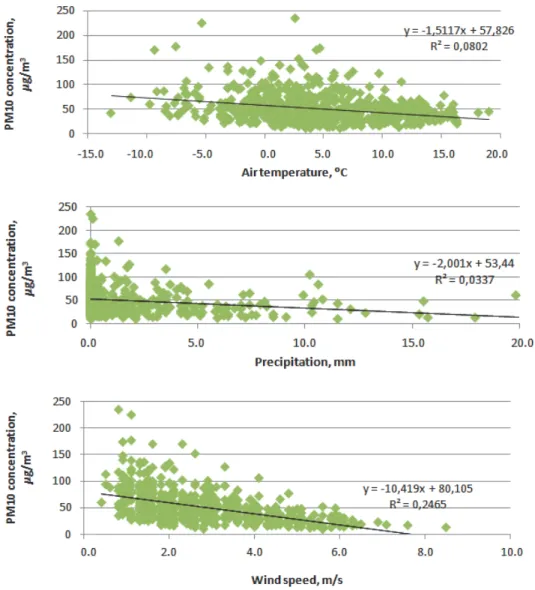
Linear regression with respect to individual meteorological elements, i.e., air temperature, precipitation, and wind velocity, shows statistical significance at α=0.05 in all cases, but the coefficients of determination R2 are low: 8.0%, 3.4%, and 24.6%, respectively (Fig. 1). The fit at this level is unsatisfactory.
Fig. 1. Regression relationships between PM10 concentration and air temperature, precipitation and wind speed in each month of the heating season (January, February, March, April, October, November, and December) in Sosnowiec, in 2013–2015.
In order to obtain a better fit, a regression model was constructed according to dependency 1 at significance level α = 0.05:
= ∙ + ∙ + ∙ + , (1) where:
y – PM10 concentration, µg/m3, T – air temperature, °C,
P – precipitation, mm, V – wind velocity, m/s, and
x1…4 – multiple regression coefficient.
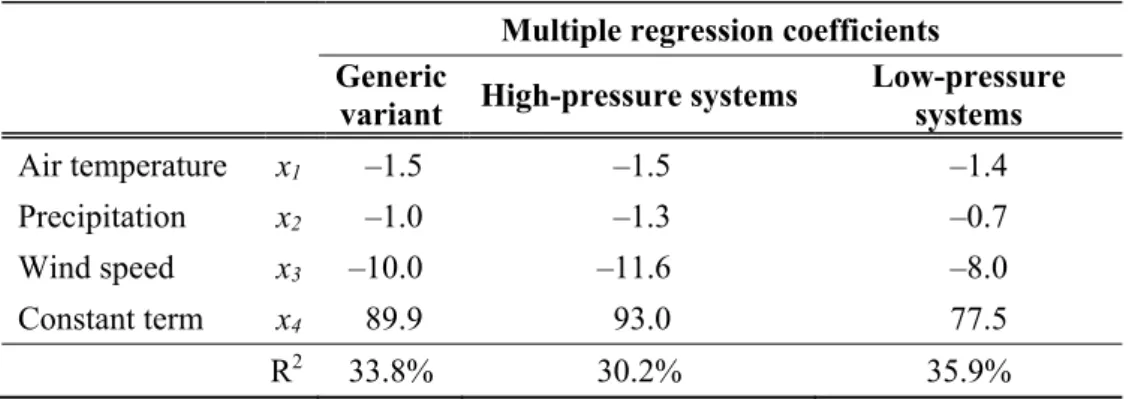
Multiple analysis taking into account all three meteorological elements resulted in an R2 coefficient of 33.8%, which is still a relatively low value, but much higher than in the previous cases. In addition, air temperature, precipitation, and wind speed all proved to be statistically significant in the model. Analogous regression models were constructed separately for low and high pressure systems. The results are presented in Table 2.
Table 2. Results of regression models for dependency of PM10 concentration on air temperature, precipitation, and wind speed
Multiple regression coefficients Generic
variant High-pressure systems Low-pressure systems
Air temperature x1 –1.5 –1.5 –1.4
Precipitation x2 –1.0 –1.3 –0.7
Wind speed x3 –10.0 –11.6 –8.0
Constant term x4 89.9 93.0 77.5
R2 33.8% 30.2% 35.9%
The models for high- and low-pressure systems produced similar values for the coefficient of determination R2, at a level of 30.2% for high systems and 35.9% for low systems. These values do not differ significantly from the generic model. It is worth noting, however, that in the case of the low-pressure model, the rainfall parameter was statistically non-significant. This may be due to the fairly small data population in comparison with the other regression models. It can be concluded that construction of a general model is sufficient for analysis of the relationship between PM10 concentration and meteorological elements.
Breakdown into high- and low-pressure systems does not lead to either a significant decrease or increase in accuracy, but requires more labour.
4. Discussion and conclusions
In Sosnowiec, during the 2013–2015 heating seasons, permissible PM10 levels were exceeded on 40.0% of days. Similar results were obtained for this city in other studies (Cembrzyńska et al., 2015). In all months of the study, the maximum value exceeded the 24-hour permissible limit of PM10, which is 50 μg/m3 (Regulation of the Minister of the Environment of 24 August 2012 on the levels of certain substances in the air (Journal of Laws of 2012 item 1031)). The main objective of the analysis was to compare several variants of models based
on regression analysis. The analysis showed that a multiple regression model is more accurate than a linear regression model. Among the variables tested, wind speed had the greatest influence on the level of PM10 concentration. PM10
concentration has been found to be most strongly correlated with wind speed in other parts of the country as well (Czarnecka and Nidzgorska-Lencewicz, 2008).
The multiple regression model taking into account air temperature, wind speed, and precipitation in the 2013–2015 heating seasons resulted in a coefficient of determination of 33.8% on average. Comparable values have been obtained in studies on other areas of Poland (Czarnecka and Nidzgorska-Lencewicz, 2008).
The accuracy of the model can be improved by increasing the number of elements taken into account. The literature describes regression models that also include visibility, atmospheric equilibrium, and relative humidity (Ćwiek and Majewski, 2015). The inclusion of more variables in the model could lead to higher coefficients of determination. Irrespective of the approach and the method, determination of patterns in the dependence of concentrations of pollutants on the complex of weather elements and types of synoptic situations can be used in particular to predict high and excessive concentrations on the basis of weather forecasts (Niedźwiedź and Ustrnul, 1989; Niedźwiedź and Olecki, 1994; Ośródka, 1996).
To sum up, the following conclusions can be drawn from the research:
1) Higher accuracy described by the coefficient of determination R2 is achieved using multiple regression models than for linear regression models. On average, the R2 coefficient was 33.8% for multiple regression and 8.0%, 3.4% and 24.6% for linear regression, in the case of air temperature, precipitation, and wind speed, respectively.
2) The optimal solution was to construct a generic multiple regression model (R2 =33.8%) based on the entire data set from the 2013–2015 heating seasons. The R2 coefficients from models, constructed separately for high-pressure systems (R2 =30.2%) and low-pressure systems (R2 =35.9%), did not differ significantly from the coefficient obtained for the general model. The accuracy of the model could be improved by expanding the population of input data and by incorporating additional variables in the model, such as visibility or atmospheric equilibrium.
3) During the 2013–2015 heating seasons, the most significant meteorological element affecting the PM10 concentration in Sosnowiec was wind speed, which had the highest statistical significance in the model. Precipitation proved to be the least significant.
4) The relationships demonstrated can be used to predict concentrations and exceedances of permissible PM10 levels based on the forecast of meteorological elements.
References
Cembrzyńska, J., Krakowiak, E., and Brewczyński, P.Z., 2015: Sezonowa zmienność stężenia pyłu zawieszonego oraz jakości powietrza na terenie miasta Sosnowiec, Medycyna Środowiskowa – Environmental Medicine 18(4) 27–35. (in Polish)
Czarnecka, M. and Kalbarczyk, R. 2008: Warunki meteorologiczne kształtujące zmienność stężenia pyłu zawieszonego na Pomorzu. Acta Agrophysica 11, 357–636. (in Polish)
Czarnecka, M. and Nidzgorska-Lencewicz, J. 2008: Warunki meteorologiczne kształtujące jakość powietrza w Szczecinie w styczniu i lipcu w roku 2006. Acta Agrophysica 12, 55–72. (in Polish) Czarnecka, M. and Nidzgorska-Lencewicz, J. 2010: The influence of precipitation conditions on the concentration of suspended particulates PM10. Meteorol. Climatol. Res.. red. J. Leśny. Acta Agrophysica. Rozprawy i Monografie 184, 132–147.
Ćwiek, K. and Majewski, G. 2015: Wpływ elementów meteorologicznych na kształtowanie się stężeń zanieczyszczeń powietrza na przykładzie Krakowa. Przegląd Naukowy – Inżynieria i Kształtowanie Środowiska 67, 54–66. (in Polish)
European Environment Agency, 2016: Air quality in Europe — 2016 report.
Journal of Laws of 2012 item 1031, Rozporządzenie Ministra Środowiska z dnia 24 sierpnia 2012 r. w sprawie poziomów niektórych substancji w powietrzu. (in Polish)
Leśniok, M. and Caputa, Z. 2009: The role of atmospheric circulation in air pollution distribution in Upper Silesia (Southern Poland). Int. J. Environ. Waste Manage. 4, 62–74.
https://doi.org/10.1504/IJEWM.2009.026884
Leśniok, M., Małarzewski, Ł., and Niedźwiedź, T. 2010: Classification of circulation types for Southern Poland with an application to air pollution concentration in Upper Silesia. Phys. Chem. Earth 35, 516–522. https://doi.org/10.1016/j.pce.2009.11.006
Majewski, G. 2005: Zanieczyszczenie powietrza pyłem zawieszonym PM10 na Ursynowie i jego związek z warunkami meteorologicznymi. Przegląd Naukowy Inżynieria i Kształtowanie Środowiska 14, 1(31) Wydawnictwo SGGW, 210–223. (in Polish)
Majewski, G. 2007: Wpływ warunków meteorologicznych na zanieczyszczenie powietrza pyłem zawieszonym w rejonie aglomeracji warszawskiej. Praca doktorska. Wydział Inżynierii i Kształtowania Środowiska SGGW. (in Polish)
Niedźwiedź, T. 1981: Sytuacje synoptyczne i ich wpływ na zróżnicowanie przestrzenne wybranych elementów klimatu w dorzeczu górnej Wisły, Rozprawy Habilitacyjne UJ 58. (in Polish)
Niedźwiedź, T., Ustrnul Z. 1989: Wpływ sytuacji synoptycznej na występowanie nad Górnośląskim Okręgiem Przemysłowym typów pogody sprzyjających koncentracji lub rozpraszaniu zanieczyszczeń powietrza (Influence of synoptic situations on the occurrence of weather types favorable to concentration or dispersion of air pollution above the Upper Silesia Industrial Region), Wiadomości IMGW XII (XXXIII), 31–39. (in Polish)
Niedźwiedź, T., Olecki Z. 1994: Wpływ sytuacji synoptycznych na zanieczyszczenie powietrza w Krakowie (The influence of synoptic situations on air pollution in Cracow), Zeszyty Naukowe UJ, Prace Geograficzne 96, 55–67. (in Polish)
Niedźwiedź, T., Małarzewski, Ł. 2016: Klimat Sosnowca [in:] Sosnowiec. Obraz miasta i jego dzieje, Tom I, red. Barciak A., Jankowski A.T.: Część pierwsza: Środowisko geograficzno- przyrodnicze. Rozwój przestrzenny. Muzeum w Sosnowcu, Sosnowiec, 74–85. (in Polish) Ośródka, L. 1996: Development of smog warning system in large industrial metropolises based on the
example of Upper Silesian Industrial Region. In (Eds. Allegrini I., de Santis F.) Urban Air Pollution. NATO ASI Series, Springer Verlag, 367–375.
https://doi.org/10.1007/978-3-642-61120-9_29