DOI:10.28974/idojaras.2018.1.2
IDŐJÁRÁS
Quarterly Journal of the Hungarian Meteorological Service Vol. 122, No. 1, January – March, 2018, pp. 15–30
Validation of diurnal soil moisture dynamic-based evapotranspiration estimation methods
Zoltán Gribovszki
Institute of Geomatics and Civil Engineering, University of Sopron Sopron, Bajcsy-zs. u. 4. H-9400, Hungary
Author E-mail: gribovszki.zoltan@uni-sopron.hu
(Manuscript received in final form September 8, 2017)
Abstract⎯Evapotranspiration (ET) is one of the most important elements of water balance. Despite its importance, exact determination for a mosaic surface cover is very limited; therefore, there is a demand for relatively simple and cheap methods of determination that work on a small spatial scale.
Water uptake of forest vegetation in groundwater discharge areas generally has a strong influence on the water resources induced diurnal signal in soil moisture, and in the water table. Diurnal methods in a shallow groundwater environment are widely used nowadays for ET estimation.
By modifying the well-known White (1932) method and adapting to soil moisture data, a new technique was developed to calculate ET from soil moisture readings, eliminating the need of specific yield (a weakest point of the groundwater signal based methods). The new method was validated using hydro-meteorological data of the Hidegvíz Valley experimental catchment located in the Sopron Hills at the western border of Hungary.
The 30-min ET rates of the proposed method lag 30-60 minutes behind those of the reference Penman–Monteith method, but otherwise the two estimates compare favorably.
On a daily basis, the newly derived ET rates are very close to PM estimates, but on average, they are 38% higher than the ones obtainable with the original White method.
Comparing the ET rates of the proposed method with traditional ET estimates from soil moisture, a significant difference can be ascertained.
The proposed method has potential benefits in groundwater discharge areas, especially in light of the changing climate with its warmer and drier growing seasons, that will likely result in limited water resources.
Key-words: evapotranspiration, soil moisture, diurnal signal, discharge areas, forest
1. Introduction
After precipitation, evapotranspiration (ET) is the second largest element of the water balance globally. In Hungary (on the border of the sub-humid and semi-arid climate conditions), ET makes up about 90% of the precipitation on the catchments scale in long-term average. Despite the importance of ET, it is determined mostly as a lumped residual flux from a long-term water balance equation of a catchment. This method has some drawbacks. It cannot give spatially distributed information within a catchment and is limited in terms of time resolution, because it only considers long-term average values. Using data of a local weather station for ET calculation, we can acquire more detailed time information, but the space domain limits of the approach remain. Nowadays, the scintillometer technique and remote sensing based information has started to resolve the problem of spatial distribution at a larger scale, but the application of these methods are still limited with highly heterogeneous, mosaic surface cover within a small spatial scale (Nachabe et al., 2005).
Moreover, in some forest covered shallow groundwater areas of the Hungarian Great Plain, ET was determined to be larger than precipitation using remote sensing based ET estimation techniques (Szilágyi et al., 2012). The deep root system of forests can often tap the shallow groundwater level (if it exists), thus leading to high ET that frequently exceeds precipitation. In these groundwater discharge areas, the average annual ET was about 70–80 mm more than the mean annual precipitation rate of the region. This negative water balance can be maintained if forests create a local depression in the water table so as to induce groundwater flow directed toward them. Otherwise, forest growing in these groundwater discharge areas possess very good biological productivity, enabling forest management companies to secure a reliable income. As the previous example showed, exact estimation of ET in shallow groundwater areas are important not only from a water resources viewpoint, but also from an ecological and economic viewpoint as well.
In areas with a high aridity index (ETP/P>1) and a shallow water table, groundwater supplies most of the plant transpiration requirements (Luo and Sophocleous, 2010; Loheide et al., 2005; Gribovszki et al., 2008; Nachabe et al., 2005).
In these shallow water table environments, transpiration of plants induces a diurnal signal not only in the water table, but in soil moisture as well. Haise and Kelley (1950) first described a diurnal signal of the soil moisture profile in their tensiometer experiments. These fluctuations can be observed mostly in groundwater discharge areas (Gribovszki et al., 2010; Móricz et al., 2012).
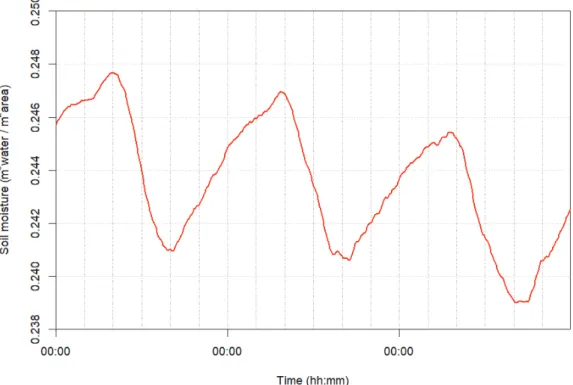
The direct driving force of the signal in the growing season is evapotranspiration (during rainless periods the latter is dominated by transpiration), and the signal is regulated by relative humidity and radiation. The evapotranspiration-induced diurnal signal (in soil moisture and groundwater) has
an early morning maximum and a late afternoon minimum (Fig. 1). Gribovszki et al. (2010) prepared an elaborate review about this signal and the characteristics of it.
Fig. 1. Typical diurnal pattern in soil moisture induced by evapotranspiration.
White (1932) developed a method that uses observations of the groundwater diurnal signal to calculate plant groundwater uptake. Use of this technique and its modifications is frequent for ET estimation (Bauer et al., 2004; Dolan et al., 1984;
Engel et al., 2005; Gribovszki et al., 2008; Loheide, 2008; Mould et al., 2010;
Reigner, 1966; Schilling, 2007, Soylu et al., 2012, Gribovszki et al., 2010);
nevertheless, specific yield estimation remained a weak point of the groundwater signal based methods.
Nachabe et al. (2005) used the White (1932) approach for high frequency soil moisture profile data, thereby eliminating the application of the specific yield.
Gribovszki (2014) modified the Nachabe et al. (2005) technique by adapting the empirical version of Gribovszki et al. (2008) method, taking into account the diurnally changing replenishment rate from the water table to the vadose zone.
The main objective of this paper is to validate the new diurnal soil moisture based technique (which calculates diurnally changing replenishment rate (Gribovszki,
2014) using reference ET estimations and compare this new method with the White approach (which calculates constant replenishment rate all along the day (Nachabe et al., 2005)) and traditional technique (which does not calculate any replenishment rate (Dingman, 2002)).
2. Matherial and methods
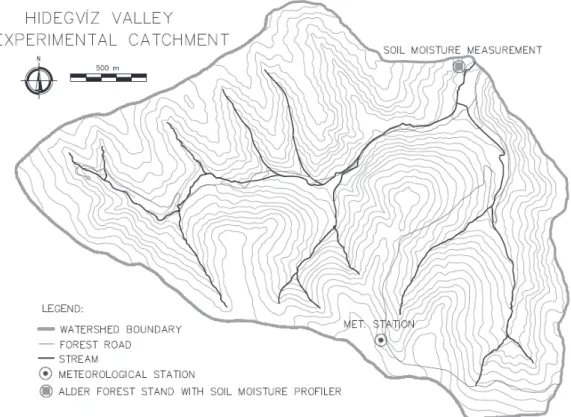
The dataset used for ET estimation originated from a valley location (47°40’20”N, 16°27’42”E) of the Hidegvíz Valley experimental catchment in western Hungary (Fig. 2).
Fig. 2. Location of the study site at the outlet point of the experimental catchment.
There are fluvial sediments deposited on the crystalline bedrock in the research area. Over the slopes and hilltops, an unclassified formation in a 10–50-m-thick layer exists. A finer-grained sandy layer, which is a good aquifer, appears in the valleys (Kisházi and Ivancsics, 1985).
The experimental plot is in a valley bottom, and the soil type there (groundwater discharge area) is loamy sand. The average physical properties of the soil profile are the following: saturated hydraulic conductivity k=0.18 m/d;
saturated moisture content θsat=0.51; field capacity at 0.33bar θfc =0.28.
The vegetation of the experimental plot is a typical phreatophyte azonal ecosystem dominated by alder (Alnus glutinosa (L.) Gaertn.). The mean height of the middle-aged riparian forest stand is about 15 m with a mean trunk diameter of 13 cm (at a height of 1.3 m). The leaf area index (LAI) of this forest stand in the growing season was approximately 7.
The area enjoys a sub-alpine climate, with daily mean temperatures of 17 °C in the summer, and with an annual precipitation of 750 mm (Marosi and Somogyi, 1990). A more detailed description of the area can be found in Gribovszki et al.
(2006).
2.1. Soil moisture and groundwater data sampling
Six soil moisture capacitive sensors were implemented at 10, 20, 30, 40, 60, and 100 cm below the ground surface in a riparian alder forest (Fig. 2). Sensors provide volumetric water content ranging from oven dryness to saturation with accuracy of ± 0.06 m3/m3. Soil moisture values were collected every 10 minutes.
These data were used for estimation of total soil moisture of the unsaturated soil profile using the following equation:
= , (1)
where θT is the total soil moisture (m), z is the depth (m) below the ground surface, and θ is the water content (m3 water in m3 soil). For z0 we used 1.2 m as an arbitrary depth regarding Fig. 3, because it is always below the water table even during the growing season.
A groundwater well dataset showed that the groundwater depth in the riparian zone varied between 0.8 to 1.1 m during typical drought periods (Fig. 3).
Consequently, the tree root system is in direct contact with the saturated zone or, at the very least, with the capillary fringe throughout the year in this shallow water table environment (Shah et al., 2007).
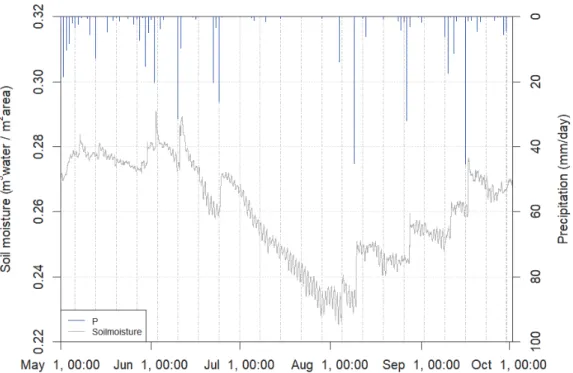
For the analysis, we used the rainless periods in the summer of 2013 (altogether 89 days). 30-minute estimates were compared in selected completely rainless periods. For daily comparison, we selected days with less than 3 mm of precipitation. Rain events below this threshold did not present significant disturbance in the soil moisture diurnal signal; therefore, they did not cause problems for ET calculation. The canopy catches the precipitation from these light rain events completely.
Fig. 3. Soil moisture and precipitation time series for the 2013 growing season.
For ET estimation, very accurate soil moisture measurements with relatively high frequency are crucial. Whenever the original measurements are inaccurate, differentiation of the soil moisture record may invoke large errors in the estimations. The application of a low-pass filter (smoother) is recommended to reduce uncertainty. Care must be taken not to “over-filter” the time series, because this can lead to the loss of important details about the process of the diurnal fluctuations. We used 30-min data for the analysis, and the sampling interval was 10 min.
2.2. Theoretical basis of ET estimation
The basic expression of ET estimation is the water balance equation for the soil moisture profile:
= = − − = _ − , (2)
where Ssm (m3/m2) is the stored volume of water in the soil moisture profile in a unit area, which is the same as θT is the total soil moisture in soil profile (m3/m2), Qi is the incoming and Qo is the outgoing water flux (m3/s/m2) to and from the soil column, Qnet_sm = Qi –Qo is the net flux/replenishment rate (m3/s/m2), and ET is the evapotranspiration (m3/s/m2).
The soil moisture of the riparian zone, which is directly connected to the water table in discharge zones of shallow groundwater environments, generally meets the transpiration demand of vegetation. In drought periods, groundwater typically replenishes the soil moisture used by evapotranspiration. Around the timing of the soil moisture extrema, when dSsm/dt = 0, the net flux, Qnet_sm and the ET demand, are in an equilibrium in Eq. (2). dSsm/dt>0 and Qnet_sm>ET on the rising limb and dS/dt<0 and Qnet_sm<ET are on the falling limb of the soil moisture hydrograph. The ET rate is largest during the day when the soil moisture curve is approximately the steepest on the falling limb, which is typically close to the radiation maxima. The smallest ET rate, however, does not necessarily take place when the rising limb of the groundwater level signal is the steepest, but rather just prior to dawn when vapor pressure deficit is at its diurnal minimum.
The minima in the soil moisture is accompanied by the steepest hydraulic gradients, so when ET starts to decrease, the steep hydraulic gradient can deliver water to the vadose zone very efficiently, replenishing it fastest right after the occurrence of the soil moisture minimum.
2.3. Traditional method
Traditionally, soil moisture data on a daily time step can be used for ET (ETtrad) calculation (Dingman, 2002). The calculation process follows the rearranged Eq. (2) neglecting the net flux rate in a daily time step:
= = ( ) − ( ), (3)
where ( ) is the total soil moisture of the jth day, ( ) is the total soil moisture of the (j–1)th day. Eq. (3) neglects the replenishment rate from below. This is true only in circumstances where the water table is deep enough to prevent root contact.
2.4. Traditional diurnal method (White approach)
White (1932) worked out a method of estimating ET rates on a daily time step based on diurnal fluctuations of the water table. Nachabe (2005) adapted this method for total soil moisture of the vadose zone, thereby eliminating the difficulty of estimating the specific yield, which was the limitation of the original White approach and all other groundwater fluctuation based methods.
Using the original White (1932) approach, Nachabe (2005) assumed that during the predawn/dawn hours, when ET is negligible, the rate of the observed total soil moisture increase is directly proportional to the net flux rate (it represents the rate of water supply to a unit area). The slope of the tangential line (Qnetmin_sm
(m3/s/m2)) drawn to the total soil moisture level curve in these sections was determined. By extending the tangential line over a 24-hour period and taking the
difference in total soil moisture, one would obtain an estimate of the total water supply to the unit area over a day. The daily rate of water supply obtained thus (replenishment rate) must typically be modified by dθT/dtdaily (m3/s/m2), the difference in the observed soil moisture over the 24-hour period, since it is rare for soil moisture to return to the same elevation it had the day before. Otherwise, the dθT/dtdaily value is the same as the evapotranspiration from traditional estimates (ETtrad) regarding Eq. (3).
In this way, the daily ET rate is obtained by
_ = 24 ∙ _ + . (4)
It is worth noting that the White approach assumes a constant net supply rate throughout the day. This flux is estimated in the predawn/dawn hours when ET is close to zero and the supply rate is the smallest for the day.
2.5. New diurnal method (diurnally changing replenishment rate)
The water table diurnal signal was used for ETgw (evapotranspiration from groundwater) estimation by Gribovszki et al. (2008). This approach takes into account a diurnally changing replenishment rate, not a constant one as White (1932) had supposed earlier. The theory of the groundwater diurnal signal based method Gribovszki (2014) applied for ET calculation used soil moisture data.
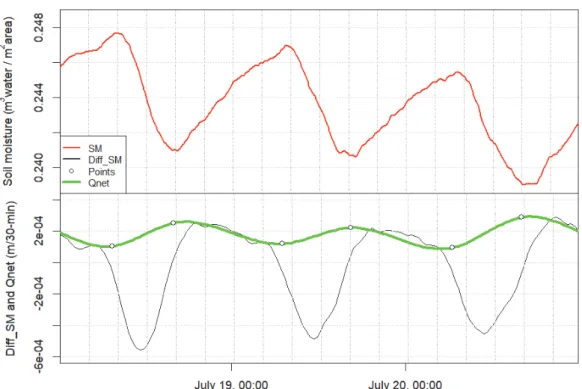
The steps of the new ET estimation approach are the following. First, the total soil moisture is differenced in time (half-hourly or hourly time steps are convenient) to obtain dθT /dt. The new time series (Fig. 4) symbolizes the difference between water supply (Qnet_sm) and demand (ET) over the soil profile.
At night when ET is almost zero, Qnet_sm can be calculated using the simplified water balance:
= _ . (5)
To get a continuous time series of the net flux (Qnet_sm) through the course of the whole day, a so-called empirical sub-method theory developed for the groundwater diurnal signal (Gribovszki et al., 2008) was adapted for soil moisture data (Gribovszki, 2014).
The maximum of Qnet_sm for each day was calculated by selecting the largest positive value from differential total soil moisture (Qnetmax_sm=max(dθT/dt)), while the minimum was obtained by calculating the mean value from dθT/dt taken in the predawn/dawn hours (Qnetmin_sm=mean(θTpredawn/dt)). Averaging is necessary to minimize the relatively large role of measurement error may play at dawn when the changes of soil moisture are small. The obtained values of the Q then were assigned to those temporal locations where the soil moisture
extrema took place (Qnetmax_sm to the time of soil moisture minima and Qnetmin_sm to the time of soil moisture maxima). This was followed by a spline (or when the data are very noisy a linear) interpolation of the Qnet_sm values to derive intermediate values between the specified characteristic points (Fig. 4).
Fig. 4 The principle of the proposed method (SM: soil moisture, Points: characteristic points, Qnet: replenishment, Diff_SM: differential soil moisture) for some selected days.
ET rates from soil moisture signal considering a diurnally changing replenishment rate can be obtained by rearranging the former water balance equation (Eq. (2)) as
= _ − . (6)
2.6. Reference ET calculation
Different ET estimations were compared to reference ET determined by the Penman-Monteith (PM_ET) method (Allen et al., 1998). This method is one of
the most reliable methods in estimating evapotranspiration from densely vegetated surfaces as
)]
r r (1 [
r VPD c )
_ ( -1
a c
-1 a p 0
+ +
Δ +
−
= ΔLRv S
γ ⋅
ρET
PM , (7)
where PM_ET is the Penman–Monteith ET (mm time_step-1), Lv is the latent heat of vaporization (MJ kg-1), Δ is the slope of the saturation vapor pressure curve (kPa °C-1), γ is the psychrometric constant (kPa °C-1), R0 is the net radiation (MJ m-2 time_step-1), VPD is the vapor pressure deficit (kPa), S is the soil heat flux and temporary storage of energy into the tree itself (MJ m-2 time_step-1), ρ is the air density (kg m-3), cp is the specific heat of moist air (kJ kg-1 °C-1), ra is the aerodynamic resistance (s m-1), and rc is the bulk canopy resistance (s m-1).
The meteorological data for PM_ET calculation originated from climate station sensors located 2 m above the forest canopy, 1.6 km away from the soil moisture measurement site.
The tree canopy is 10–15 m above the soil surface at the study site, so soil heat flux contributions to the available energy for the canopy were considered very small. Temporary energy storage in tree stems and twigs was estimated at 5% of the solar radiation (Goodrich et al., 2000). Goodrich et al. (2000) also offered a high rc value (i.e., 5000 s m–1) for the night in order to cease ET at night.
This high resistance value is not always realistic, because nocturnal sap flow can be as high as 10–25% of the daily ET in some situations (Gazal et al., 2006).
Therefore, positive ET at night, as our estimates in some cases suggest (Fig. 5), can be realistic. Seasonal changes of the rc value were estimated using LAI measurements (rc = 200/ LAI (Allen et al., 1998)) during the summer. In our case, Penman–Monteith estimates represent ‘‘real world’’ ET of well-watered forest vegetation that can be used as a benchmark to compare with the proposed methods. ET values produced by the new method were compared with those of the Penman–Monteith method at a 30-min resolution, of the traditional, and of the White approach-based methods on a daily basis.
For comparison of different ET estimations, the Tukey HSD (honestly significant difference) post hoc test and correlation test were used in an R software environment (R Core Team, 2012).
Fig. 5 Half hourly evapotranspiration estimates of new soil moisture based [ET_New] and PM [ET_PM] methods plotted together with meteorological parameters [WS: wind speed, T: temperature, RH: relative humidity, R0: net radiation] for some selected days
3. Results and discussion
Half-hourly ET estimates of the new method are compared with the PM_ET values in three selected rainless periods (June 3–9, 2013, July 16 – August 5, 2013,
September 1–8, 2013). Fig. 5 illustrates ET values for some selected days at the end of July together with meteorological parameters.
Cross-correlation analysis of the half-hourly ET values (between the Penman–Monteith and the new method) show a peak (r = 0.854–0.914) generally at a separation distance of 30–60 min with the new method’s values lagging behind those of the Penman–Monteith approach. Larger lag time is more typical closer to the start (at the beginning of June) and at the end (in September) of the growing season. The lag can be the consequence of the delayed transport mechanism in the xylem from the roots to the leaves. The travel time of the water particle allows some difference between the time of the transpiration and absorption of water from the soil.
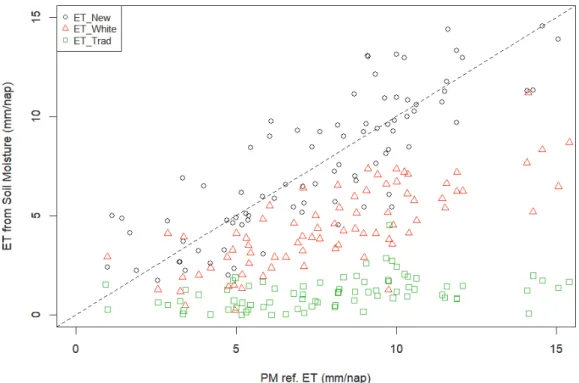
Fig. 6 displays the estimated ET rates on a daily basis, obtained by daily calculation (White and traditional estimates) and by summing the 30-min values over the days (PM and proposed diurnal method estimates). By using new diurnal method for ET estimation, a better correlation (0.85) can be found with PM_ET values than when White approach (0.76) and traditional estimates (0.38) were applied. Not only the correlation was better, but the absolute values for ET (ET_New) are also much closer to PM_ET as Table 1 shows.
Fig. 6. ET values of different soil moisture-based methods versus PM_ET values as a reference method (ET_New: diurnal proposed method – black circles, ET_White: White approach – red triangle, ET_Trad: traditional method – green squares).
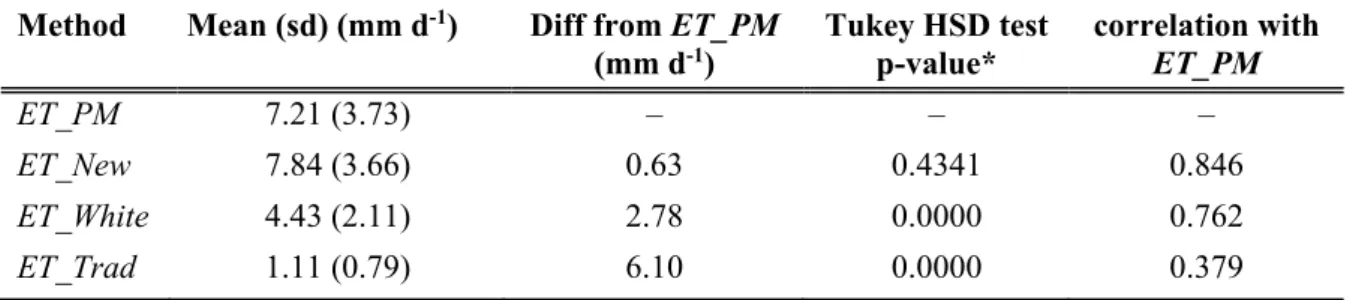
Table 1. ET values from different methods (n=89)
Method Mean (sd) (mm d-1) Diff from ET_PM (mm d-1)
Tukey HSD test p-value*
correlation with ET_PM
ET_PM 7.21 (3.73) – – –
ET_New 7.84 (3.66) 0.63 0.4341 0.846
ET_White 4.43 (2.11) 2.78 0.0000 0.762
ET_Trad 1.11 (0.79) 6.10 0.0000 0.379
sd: standard deviation, p-value*: Tukey HSD test significance compared with ET_PM.
The Tukey HSD test result shows (Table 1) that only the proposed, new method does not differ significantly from PM_ET. The White approach underestimates reference PM_ET by 38%, while traditional calculation gives only 1/6–1/7 of the Penman-Monteith values.
The explanation of the deviations between the different assumptions is the following:
The original White approach assumes a constant replenishment rate to the vadose zone throughout the day. The replenishment is estimated when ET is close to zero in the late night hours, when the net flux is reduced due to a diminished hydraulic gradient. Contrasting the new method accounts for this diurnal change of the replenishment rate, which has a maximum when ET is most intensive and a minimum in the morning hours.
The traditional method does not take into account any replenishment from below; thus, the estimated ET values of that approach are very low. The relative importance of the net flux can be up to 90% of the ET rates (Gribovszki, 2014);
therefore, neglecting this rate from below very significantly distorts the estimated ET.
Comparing ET from the new method (7.8 mm d–1) with results of other studies, it can be stated that these values typically represent the high-end of those estimates. It is worth noting that only dry and hot periods of the vegetation season were used for estimations of ET. Nachabe et al. (2005) calculated monthly average total ET rates of 1.5–6.3 mm d-1 for a forest with the help of continuous soil moisture profile measurements in Florida using the White approach. Gazal et al. (2006) found ET as 2–7 mm d–1 for a cottonwood forest in semiarid region of Australia. Goodrich et al. (2000) obtained 4–8 mm d–1 ET values for mixed vegetation, while Hughes et al. (2001) found 2–6 mm d–1 ET rates for a temperate salt marsh in Australia. In the cases of the last three research studies, sap flow measurements and micrometeorological methods were employed for calculating total ET. Important vegetation parameters (such as LAI) cannot always be deduced from these previous studies; therefore, comparison is not straightforward with
present estimates. Notwithstanding, the new ET estimation seems to yield realistic values. Especially when one considers the ready access of vegetation to vadose zone soil moisture directly connected with the shallow water table, the abundance of available energy in the growing season considered, as well as a large value of LAI, all combined with a favorable match with the Penman–Monteith ET values as a control. ET estimates of the new method seem also to be acceptable if the oasis effect (Morton, 1983) is taken into account in a well-watered valley situation, in a period when a hot and dry environment can add a significant amount of heat enhancing ET.
4. Conclusions
The current ET estimation method is an enhanced version of the original White (1932) method adapted to soil moisture diurnal signal measured with high frequency.
The new method has been successfully validated using a well-known Penman-Monteith approach. Penman-Monteith ET values show a good correlation with present estimates; deviations between the reference and proposed method are small, not only on daily, but also on half-hourly scale. The estimated relatively high evapotranspiration values seem to be acceptable if the oasis effect is taken into account. Compared to traditional approaches and the White approach based diurnal techniques for soil moisture data, this new method gives significantly higher ET rates by taking into account continuous, diurnally changing soil moisture replenishment from shallow groundwater to the vadose zone.
The advantage of this new soil moisture-based diurnal technique over the groundwater signal based estimates is that only a soil moisture profile dataset is needed for the calculation of ET, and there is no need for specific yield (the most problematic parameter of groundwater diurnal signal based methods) values of a given soil profile.
The proposed method has potential benefits for determining ET rates in a changing climate with warmer and drier growing seasons. The ET of well-watered vegetation in groundwater discharge areas in hot and dry environments will probably increase in the future. The used water amount has a strong connection to biological productivity, and precise determination of ET from those areas is important from a water resources protection point of view as well.
Acknowledgements: This research has been supported by “Agrárklíma.2” (VKSZ_12-1-2013-0034) project. The research of Zoltán Gribovszki was supported by the European Union and the State of Hungary, co-financed by the European Social Fund in the framework of TÁMOP 4.2.4. A/2-11-1-2012- 0001 'National Excellence Program'. The author is grateful to the Institute of Environmental and Earth Sciences for supplying 30-min meteorological data applied in the analysis, and to the anonymous reviewer whose comments and suggestions improved this study.
References
Allen, R.G., Pereira, L.S., Raes, D., and Smith, M., 1998: Crop evapotranspiration – Guidelines for computing crop water requirements. FAO Irrigation and Drainage 56.
http://www.fao.org/docrep/X0490E/x0490e06.htm
Dingman, S.L., 2002: Physical Hydrology, Prentice Hall, Upper Sadle River, New Jersey.
Bauer, P., Thabeng, G., Stauffer, F., and Kinzelbach, W., 2004: Estimation of themevapotranspiration rate from diurnal groundwater level fluctuations in them Okavango Delta, Botswana. J.
Hydrology 288, 344–355. https://doi.org/10.1016/j.jhydrol.2003.10.011
Dolan, T.J., Hermann, A.J., Bayley, S.E., and0 Zoltek, J., 1984: Evapotranspiration of a Florida, USA, fresh-water wetland, J. Hydrology 74, 355–371. https://doi.org/10.1016/0022-1694(84)90024-6 Engel, V., Jobbágy, E.G., Stieglitz, M., Williams, M., and Jackson, R.B., 2005: The hydrological
consequences of Eucalyptus afforestation in the Argentine Pampas. Water Resour. Res. 41, W10409.
https://doi.org/10.1029/2004WR003761
Gazal, R.M., Scott, R.L., Goodrich, D.C., and Williams, D.G., 2006: Controls on transpiration in a semiarid riparian cottonwood forest. Agric. Forest Meteorol. 137 56–67.
https://doi.org/10.1016/j.agrformet.2006.03.002
Gribovszki, Z., Kalicz, P., and Kucsara, M., 2006: Streamflow Characteristics of Two Forested Catchments in Sopron Hills. Acta Silv Lign Hung 2, 81–92.
Gribovszki, Z., Kalicz, P., Szilágyi, J., and Kucsara, M., 2008: Riparian zone evapotranspiration estimation from diurnal groundwater level fluctuations. J. Hydrology 349, 6–17.
https://doi.org/10.1016/j.jhydrol.2007.10.049
Gribovszki, Z., Szilágyi, J., and Kalicz, P., 2010: Diurnal fluctuations in shallow groudwater levels and in streamflow rates and their interpretation - a review. J. Hydrology 385, 371–383.
https://doi.org/10.1016/j.jhydrol.2010.02.001
Gribovszki, Z., 2014: Diurnal Method for Evapotranspiration Estimation from Soil Moisture Profile.
Acta Silv Lign Hung 10, 67–75. https://doi.org/10.2478/aslh-2014-0005
Goodrich, D.C., Scott, R., Qi, J., Goff, B., Unkrich, C.L., Moran, M.S., Williams, D., Schaeffer, S., Snyder, K., MacNish, R., Maddockb, T., Poole, D., Chehbounif, A., Cooperg, D.I., Eichingerh, W.E., Shuttleworthb, W.J., Kerri, Y., Marsetta, R., and Ni, W., 2000: Seasonal estimates of riparian evapotranspiration using remote and in situ measurements. Agric. Forest Meteorol. 105, 281–309.
https://doi.org/10.1016/S0168-1923(00)00197-0
Haise, H.R. and Kelley, O.J., 1950: Causes of diurnal fluctuations of tensiometers. Soil Science 70, 301–
313. https://doi.org/10.1097/00010694-195010000-00006
Hughes C.E., Kalma J.D., Binning, P., Willgoose, G.R., Vertzonis, M., 2001: Estimating evapotranspiration for a temperate salt marsh, Newcastle, Australia. Hydrol. Process. 15, 957–975.
https://doi.org/10.1002/hyp.189
Kishazi, P. and Ivancsics, J., 1985: Sopron környéki üledékek összefoglaló földtani értékelése. Kezirat, Sopron, 48 p. (in Hungarian).
Loheide, II., S.P., Butler, Jr. J.J., and Gorelick, S.M., 2005: Estimation of groundwater consumption by phreatophytes using diurnal water table fluctuations: A saturated-unsaturated flow assessment.
Water Resour. Res. 41, W07030. https://doi.org/10.1029/2005WR003942
Loheide, II., S.P., 2008: A method for estimating subdaily evapotranspiration of shallow groundwater using diurnal water table fluctuations. Ecohydrology 1, 59–66. https://doi.org/10.1002/eco.7 Luo, Y. and Sophocleous, M., 2010: Seasonal groundwater contribution to crop-water use assessed with
lysimeter observations and model simulations. J. Hydrology 389, 325–335.
https://doi.org/10.1016/j.jhydrol.2010.06.011
Marosi, S., and Somogyi, S., (eds.) 1990: Magyarország kistájainak katasztere I. [MTA Foldrajztudomanyi Kutato Intezet, Budapest, 479 p. (in Hungarian).
Móricz, N., Mátyás, C., Berki, I., Rasztovits, E., Vekerdy, Z., and Gribovszki, Z., 2012: Comparative water balance study of forest and fallow plots. iForest 5, 188–196.
Morton, F.I., 1983: Operational estimates of areal evapotranspiration and their significance to the science and practice of hydrology. J. Hydrology 66, 1–76.
https://doi.org/10.1016/0022-1694(83)90177-4
Mould, D.J.E., Frahm, T. Salzmann, K. Miegel, and M.C. Acreman, 2010: Evaluating the use of diurnal groundwater fluctuations for estimating evapotranspiration in wetland environments: case studies in southeast england and northeast germany. Ecohydrology 762, 294–305
https://doi.org/10.1002/eco.108
Nachabe, M., Shah, N., Ross, M., and Womacka, J., 2005: Evapotranspiration of two vegetation covers in a shallow water table environment. Soil Science Society of America Journal 69, 492–499.
https://doi.org/10.2136/sssaj2005.0492
R Core Team, 2012: R: A language and environment for statistical computing. R Foundation for Statistical Computing, Vienna, Austria. https://www.r-project.org/
Reigner, I.C., 1966: A method for estimating streamflow loss by evapotranspiration from the riparian zone. Forest Science 12, 130–139.
Schilling, K.E., 2007: Water table fluctuations under three riparian land covers, Iowa (USA).
Hydrologic. Proc. 21, 2415–2424. doi: 10.1002/hyp.6393.
Shah, N., Nachabe, M., and Ross, M., 2007: Extinction depth and evapotranspiration from ground water under selected land covers. Ground Water 45, 329–338.
https://doi.org/10.1111/j.1745-6584.2007.00302.x
Soylu, M.E., Lenters, J.D., Istanbulluoglu, E., and Loheide, II., S.P., 2012: On evapotranspiration and shallow groundwater fluctuations: A fourier-based improvement to the white method. Water Resour. Res. 48, W06506. https://doi.org/10.1029/2011WR010964
Szilágyi, J., Kovács, Á., Józsa, J., 2012: Remote sensing based groundwater recharge estimates in the Danube-Tisza Sand Plateau region of Hungary. J. Hydrol. Hydromech. 60, 64-72, https://doi.org/10.2478/v10098-012-0006-3
White, W.N., 1932: Method of Estimating Groundwater Supplies Based on Discharge by Plants and Evaporation from Soil – Results of Investigation in Escalante Valley. Tech. Rep., Utah – US Geological Survey. Water Supply Paper 659-A.
![Fig. 5 Half hourly evapotranspiration estimates of new soil moisture based [ET_New] and PM [ET_PM] methods plotted together with meteorological parameters [WS: wind speed, T: temperature, RH: relative humidity, R 0 : net radiation] for some selected days](https://thumb-eu.123doks.com/thumbv2/9dokorg/1396980.116639/11.892.161.745.101.899/evapotranspiration-estimates-moisture-meteorological-parameters-temperature-relative-radiation.webp)