DOI:10.28974/idojaras.2018.3.6
IDŐJÁRÁS
Quarterly Journal of the Hungarian Meteorological Service Vol. 122, No. 3, July – September, 2018, pp. 321–343
Bioclimatic and climatic tourism conditions at Zlatibor Mountain (Western Serbia)
Biljana Basarin1, Tin Lukić1, Dajana Bjelajac1*, Tanja Micić1, Goran Stojićević1, Igor Stamenković1, Jasmina Đorđević1,
Tijana Đorđević1, and Andreas Matzarakis2
1Faculty of Sciences, University of Novi Sad, Department of Geography, Tourism and Hotel Management,
Trg Dositeja Obradovića 3, 21000 Novi Sad, Serbia
2Research Center Human Biometeorology, Deutscher Wetterdienst,
Stefan-Meier-Str. 4, 79104 Freiburg, Germany
Corresponding author Email: dajana.bjelajac92@gmail.com (Manuscript received in final form May30, 2017)
Abstract⎯ This study presents the climatic and bioclimatic conditions at Zlatibor, as well as their modification and distribution over the year. Zlatibor Mountain is a popular tourist destination in Serbia, and it stands out as a mountain of exquisite natural and anthropogenic values. Information about climate and bioclimate is presented by using physiologically equivalent temperature (PET), and universal thermal climate index (UTCI) over 10-day periods. The Climate-Tourism/Transfer-Information-Scheme (CTIS) was also used as it displays climate and bioclimate information for tourism purposes based on thresholds of relevant parameters and the frequency of occurrence. The weather suitability index (WSI) was calculated as well, because it provides synthetic information about suitability of weather for different forms of recreational and tourism activities. The results obtained in this study were used to develop a bioclimatological leaflet for Zlatibor, which could be very useful to the tourism industry and stakeholders in decision-making, but also it will enable tourist to choose the best time for holiday depending on personal preferences and requirements.
Key-words: bioclimate, PET, UTCI, CTIS, climatological leaflet, Zlatibor, Serbia
1. Introduction
The environmental resources that are the foundation for tourism/recreation are influenced by weather and climate which also affect the length and quality of tourism and recreation seasons, the health of tourists, and even the quality of tourism experiences (Scott et al., 2004; Katerusha and Matzarakis, 2015;
Stojsavljević et al., 2016). Information about climate that is provided to tourists and tourism industry should include not only its general features (mean monthly and annual values of particular climate elements), but also detailed information about thermal comfort as well as aesthetic and physical weather factors (de Freitas, 2003). Several studies used bioclimate information and focused on diverse spatial and temporal distributions (Scott et al., 2006; Scott and Lemieux, 2010; Matzarakis and Amelung, 2008), but also investigated the ways to incorporate them in tourism sector (Hall and Higham, 2005; Matzarakis, 2006;
Matzarakis and de Freitas, 2001; Matzarakis et al., 2007a; Amelung et al., 2007;
Gössling and Hall, 2006; Gössling et al., 2010; Jopp et al., 2010).
During the last three decades, various climate indices for tourism were developed. The widely known and applied is the tourism climate index (TCI) (Mieczkowski, 1985), which combines seven meteorological parameters but without taking human energy balance into account. From a human- biometeorological point of view, it is necessary to asses the thermo-physiology of human organisms, and consequently their comfort and discomfort, because they are important factors for tourists and their satisfaction during vacations (Matzarakis, 2006). Physiologically equivalent temperature (PET) is found to be a very useful bioclimatic index for tourism purposes. PET uses degree Celsius as a unit, which makes it a good indicator of thermal stress. It also evaluates the thermal conditions in a human physiological manner (Mayer and Höppe, 1987;
Matzarakis et al., 1999; Höppe, 1999). Another advantage of PET is that it can be applied in different climates and all year round (Matzarakis et al., 2007b; Lin and Matzarakis, 2008; Zaninović and Matzarakis, 2007; Gulyás and Matzarakis, 2009; Çalışkan et al., 2011).
PET was used to estimate bioclimatic conditions in different places around the world (e.g., Gulyas et al., 2006; Kovács et al., 2017; Thorsson et al., 2007;
Grigorieva and Matzarakis, 2011). Additionally, PET was used to evaluate bioclimatological potential for tourism and recreation in various destinations in different climate zones (e.g., Matzarakis et al., 2013; Katerusha and Matzarakis, 2015; Çalışkan et al., 2011; Brosy et al., 2014; Zaninović and Matzarakis, 2009). The first results of biometeorological parameters in Serbia (Vojvodina, northern part of Serbia) were given by Basarin, et al., (2014). Respective authors presented a detailed analysis of climate and weather conditions for tourism purposes (for two special nature reserves “Gornje Podunavlje” near
Sombor and “Carska bara” near Zrenjanin), including important parameters such as PET and tourism climate index (TCI). The latest study based on PET analysis in Serbia is published by Stojićević et al., (2016), which conducted a detailed bioclimate analysis of Banja Koviljača (Serbia) using PET index.
Together, with PET, Universal thermal climate index (UTCI) (Jendritzky et al., 2012) is being used for the assessment of the physiological thermal response of the human body to climatic conditions (Błazejczyk et al., 2012). UTCI has been applied in order to determine bioclimatic conditions in cities (e.g., Idzikowska, 2010; Lindner, 2011), but also to observe the modification of thermal conditions due to the relief features (Kunert, 2010). These results are very important for planning different recreational activities, especially at mountain tourism destinations.
The Climate-Tourism/Transfer-Information-Scheme (CTIS) (Matzarakis, 2007; Lin and Matzarakis, 2008; Zaninović and Matzarakis, 2009; Matzarakis, 2014) is a recent development in tourism climatology. It displays climate and bioclimate information for tourism purposes based on thresholds of relevant parameters and their frequency of occurrence. Furthermore, it can be adapted to different types of touristic activities. According to de Freitas (2003), the three facets of tourism are thermal, physical, and aesthetic, which are combined in CTIS. The temporal resolution of CTIS is 10 days (Lin and Matzarakis, 2008).
Another index that gives supplementary information about weather suitability for different tourism activities is the weather suitability index (WSI) (Blazejczyk and Matzarakis, 2008). The WSI provides information about usefulness of weather for different forms of recreational and tourism activities: passive (sun and air bathing) and active (mild and intensive) (Blazejczyk and Matzarakis, 2008).
Zaninović and Matzarakis (2009) developed a climate leaflet containing climatological and bioclimatological information for tourists. This scheme is valuable for tourists, because it enables them to choose the most suitable time period for holidays depending on personal preferences and requirements.
Climate pamphlet is also useful to stakeholders and decision-makers (Zaninović and Matzarakis, 2009). It includes thermal indices, but also climate facets such as thermal, aesthetical, and physical (Matzarakis, 2006), which represent a combination of important factors using mean values and extreme conditions (Lin and Matzarakis, 2008; Matzarakis, 2010).
The bioclimatic analysis in this study concerns Zlatibor Mountain, a popular tourist destination in Western Serbia. Zlatibor Mountain stands out as a mountain of exquisite natural and anthropogenic values, and as such, it is significant for the development of tourism (Jovanović et al., 2015). The tourism started to develop at the end of the 19th century and in the beginning of the 20th century, with the substantial increase of tourists since then (Dragović et al., 2009). The climate of the investigated area is typical subalpine, with more than 2000 hours of sunshine per year, which makes it one of the most desirable
tourist destinations in Serbia. It is characterized by relatively warm summers and mild winters with abundant snow cover (Dragović et al., 2009; Stojsavljević et al., 2016).
2. Material and methods 2.1. Study area
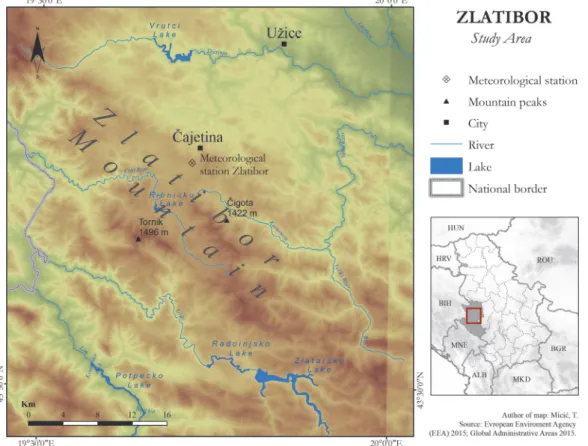
Zlatibor Mountain is located in Western Serbia. It spreads between 17° 14′ and 17° 28′ E and 43° 36′ and 43° 48′ N. It covers greater parts of the widespread plateau of Starovlaška (Fig. 1). The average elevation of Zlatibor is 1000 m.
Zlatibor Mountain is often called the “Serbian capital of mountain tourism”. The touristic center of Zlatibor is in its central part at an average elevation of 1000 m, and is surrounded by peaks Tornik (1496 m), Čigota (1422 m), and a number of lower ones. Number of tourists during both the summer and winter season, is quite high (Dragović et al., 2009; Stojsavljević et al., 2016). Tornik ski resort is located at an elevation of between 1110 – 1490 m, 9 km from the tourist resort of Zlatibor. The total capacity of the ski area is about 5400 skiers per hour. Four runs, Čigota, Tornik, Ribnica, and Zmajevac are covered by an artificial snowing system, so this ski resort no longer depends on snowy weather conditions.
Fig. 1. Physical map of Serbia with the investigated area.
2.2. Data and methods
The climatic and bioclimatic conditions of Zlatibor have been analyzed by using daily data from the Zlatibor meteorological station (43º44’N, 19º43’E, and elevation of 1028 m) during the period between 1992 and 2013. This data is recorded and provided by the Hydrometeorological Service of Serbia in accordance with standards recommended by the World Meteorological Organization (WMO).
Before the calculation of bioclimatological indices, the homogeneity of the meteorological datasets was examined according to the Alexandersson (1986) test. The homogeneity analysis indicated that the data for the observed station is homogeneous. There are several methods based on the human energy balance that have been used for the calculation of thermal comfort for tourism (Matzarkis, 2006). Commonly used indices that measure the effect of the thermal environment on humans are PMV (predicted mean vote) (Fanger, 1972), PET (physiologically equivalent temperature) (Mayer and Höppe, 1987; Höppe, 1999; Matzarakis et al., 1999), SET (standard effective temperature) (Gagge et al., 1986), PT (perceived temperature) (Staiger et al., 2012), and UTCI (universal thermal climate index) (Jendritzky et al., 2012). These thermal indices require input from the same meteorological variables (air temperature, air humidity, vapor pressure, wind speed, short- and long-wave radiation fluxes), but having a detailed thermophysiological basis. PET and UTCI are seen as preferable to other thermal indices because of their units (°C), which make results more comprehensive (Matzarakis et al., 1999).
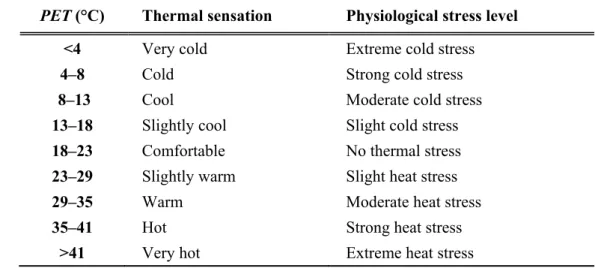
The PET values represent several meteorological parameters that influence the human energy balance such as air temperature, air humidity, wind speed, and short- and long-wave radiation. The calculation of PET also considers the heat transfer resistance of clothing and internal heat production (Matzarakis et al., 1999; Lin and Matzarakis, 2008; Zaninović and Matzarakis, 2009). The RayMan model was used to calculate PET (Matzarakis et al., 2007b, 2010; Matzarakis and Endler, 2010). The threshold values for PET have been developed in the form of a graded index (Matzarakis and Mayer, 1996) (Table 1). The PET (°C) is based on a complete heat budget model of the human body (Höppe, 1999), and it provides the equivalent temperature of isothermal reference environment with a water vapor pressure of 12 hPa (50% at 20 °C) and less air (0.1 m/s), at which the heat balance of a reference person is maintained with core and skin temperature equal to those under the conditions being assessed (Höppe, 1999).
The variables needed and used for calculation include air temperature (Ta), vapour pressure (VP), wind velocity (v), and mean radiant temperature (Tmrt).
Activity, clothing insulation, height, and weight that are usually standardized in Munich Energy Balance Model for Individuals (MEMI) represent human parameters that have a great influence on PET values (Matzarakis et al., 2011).
A typical indoor setting, for the reference person, is selected with work
metabolism of 80 W added to basic metabolism and with clothing insulation of 0.9 clo (Matzarakis et al., 1999; 2007b; Matzarakis and Endler, 2010). The PET values are calculated based on meteorological parameters measured at 7.00 a.m., 2.00 p.m., and 9.00 p.m.
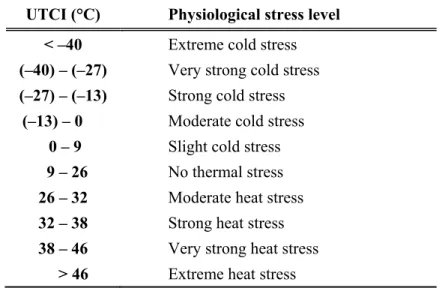
UTCI is defined as the ambient temperature corresponding to a reference environment that provides the same physiological response of a reference person as the actual environment (Bröde et al., 2012). The calculation is based on a multi-node model of human thermoregulation (Fiala et al., 2001), associated with a clothing model. The meteorological reference frame consists of the mean radiant temperature that is equal to the ambient temperature and the wind speed observed at 10 m above ground set at 0.5 m/s. The reference humidity is set at 50% for ambient temperatures of the reference ≤29 °C and at 20 hPa above. The non-meteorological reference is set at a metabolic rate of 135 W/m2 and a walking speed of 1.1 m/s. Additionally, by adjusting static clothing insulation to the ambient temperature reflecting seasonal clothing adaptation habits of Europeans, human perception of the outdoor climate is depicted (Havenith et al., 2012). The UTCI assessment scale is presented in Table 2. It is worth mentioning, that while the PET scale represents thermal sensations of thermal environment experienced by specific population, the UTCI scale was made to represent heat/cold stress intensities regardless the population type. The UTCI scale can be applied to a very wide range of temperatures, from –70 to +50 °C (Bleta et al., 2014). For the calculations of UTCI, the RayMan model was used.
Table 1. Physiological equivalent temperature (PET) for different grades of thermal sensation and physiological stress on human beings (Matzarakis et al., 1999)
PET (°C) Thermal sensation Physiological stress level
<4 Very cold Extreme cold stress
4–8 Cold Strong cold stress
8–13 Cool Moderate cold stress
13–18 Slightly cool Slight cold stress
18–23 Comfortable No thermal stress
23–29 Slightly warm Slight heat stress
29–35 Warm Moderate heat stress
35–41 Hot Strong heat stress
>41 Very hot Extreme heat stress
Table 2. UTCI assessment scale: UTCI is categorized in terms of thermal stress (Bröde et al., 2012)
UTCI (°C) Physiological stress level
< –40 Extreme cold stress (–40) – (–27) Very strong cold stress (–27) – (–13) Strong cold stress (–13) – 0 Moderate cold stress
0 – 9 Slight cold stress 9 – 26 No thermal stress 26 – 32 Moderate heat stress 32 – 38 Strong heat stress 38 – 46 Very strong heat stress > 46 Extreme heat stress
The bioclimatic conditions, PET and UTCI values are analyzed by means of the annual course of the 10-day mean values of thermal sensation at 7.00 a.m., 2.00 p.m., and 9.00 p.m. during the year. The likelihood of occurrence of mean daily thermal sensation during the year is also included together with the likelihood of occurrences in the morning, afternoon, and evening. This presents a more complete picture of the bioclimatic conditions, and enables everyone to choose the most convenient period for a holiday, considering their personal preferences. The presentation using the temporal resolution of 10 days is very appropriate for tourism, as holidays usually last a week or two, rather than a whole month (Zaninović and Matzarakis, 2009).
All of the above mentioned parameters are calculated for Zlatibor Mountain, in order to present the climate and bioclimate information to tourists.
Furthermore, the results could be presented in a form of bioclimatological leaflet (Zaninović and Matzarakis, 2009). It is imagined to contain the annual cycle of meteorological variables that are important for tourism and recreation based on 10-day periods (Zaninović, 2001; Lin and Matzarakis, 2008). Parameters that affect tourism on thermal (air temperature, thermal perception), physical (precipitation, snow, wind), and aesthetic dimensions (daylight and clouds) were treated together and were evaluated in a 10-day time resolution (de Freitas, 1990; de Freitas and Matzarakis, 2005). Additionally, annual distribution of mean, mean minimum, and mean maximum temperatures, as well as the number of days with different temperature threshold, representing ice days (Tmax<0 °C),
frost days (Tmin<0 °C), warm days (Tmax≥25 °C), tropical days (Tmax≥30 °C) were presented. Cloudiness and the number of clear and overcast days, as well as number of foggy days are included in the aesthetic part of the analysis. Physical factors incorporate the number of days with precipitation, rain, and snow cover. In addition to climatological and bioclimatological parameters, CTIS (Matzarakis, 2007a, 2007b; Lin and Matzarakis, 2008; Zaninović and Matzarakis, 2009;
Matzarakis, 2014) and WSI were used for more successful representation of tourism and recreational conditions in the investigated area (Zaninović and Matzarakis, 2009; Blazejczyk and Matzarakis, 2008).
CTIS is very useful in providing information on the frequency of various features of weather in consecutive 10-day periods of the year. Thus, CTIS makes the analysis which weather properties would be useful for specific tourism activity very easy. The CTIS diagram includes thermal, aesthetic, and physical components of weather as follows:
• Thermal comfort (18.0 °C < PET < 29.0 °C);
• Cold stress (PET < 0.0 °C);
• Heat stress (PET > 35.0 °C);
• Sultriness (VP > 18.0 hPa);
• Sunshine days (cloud cover < 4 octas);
• Dry conditions, dry day (precipitation (RR) ≤ 1 mm per day);
• Wet conditions, rainy day (RR > 5 mm per day);
• Foggy days (relative humidity (RH) > 93 %);
• Windy days (v > 8 m/s);
• Skiing potential (snow cover > 10 and 30 cm).
For parameters 1, 2, 5, 6, 7, 9, greater probability means less favorable conditions, while for parameters 3, 4, 8, greater probabilities indicates more favorable conditions.
Additionally, WSI provides synthetic information about the suitability of weather for different forms of recreational and tourism activities: passive (sun and air bathing) and active (mild and intensive) (Blazejczyk, 2007a; 2007b). WSI describes weather conditions using seven digits: thermal sensations (due to Subjective temperature – STI), radiation stimuli (due to absorbed portion of radiation), physiological strain (due to the physiological strain index – PhS), sultriness (due to the heat stress index – HSI), daily thermal contrast (due to the temperature amplitude), rain (snow) fall (> 1 mm), and snow cover (> 10 cm) (Blazejczyk, 2007a; 2007b).
Every weather condition was assigned a specific code based on particular forms of recreation: sun baths (SB), air baths (AB), mild recreational activity (e.g., walking, light plays, shopping – MR), intensive recreation and summer tourism (e.g., football, biking, climbing, jogging, etc. – AR), and ski tourism (ST). Every weather condition was estimated using WSI as follows: 0 – unfavorable, 1 – favorable with limitations, 3 – favorable without limitations (Blazejczyk and Matzarakis, 2008). Calculation of all of the above mentioned parameters is adopted from the approach given by Basarin et al. (2014).
3. Results
3.1. Air temperature (Ta), humidity (RH), vapor pressure (VP), precipitation (RR), snow, and wind (v)
The frequency distribution of air temperature (Ta) for the period from 1992 until 2013 is shown in Fig. 2.
Fig. 2. Relative frequency diagrams of mean daily air temperature for Zlatibor for the period from 1992 to 2013.
Hottest days occur during the summer months with up to 5% of values ranging from 25–30 °C in July and August. The highest percentage was observed in the third period of August. Coldest days can be observed from the second ten-day period in October until the beginning of April. In December and January, more than 50% of days display temperatures ranging between −10.0 and 0.0 °C. Days <−10 °C are rare and show the highest amount (8%) in the third ten-day period in January and February.
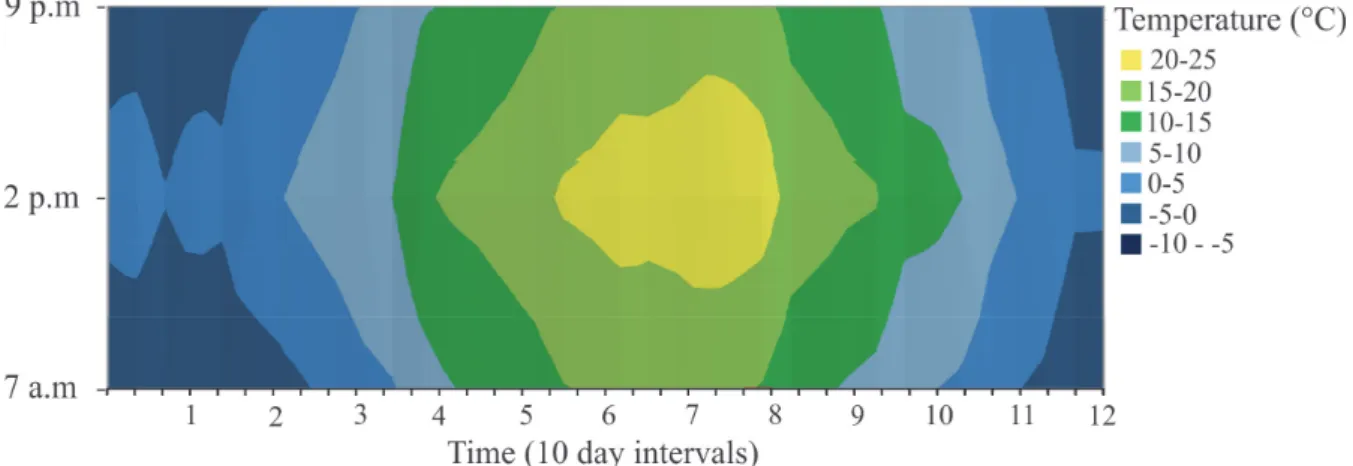
Air temperature is also analyzed by means of the annual course of the 10- day mean values measured at 7.00 a.m., 2.00 p.m., and 9.00 p.m. during the year (Fig. 3). The mornings and late afternoons are very cold ((–5)–0 °C) from November until the end of February. From the second ten-day period in April until the third ten-day period in August, mornings and late afternoons are pleasant with temperatures ranging from 10 to 20 °C. During noon in summer months, temperatures could be very high with average values ranging between 20–25 °C.
Fig. 3. Annual course of 10-day mean air temperatures at 7 a.m., 2 p.m., and 9 p.m. in Zlatibor for the period from1992 to 2013.
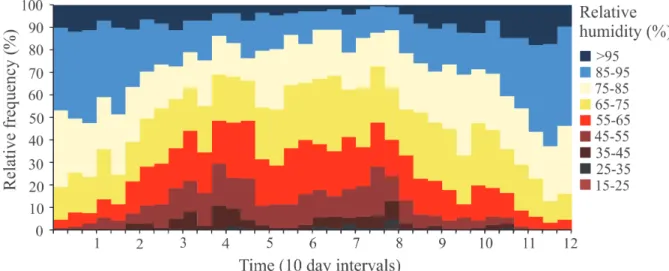
The same kind of frequency diagram was produced for RH and VP (Figs. 4 and 5). Values of RH show a high variability with atypical annual cycle. More than 50% of the values in the range between 85 and 95 and above 95% RH or even higher are observed during the winter months, December, January, and February. During the same period RH between 65% and 85% take up approximately 50% of values. In the summer months, values of RH between 45% and 75% occur in approximately 50% of the cases. Values lower than 45%
as well as values higher than 85% are rare and take up 10 to 15% of all the cases.
Fig. 4. Relative frequency diagram of relative humidity based on 10-day periods for mean daily values for Zlatibor for the period 1992–2013.
Fig. 5 shows the relative frequency diagram for VP. VP values equal or higher than 18 hPa, that characterize sultriness, occurs on the average from June until August. The highest amounts occur during July with approximately 10% of the cases. This number makes sultry events very rare at Zlatibor Mountain during the summer months.
Fig. 5. Relative frequency diagram of vapor pressure based on 10-day periods for mean daily values for Zlatibor for period 1992–2013.
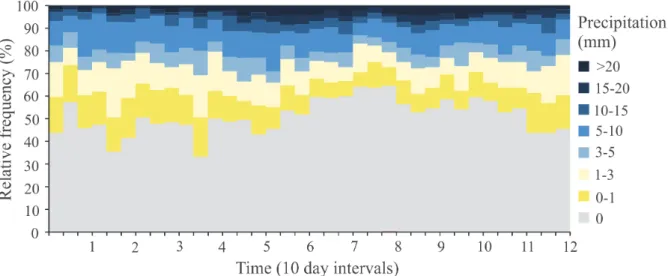
Average number of days with RR per year for Zlatibor during the investigated period was 178, days with no rain occur on average for 187 days, while the days with precipitation higher than 5 mm could be observed for 72 days. The frequency distribution of RR for Zlatibor was analyzed in order to characterize the rainy periods (Fig. 6). Rain events of low intensity (RR 0–
1 mm) occur all over the year in approximately 5–15% of the cases. Heavy rainfalls also appear throughout the year, but it seems that they are concentrated during late spring and summer months, respectively. The class of most intensive rainfall (RR>20.0 mm per day) was also recorded during the year, but in winter months at only 1–3% of the cases.
Fig. 6. Frequency diagram of precipitation classes for Zlatibor Mountain for the period 1992–2013.
A snow cover ≥1 cm can be expected at Zlatibor Mountain from the first half of October until the second half of April. Snowy winter lasts on average for more than five months (not with a continuous snow cover). Fig. 7 depicts the annual course of the mean monthly number of days with snow cover of different depth classes (≥1 cm, ≥10 cm, ≥30 cm, and ≥50 cm). It can be seen that autumn months (September – November), as well as the first part of winter (December) experience a rarer appearance of snow than the second half of the snow season (January and February).
Fig. 7. Annual course of mean monthly number of days with snow cover of different depth classes for Zlatibor Mountain in the period between 1992 and 2013.
Wind direction distribution is visualized by the use of wind charts based on mean values measured daily at 7 a.m., 2 p.m., and 9 p.m. (Figs. 8a–c). The prevailing wind directions are SW for all values. During mid-day, the N direction becomes dominant. Wind speeds between 1 and 3 m/s could be observed in approximately 20% of the cases registered at 7 a.m. During noon, the prevailing winds are N and SW with speeds ranging between 0.5–1 m/s in 10% of the cases. In the evening, the dominant winds have speeds in the same range as the ones in the noon (0.5–1 m/s).
Fig. 8. Wind roses for Zlatibor Mountain based on daily values, for the period from 1992 to 2013 (excluding calms); a) values measured at 7 a.m. (calms=9.7%), b) values measured at 2 p.m. (calms=3.7 %), and c) values measured at 9 p.m. (calms=11.9%).
3.2. Bioclimatological conditions
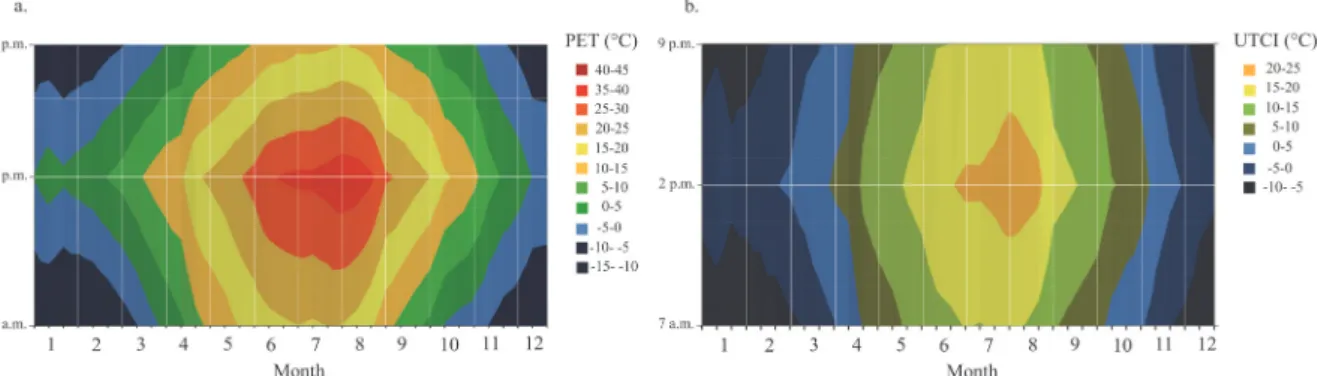
The different thermal sensations according to PET and UTCI values at 7 a.m., 2 p.m., and 9 p.m. in ten-day periods are shown in Fig. 9. An analysis of Zlatibor’s 10-day mean PET values between 1992 and 2013 shows, that extreme cold stress may be experienced in morning and evening hours during the colder part of the year (from the end of October through the second ten-day period of March). The extreme cold stress is relatively less observed during afternoons.
Better thermal comfort conditions are seen during spring and autumn. The second half of April, May, September, and the first half of October are characterized by PET values that seem to be comfortable mostly throughout the day. During summer, June, July, and August experience comfortable thermal conditions in the morning and in late afternoon. During noon in these months, a hot stress can be experienced (Fig. 9a). Similar thermal sensations concerning UTCI were observed (Fig. 9b). The extreme cold stress is observed during whole day in November, December, January, February, and even March. From the second ten-day period in April until July, and from the third ten-day period in August to the end of September, comfortable thermal conditions prevail throughout the day. The heat stress is only present during midday in July and August (Fig. 9b).
Fig. 9. Annual course of 10-day mean values of thermal sensation a) PET b) UTCI at 7 a.m., 2 p.m., and 9 p.m. at Zlatibor Mountain for the period 1992–2013.
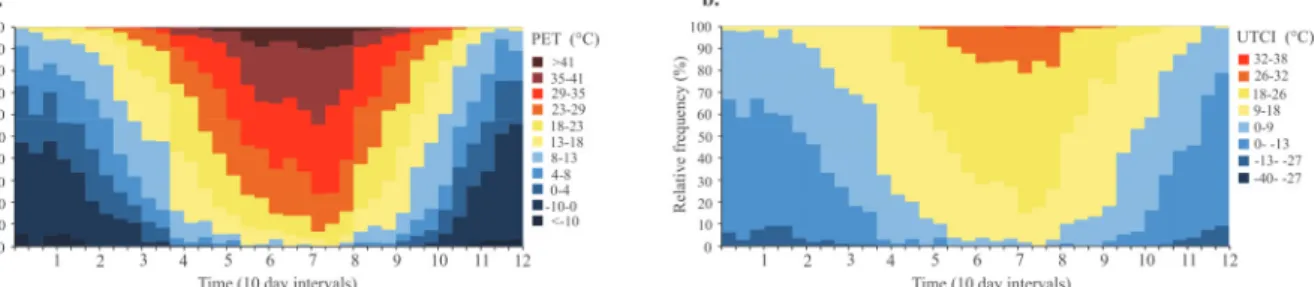
Relative frequencies for PET values divided into 11 classes are presented in Fig. 10a. Special thermal conditions are presented by specific class for ten-day intervals at 2 p.m. throughout the year during the period 1992–2013. Similarly, the frequencies of UTCI are also shown for ten-day periods at 2 p.m. for the entire year during the investigated period (Fig. 10b). Thermal comfort occurs throughout the entire year according to both PET and UTCI. PET values
between 18 and 23 °C with highest probability (>25%) occur in the third ten-day period in April and May, as well as in the end of September and October.
Comfortable thermal class of UTCI occurs mostly during spring and autumn months with the highest probability of more than 50%. PET classes that indicate cold stress (<0 °C) conditions can be observed from October to the end of March, with highest frequencies (∼50%) from December until the end of January. During the same period, the UTCI values lower than 0 °C can be seen from September to May. The highest frequencies of extreme cold stress (>50%) are present from December until the end of February. Days with strong heat stress, defined as PET values >35 °C, can be observed from the third ten-day period in April until the end of September with maximum frequencies (~30%) during June until August. UTCI values >26 °C are recorded from the end of May until the end of September with the highest frequencies in the beginning of August (~20%).
Fig. 10. The probability of occurrence of different thermal sensations a) PET and b) UTCI at 2 p.m. at Zlatibor Mountain for the period 1992–2013.
3.3. Climate-Tourism Information Scheme (CTIS) and Weather Suitability Index (WSI)
The annual courses of different parameters and factors that are described earlier are summarized clearly in the CTIS for Zlatibor Mountain (Fig. 11). Following the frequency of thermally unsuitable PET classes, the highest percentage of days with cold and heat stress is found in the monthly decades with a high proportion of cold or heat stress. Thus, the months with low percentage of these unfavorable PET classes are thermally favorable. The highest amount of thermally comfortable days is found in June, July, and August. When comparing the percentage of days with sunshine duration (>5h) to dry days, it can be seen that all over the year there are positive values. The lack of days with high wind speed contributes to the suitability of Zlatibor’s bioclimatological conditions
during summer months. Snow cover, which is an advantage in touristic terms, concentrates mostly at the end of December, during January, and February, which is recognized as the month with the highest occurrence of the days with snow cover higher than 10 cm.
Fig. 11. CTIS for Zlatibor Mountain (frequency of occurrence in the period 1992–2013 in percent).
Weather suitability index (WSI) provides another important clue about bioclimatological conditions for tourists and recreationists. It is used to assess the usefulness of particular weather conditions for different forms of activity.
Fig. 12 shows patterns in annual variability of WSI. It can be seen that the weather conditions most favorable for passive recreation (sun and air baths, WSI_SB and WSI_AB) occur during summer months. However, the conditions for mild recreational activity (e.g. walking, light plays, shopping – WSI_MR) are best during the warmer part of the year from the 150th day (end of May) until the 300th (end of October) of the year. On the other hand, intensive forms of active recreation (WSI_AR) can be practiced throughout the whole year. The weather conditions for ski tourism (WSI_ST) are favorable during winter due to the snow cover and snow cover duration. The ski season is prolonged using artificial snowing system installed at Tornik ski resort.
Fig. 12. Annual variations of weather suitability index for Zlatibor Mountain based on five-day intervals for the period between 1992 and 2013. The abbreviations are as follow:
WSI_SB - sun baths (right y-axis), WSI_AB - air baths (right y-axis), WSI_ST - ski tourism (left y-axis), WSI_MR - mild recreational activity (left y-axis), WSI_AR - intensive recreation and summer tourism(left y-axis); index values refer to 0 – unfavorable, 1 – favorable with limitations, 3 – favorable without limitations.
4. Discussion
Results of the earlier studies showed that bioclimatological indices such as PET and UTCI reflect the thermal condition better than air temperature, relative humidity, and other individual meteorological elements.
This study assesses the bioclimate potential for tourism of one of the most important tourism destinations in Serbia. Recently, the leaflet as a mean of presenting the climate and bioclimate information for tourists was introduced (Zaninović and Matzarakis, 2009). Similarly, in this study a climatological and bioclimatological brochure was proposed as a “tool” that could help tourists to learn more about the climate of the destination and choose the best time to travel. It evaluates the aesthetic, physical, and thermal conditions for Zlatibor Mountain in order to reveal its potential for tourism and recreation.
The bioclimatic indexes such as PET and UTCI are more understandable for people, which use their experience in an indoor environment to assess the outdoor thermal condition. Furthermore, the PET and UTCI frequencies for 10-day intervals combined with the results of the analysis of aesthetic weather
components, as well as physical variables, display the likelihood of certain perceptions in detail for the whole year (Lin and Matzarakis, 2008).
Similarly to Bursa’s (Çalışkan et al., 2012) and Hvar’s (Zaninović and Matzarakis, 2009) bioclimatological leaflet for Zlatibor mountain, in the left hand column, temperature conditions given in annual course of mean, mean minimum, and mean maximum values and annual course of relative humidity could be presented. Days with extreme temperature values suppose to be classified (hot days, tropical days, frost days, and tropical nights), and their annual distribution should be given in 10-day intervals. The components of aesthetic weather conditions such as cloudiness, insolation, as well as the number of clear and overcast days could be presented as well. Thermal parameters must be analyzed using PET and UTCI values in 10-day intervals.
The number of days with precipitation (snow and rain) should also be included, as well as days with different classes of snow depth. In addition, the brochure can also include precise information about the mean wind speed and direction over the year for the investigated area. For tourists that are fond of different recreational activities during their holiday, WSI could be included in the leaflet.
Lin and Matzarakis (2008) showed that the number of tourists visiting the Sun Moon Lake in Taiwan is not significantly affected by climatic and bioclimatic factors. They argued that the most frequently visited periods are not the best time for visit, as tourists may suffer from cold stress or rainy periods.
According to the Statistical Office of the Republic of Serbia, more than 106,000 people, mainly domestic tourists visited The Zlatibor Mountain. As shown by Stojsavljević et al. (2016), an increase in the number of tourists can be observed in the period 2001–2014. Using the monthly data about tourist visits for the period between 2000 and 2013 and the average monthly PET values for the same period, the correlation coefficient is 0.6, and it is statistically significant (p<0.05) (Fig. 13). Comparing the mean monthly UTCI values, the Pearson correlation coefficient is even higher, it is 0.7 (p<0.05). It could be seen that the highest number of tourists visit Zlatibor during May, June, August, and September, when the thermal comfort conditions occur on more than 30% of the cases for PET and more than 50% for UTCI, as the comfort range for UTCI scale is considerably higher.
Fig. 13. Annual and seasonal number of tourists who visited Zlatibor during the period between 2000 and 2013.
5. Conclusion
The aim of this study was to analyze Zlatibors’s climatic and bioclimatic conditions, as well as their variability and distribution over the year in order to provide substantial information for the tourism and tourism industry in general.
The results were the basis for the creation of a bioclimate and tourism climate brochure, which is user-friendly and understandable by everyone. It is produced to be used as part of tourism promotions, and it is very important for the evaluation of various natural resources and alternatives. Since Zlatibor offers thermo physiologically comfortable conditions during spring and autumn, but also during morning and late afternoons in summer, the mountain resort is suitable for different health, recreation, and other tourism activities from May to September. The number of days with snow cover higher than 10 cm enhanced with artificial snowing system enables the continuous ski-season from December until April. One advantage of Zlatibor’s climatology is that insolation during the day in summer is higher than 10 hours, which makes it one of the sunniest destinations in Serbia. Snowy winters, thermos-physiologically comfortable spring and autumn, as well as warm summers, provide favorable bioclimatological conditions, thus allowing year-round touristic activities.
Monitoring of detailed bioclimate parameters and their variability on the local, regional, and national level can contribute to the creation of the suitable platform for the strategic planning and adaptation of tourist destinations in Serbia and neighboring countries as well.
Acknowledgements: This research was supported by Project 176020 of the Serbian Ministry of Education, Science and Technological Development and by Project 114-451-2080/2016 of the Provincial Secretariat for Science and Technological Development, Vojvodina Province.
References
Alexandersson, H., 1986: A homogeneity test applied to precipitation data. J. Climatol. 6, 661–675.
https://doi.org/10.1002/joc.3370060607
Amelung, B., Blazejczyk, K., and Matzarakis, A., 2007: Climate change and tourism: assessment and coping strategies. Maastricht–Warsaw– Freiburg. 1–227.
Basarin, B., Kržič, A., Lazić, L., Lukić, T., Đorđević, J., Janićijević Petrović, B., Ćopić, S., Matić, D., Hrnjak, I., and Matzarakis, A. 2014: Evaluation of bioclimate conditions in two Special Nature Reserves in Vojvodina (Northern Serbia). Carpathian J. Earth Environ. Sci. 9 (4), 93–108.
Błazejczyk, K., Epstein, Y., Jendritzky, G., Staiger, H., and Tinz, B., 2012: Comparison of UTCI to selected thermal indices. Int. J. Biometeorol. 56, 515–535.
https://doi.org/10.1007/s00484-011-0453-2
Blazejczyk, K., 2007a: Weather limitations for winter and summer tourism in Europe. In (Eds.
Matzarakis, A., de Freitas, C.R. and Scott, D.) Developments in Tourism Climatology.
Commission on Climate, Tourism and Recreation, International Society of Biometeorology, Freiburg. 116–121.
Blazejczyk, K., 2007b: Multiannual and seasonal weather fluctuations and tourism in Poland. In (Eds.
Amelung, B., Blazejczyk, K. and Matzarakis A.) Climate Change and Tourism Assessment and Copying Strategies. Albert-Ludwig Universitaet Freiburg, Maastricht – Warsaw – Freiburg. 69–90.
Blazejczyk, K. and Matzarakis, A., 2008: Evaluation of climate from the point of view of recreation and tourism. In (Ed. Masami, I.), Proceedings of the 18th International Congress of Biometeorology, Harmony within Nature. CD Hum3-COST-O04, 1–4.
Bleta, A., Nastos, P. T., and Matzarakis, A., 2014: Assessment of bioclimatic conditions on Crete Island, Greece. Regional Environ. Change 14, 1967–1981.
https://doi.org/10.1007/s10113-013-0530-7
Bröde, P., Fiala, D., Blazejczyk, K., Holmer, I., Jendritzky, G., Kampmann, B., Tinz, B., and Havenith, G., 2012: Deriving the operational procedure for the Universal Thermal Climate Index (UTCI), Int. J. Biometeorol. 56, 481–494. https://doi.org/10.1007/s00484-011-0454-1
Brosy, C., Zaninović, K., and Matzarakis, A., 2014: Quantification of climate tourism potential of Croatia based on measured data and regional modeling, Int. J. Biometeorol. 58, 1369–1381.
https://doi.org/10.1007/s00484-013-0738-8
Çalışkan, O., Çiçek, I., and Matzarakis, A., 2011: The climate and bioclimate of Bursa (Turkey) from the perspective of tourism, Theor. Appl. Climatol. 107, 417–425.
https://doi.org/10.1007/s00704-011-0489-6
de Freitas C.R., 1990: Recreation climate assessment. Int. J. Climatol. 10, 89–103.
https://doi.org/10.1002/joc.3370100110
de Freitas C.R., 2003: Tourism climatology: evaluating environmental information for decision making and business planning in the recreation and tourism sector. Int. J. Biometeorol. 48, 45–54.
https://doi.org/10.1007/s00484-003-0177-z
de Freitas C.R. and Matzarakis, A., 2005: Recent developments in tourism climatology, Bull. German Meteorol. Soc. 1, 2–4.
Dragović, R., Filipović, I., and Nikolić, J., 2009:Iskoristivost prirodno-geografskih uslova Zlatibora i Zlatara za razvoj ekoturizma i zdravstvenog turizma. Bull. Serbian Geogr. Soc. 89, 115–128. (in Serbian). https://doi.org/10.2298/GSGD0901115D
Fanger P.O., 1972: Thermal comfort: analysis and applications in environmental engineering.
McGraw-Hill, New York. 1–244.
Fiala, D., Lomas, K.J., and Stohrer, M., 2001: Computer prediction of human thermoregulatory and temperature responses to a wide range of environmental conditions. Int. J. Biometeorol. 45, 143–159. https://doi.org/10.1007/s004840100099
Gagge, A.P., Fobelets, A.P., and Berglund, L.G., 1986: A standard predictive index of human response of the thermal environment, ASHRAE Trans 92, 709–731.
Gössling, S. and Hall, C.M., 2006: Uncertainties in predicting tourist travel flows based on models, Climatic Change 79, 163–173. https://doi.org/10.1007/s10584-006-9081-y
Gössling, S., Hall, C.M., Peeters, P., and Scott, D., 2010: The future of tourism: a climate change mitigation perspective. Tourism Recreat. Res. 35, 119–130.
https://doi.org/10.1080/02508281.2010.11081628
Grigorieva, E. and Matzarakis, A., 2011: Physiologically equivalent temperature as a factor for tourism in extreme climate regions in the Russian Far East: preliminary results, Eur. J. Tourism, Hosp. and Recreation 2, 127–142.
Gulyás, Á. and Matzarakis, A., 2009: Seasonal and spatial distribution of PET – physiologically equivalent temperature (PET) in Hungary. Időjárás 113, 221–231.
Gulyas, A., Unger, J., and Matzarakis, A., 2006: Assessment of the microclimatic and human comfort conditions in a complex urban environment: modelling and measurements, Build. Environ. 41, 1713–1722. https://doi.org/10.1016/j.buildenv.2005.07.001
Hall C.M. and Higham J., 2005: Tourism, recreation and climate change (Aspects in tourism).
Channel View, Claverdon. 1–328.
Havenith, G., Fiala, D., Błazejczyk, K., Richards, M., Bröde, P., Holmér, I., Rintamaki, H., Benshabat, Y., and Jendritzky, G., 2012: The UTCI clothing model, Int. J. Biometeorol. 56, 461–470.
https://doi.org/10.1007/s00484-011-0451-4
Höppe, P., 1999: The physiological equivalent temperature- a universal index for the biometeorological assessment of the thermal environment, Int. J. Biometeorol. 43, 71–75.
https://doi.org/10.1007/s004840050118
Idzikowska, D., 2010: Differences in bioclimatic conditions in four European cities: Budapest, Paris, Rome and Warsaw. In (Eds. Matzarakis, A., Mayer, H. and Chmielewski, F.M.) Proceedings of the 7th Conference on Biometeorology. 201–206.
Jendritzky, G., de Dear, R., Havenith, G., 2012: UTCI—Why another thermal index?, Int. J.
Biometeorol. 56, 421–428. https://doi.org/10.1007/s00484-011-0513-7
Jopp, R., DeLacy, T., and Mair, J., 2010: Developing a framework for regional destination adaptation to climate change, Curr. Iss. Tourism 13, 591–605. https://doi.org/10.1080/13683501003653379 Jovanović, D., Govedarica, M., Sabo, F., Bugarinović, Ž., Novović, O., Beker, T., and Lauter, M., 2015: Land Cover change detection by using Remote Sensing – A Case Study of Zlatibor (Serbia). Geographica Pannonica 19, 162–173. https://doi.org/10.5937/GeoPan1504162J
Katerusha, O. and Matzarakis, A., 2015: Thermal Bioclimate and Climate Tourism Analysis for Odessa. Geografiska Annaler: Series A, Physical Geography 97, 671–679.
https://doi.org/10.1111/geoa.12107
Kovács, A., Németh, A., Unger, J., and Kántor, N. 2017: Tourism climatic conditions of Hungary – present situation and assessment of future changes. Időjárás 121, 79–99.
Kunert, A., 2010: Modeling of UTCI index in various types of landscape. In ((Eds. Matzarakis, A., Mayer, H. and Chmielewski, F.M.,), Proceedings of the 7th Conference on Biometeorology.
302–307.
Lin, T.P. and Matzarakis, A., 2008: Tourism climate and thermal comfort in Sun Moon Lake, Taiwan, Int. J. Biometeorol. 52, 281–290. https://doi.org/10.1007/s00484-007-0122-7
Lindner, K., 2011: Assessment of sensible climate in Warsaw using UTCI, Prace i Studia Geograficzne 47, 285–291.
Matzarakis, A., 2006: Weather and climate related information for tourism, Tourism Hospital. Plan.
Develop. 3, 99–115.
Matzarakis, A., 2007: Assessment method for climate and tourism based on daily data. In (Eds.
Matzarakis, A., de Freitas C.R. and Scott D.), Developments in tourism climatology.
Commission on Climate, Tourism and Recreation, International Society of Biometeorology, Freiburg. 52–58.
Matzarakis, A., 2010: Climate change: temporal and spatial dimension of adaptation possibilities at regional and local scale. In (Ed. Schott, C.), Tourism and the implications of climate change:
issues and actions (Bridging tourism theory and practice vol. 3). Emerald Group Publishing, Bingley. 237–259.
Matzarakis, A., 2014: Transfer of climate data for tourism applications – The Climate- Tourism/Transfer-Information-Scheme. Sust. Environ. Res. 24, 273–280.
Matzarakis, A. and Mayer, H., 1996: Another kind of environmental stress: thermal stress. WHO Newsletter 18, 7–10.
Matzarakis, A., Mayer, H., and Iziomon, M.G., 1999: Applications of a universal thermal index:
physiological equivalent temperature, Int. J. Biometeorol. 43, 76–84.
https://doi.org/10.1007/s004840050119
Matzarakis, A. and de Freitas, C.R., 2001: Proceedings of the first international workshop on climate, tourism and recreation. International Society of Biometeorology, Commission on Climate Tourism and Recreation, Freiburg. 1–270.
Matzarakis, A. and Amelung, B., 2008: Physiologically equivalent temperature as indicator for impacts of climate change on thermal comfort of humans. In (Eds. Thomson, M.C., Garcia-Herrera, R.
and Beniston, M.) Seasonal Forecasts, Climatic Change and Human Health. Advances in Global Change Research, vol. 30. Springer Sciences and Business Media, Berlin. 161–172.
https://doi.org/10.1007/978-1-4020-6877-5_10
Matzarakis, A., de Freitas, C. R., and Scott, D., 2007a: Developments in tourism climatology.
Commission on Climate, Tourism and Recreation, International Society of Biometeorology, Freiburg. 1–289.
Matzarakis, A., Rutz, F., and Mayer, H., 2007b: Modelling Radiation fluxes in simple and complex environments – application of the RayMan model. Int. J. Biometeorol. 51, 323–334.
https://doi.org/10.1007/s00484-006-0061-8
Matzarakis, A. and Endler, C., 2010: Climate change and thermal bioclimate in cities: impacts and options for adaptation in Freiburg, Germany. Int. J. Biometeorol. 54, 479–483.
https://doi.org/10.1007/s00484-009-0296-2
Matzarakis, A., Rutz, F., and Mayer H., 2010: Modelling Radiation fluxes in simple and complex environments – Basics of the RayMan model. Int. J. Biometeorol. 54, 131–139.
https://doi.org/10.1007/s00484-009-0261-0
Matzarakis, A., Muthers, S., and Koch, E., 2011: Human biometeorological evaluation of heat-related mortality in Vienna. Theor. Appl. Climatol. 105, 1–10.
https://doi.org/10.1007/s00704-010-0372-x
Matzarakis, A., Rammelberg, J., and Junk, J., 2013: Assessment of thermal bioclimate and tourism climate potential for central Europe—the example of Luxembourg. Theor. Appl. Climatol. 114, 193–202. https://doi.org/10.1007/s00704-013-0835-y
Mayer, H. and Höppe, P., 1987: Thermal comfort of man in different urban environments, Theor.
Appl. Climatol. 38, 43–49. https://doi.org/10.1007/BF00866252
Mieczkowski, Z., 1985: The tourism climate index: a method for evaluating world climates for tourism.
Canadian Geographer 29, 220–233. https://doi.org/10.1111/j.1541-0064.1985.tb00365.x Scott, D. and Lemieux, C., 2010: Weather and climate information for tourism, Procedia Environ. Sci. 1,
146–183. https://doi.org/10.1016/j.proenv.2010.09.011
Scott, D., McBoyle, G., and Schwartzentruber, M., 2004: Climate change and the distribution of climatic resources for tourism in North America, Climate res. 27, 105–117.
https://doi.org/10.3354/cr027105
Scott, D., McBoyle, G., Minogue, A., and Mills, B., 2006: Climate change and the sustainability of ski- based tourism in Eastern North America: a reassessment, J. Leisure Res. 14, 376–398.
https://doi.org/10.2167/jost550.0
Staiger, H., Laschewski, G., and Grätz, A., 2012: The Perceived Temperature – A versatile index for the assessment of the human thermal environment. Scientific Basics. Part A, Int. J. Biometeorol.
56, 165–176.
Stojićević, G., Basarin, B., and Lukić, T. 2016: Detailed bioclimate analysis of Banja Koviljača (Serbia). Geographica Pannonica 20, 127–135.
Stojsavljević, R., Božić, S., Kovačević, M., Bubalo Živković, M., and Miljković, Đ. 2016: Influence of selected climate parameters on tourist traffic of Kopaonik and Zlatibor mountains (Republic of Serbia). Geographica Pannonica 20, 208–219.
Thorsson, S., Honjo, T., Lindberg, F., Eliasson, I., and Lim, E., 2007: Thermal comfort and outdoor activity in Japanese Urban Public Places, Environ. Behavior 39, 1–25.
Zaninović, K., 2001: The bioclimatic potential of Croatian Adriatic coast. In (Eds. Matzarakis A. and de Freitas, C.R.), Proceedings of the First International Workshop on Climate, Tourism and Recreation. 257–265.
Zaninović, K. and Matzarakis, A., 2007: Climatic changes in thermal comfort at the Adriatic coast. In (Eds. Amelung, B., Blazejczyk, K. and Matzarakis, A.) Climate Change and Tourism:
Assessment and Coping Strategies. 155–164.
Zaninović, K. and Matzarakis, A., 2009: The bioclimatological leaflet as a means conveying climatological information to tourists and the tourism industry, Int. J. Biometeorol. 53, 369–374.