DOI:10.28974/idojaras.2018.1.3
IDŐJÁRÁS
Quarterly Journal of the Hungarian Meteorological Service Vol. 122, No. 1, January – March, 2018, pp. 31–40
Impact of precipitation and temperature on the grain and protein yield of wheat (Triticum aestivum L) varieties
Márton Jolánkai*, Katalin Kassai M., Ákos Tarnawa, Barnabás Pósa, and Márta Birkás
Szent István University Crop Production Institute, Páter Károly utca 1., 2100 Gödöllő, Hungary
*Corresponding author E-mail: jolankai.marton@mkk.szie.hu (Manuscript received in final form April 11, 2017)
Abstract⎯Impacts of agronomic applications were studied in a field experiment to determine water availability, grain yield, and protein formation interrelations. Three winter wheat varieties and six nitrogen application levels were applied in two consecutive crop years representing different precipitation and temperature patterns to evaluate yield, yield components, and quality manifestation. The research results suggest that precipitation patterns in relation with the wheat development phenophases had profound influence on the grain yield and protein formation of wheat crop. Varietal differences were determined regarding yield and protein values in relation with plant nutrition and crop year impacts. There were no, or minor differences only between varieties, however plant nutrition treatments induced significant differences in both crop years.
Key-words: crop year weather, nitrogen supply, wheat, grain yield, protein yield
1. Introduction
The amount and quality of grain yield of winter wheat Triticum aestivum L. is highly influenced by the meteorological conditions of the given crop year, especially the amount and distribution of precipitation and the actual temperature (Grimwade et al., 1996; Győri, 2008; Pepó, 2010). Temperature
patterns have been changed and are associated with warming. The growing season has been modified during the past decades in the Carpathian Region (Lakatos et al., 2016). Weather conditions are evaluated and labeled favorable or non-favorable in relation with the optimum requirements of the crops’
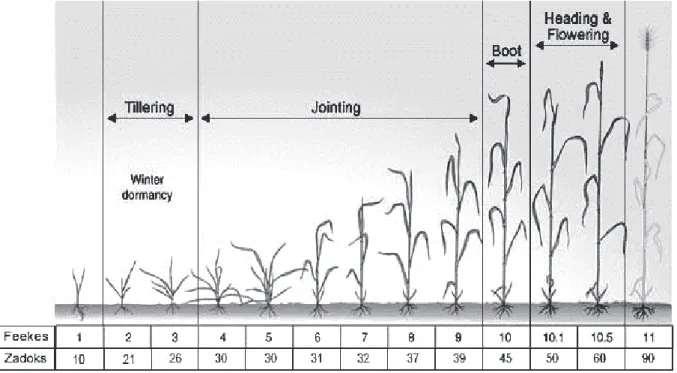
phenophases (Lásztity, 1999; Ványiné and Nagy, 2012). In case of precipitation, the most vulnerable periods during growth and development of winter wheat are the phenophases of heading and flowering (stage 10–10.5 on the Feekes scale;
stage 51–70 on the Zadoks scale). In relation with temperature, two critical periods can be detected. One is the vernalization, and the other is the ripening stage (Feekes 1–3 and 11; Zadoks 10–13 and 71–99) (Pollhamer, 1981;
Kismányoky and Ragasits, 2003).
Crop yield and grain quality can also be influenced by agronomic applications. Plant nutrition in general and N topdressing in particular should be considered as the most effective treatments within the technologies of winter wheat production. The amount of nitrogen and the timing and distribution of the application have an impact on wheat quality, especially on the protein production of the crop (Győri, 2006; Pepó, 2010; Vida et al., 1996).
2. Materials and methods
High milling and baking quality winter wheat Triticum aestivum L. varieties were examined under identical agronomic conditions in a long term field trial.
The small plot trials were run at the Nagygombos experimental field of the Szent István University, Crop Production Institute, Hungary (N 47o40’58” – E 19o40’11”). Soil type of the experimental field is chernozem (calciustoll).
Annual precipitation of the experimental site belongs to the 550–600 mm belt of the northern edges of the Hungarian Great Plain. Experiments were conducted in a split-plot design with four replications. The size of each plot was 10 m2. Plots were sown and harvested by plot machines (standard Wintersteiger cereal specific experimental plot machinery series). Various identical agronomic treatments were applied to plots. Plant nutrition applications were done in single and combined treatments. Nitrogen topdressing variants were representing 6 levels: 0, 80, 80+40, 120, 120+40 and 160 kg/ha, nitrogen in single and split applications. All plots were sown with identical series of wheat varieties for studying their performance related to agronomic impacts.
The recent study presents the performance and evaluations of three winter wheat varieties (Alföld-90, Mv Karéj, and Mv Toborzó) of 2014–2015 and the 2015–2016 crop years. Wheat grain quality parameters: protein and wet gluten contents were determined from grain samples, as well as quality characteristics at the Research Laboratory of the Crop Production Institute of
protein figures correlated with the treatments applied, and analyses were done by Microsoft Office 2003 statistical programmes (Horváth, 2014). Fig. 1 demonstrates the phenophases of winter wheat by the grading of two internationally used systems. Phenological phases have been evaluated in accordance with the monthly precipitation and temperature figures of the respective crop years by the methods of Pollhamer (1981) and Kismányoky and Ragasits (2003).
Fig. 1. Growth stages of winter wheat - Feekes and Zadoks values. (Source: Kismányoky and Ragasits, 2003).
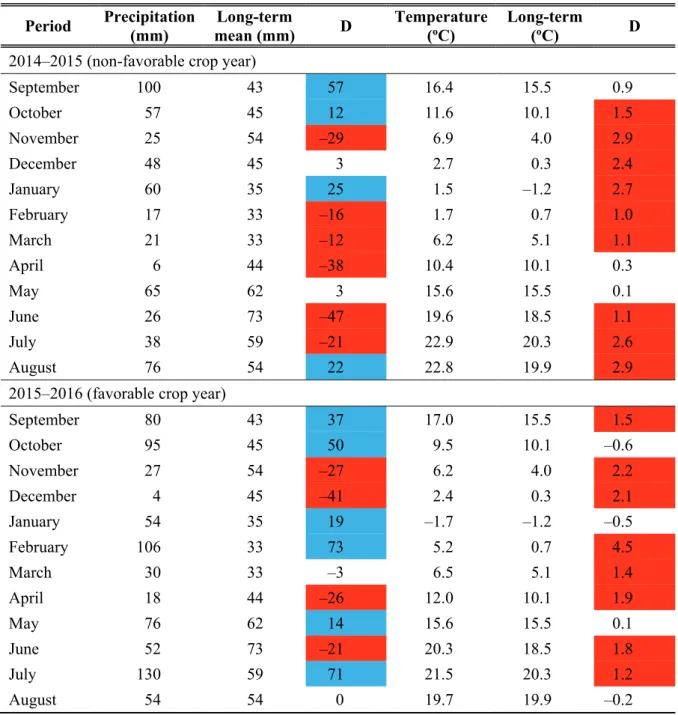
Crop year conditions were evaluated in accordance with the monthly values of temperature and precipitation in non-favorable (2014–2015) and favorable (2015–2016) crop years during the vegetation period.
The monthly periods are considered in accordance with the magnitude of deviation in relation with the long-term mean temperature and precipitation values. A plus or minus 20% of precipitation and 1 oC of temperature were applied as threshold values as it is indicated in Table 1.
Table 1. Precipitation and temperature patterns of experimental site during the respective crop years. Nagygombos 2014–2015; 2015–2016. Source: KDVVIZIG (2016)
Period Precipitation (mm)
Long-term
mean (mm) D Temperature (oC)
Long-term
(oC) D 2014–2015 (non-favorable crop year)
September 100 43 57 16.4 15.5 0.9
October 57 45 12 11.6 10.1 1.5
November 25 54 –29 6.9 4.0 2.9
December 48 45 3 2.7 0.3 2.4
January 60 35 25 1.5 –1.2 2.7
February 17 33 –16 1.7 0.7 1.0
March 21 33 –12 6.2 5.1 1.1
April 6 44 –38 10.4 10.1 0.3
May 65 62 3 15.6 15.5 0.1
June 26 73 –47 19.6 18.5 1.1
July 38 59 –21 22.9 20.3 2.6
August 76 54 22 22.8 19.9 2.9
2015–2016 (favorable crop year)
September 80 43 37 17.0 15.5 1.5
October 95 45 50 9.5 10.1 –0.6
November 27 54 –27 6.2 4.0 2.2
December 4 45 –41 2.4 0.3 2.1
January 54 35 19 –1.7 –1.2 –0.5
February 106 33 73 5.2 0.7 4.5
March 30 33 –3 6.5 5.1 1.4
April 18 44 –26 12.0 10.1 1.9
May 76 62 14 15.6 15.5 0.1
June 52 73 –21 20.3 18.5 1.8
July 130 59 71 21.5 20.3 1.2
August 54 54 0 19.7 19.9 –0.2
long-term data: 1971–2000
3. Results and discussion
The two consecutive crop years represented different meteorological conditions
deficiency was –7.1%, however, the distribution of that was much more diverse.
The magnitude of water deficiency with an exception of one spring month ranged from –12 to –47% during the critical phenophases from tillering to flowering. At the same time, the temperature values proved to be 1.6 oC higher than the long term average. Especially, the warm and frost free winter period may have influenced the vernalisation processes of the crop.
The 2015–2016 crop year provided the wheat crop with more favorable conditions. The amount of precipitation was 25.1% higher, and the distribution of that was better concerning the phenophases. The temperature patterns were closer to that of the long-term values, however, this crop year was also 1.3 oC warmer than the average.
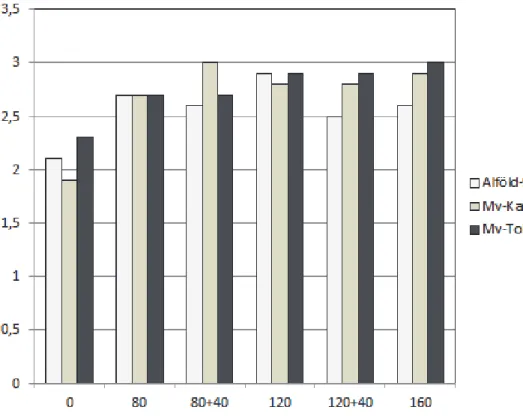
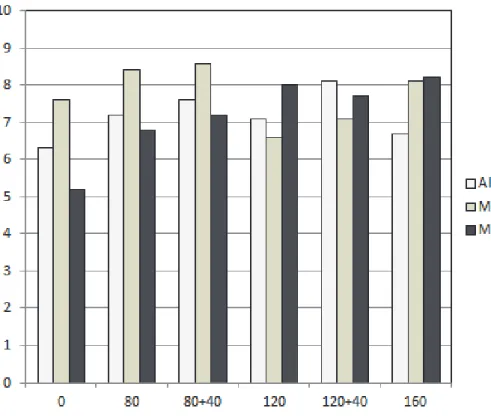
Yield results of the trial are summarized in Figs. 2 and 3. The total amount of grain yield (t/ha) is indicated for the two respective crop years for all the wheat varieties examined.
The results suggest, that the two crop years examined had different levels of grain yield of certain varieties. In 2015 grain yield amounts ranged from 1,9 to 3.1 t/ha with definite differences between N applications, while in 2016 this turned to be 5.1 to 8.6 showing less variations between plant nutrition treatments. In both crop years only minor varietal differences were detected.
Fig. 2. Total grain yields in the non-favorable crop year. Nagygombos, 2015.
Fig. 3. Total grain yields in favorable crop year. Nagygombos, 2016.
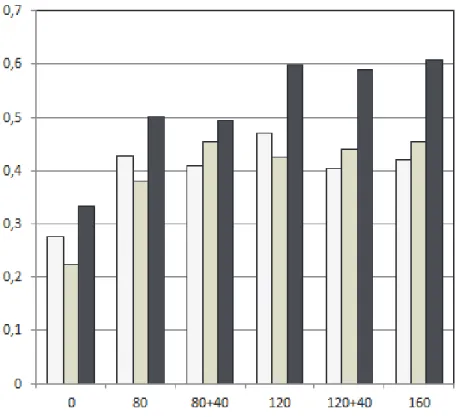
Quality information is provided by Figs. 4 and 5. The total amount of protein yield (t/ha) is indicated for the two respective crops years by all the wheat varieties examined. The results obtained highlight three factors. The first is the difference between the amounts of protein yield. In the arid year 2015, the range of total amount of protein was between 224 and 609 kg/ha.
2016, a favorable crop year resulted in 692 and 1247 kg/ha protein yield values.
The second is the consequent differences between the impacts of nitrogen application levels. These differences were significantly bigger in the favorable crop year in comparison with those of the non-favorable vintage.
The reason of such deviation was due to the amount of precipitation during the phenophases of flowering and grain filling of the respective crop years.
Fig. 4. Total protein yields in non-favorable crop year. Nagygombos, 2016.
Fig. 5. Total protein yields in the favorable crop year. Nagygombos, 2016.
The third factor detected was the performance of varieties. From among the three varieties examined, two cultivars – Mv Karéj and Mv Toborzó proved to be the most efficient regarding the amount of total protein yield production. The highest protein yields were obtained by Mv Toborzó in both years.
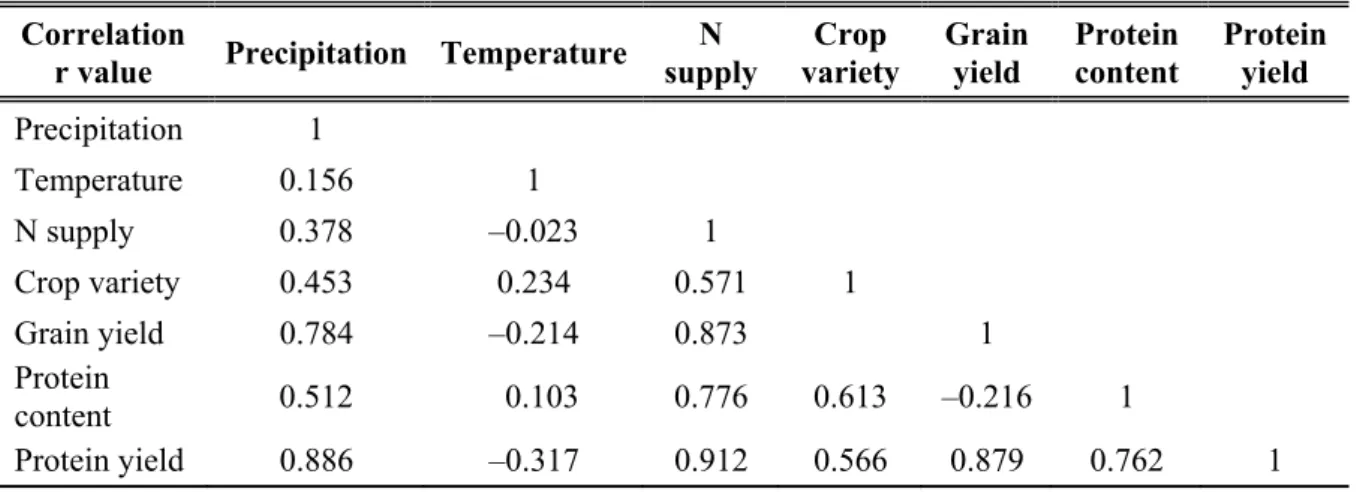
Table 2 presents correlation figures of experimental variants for both crop years. For better understanding, the tables show data on further interrelations not discussed in this paper, but which may provide information on the protein formation performance, like the pattern of monthly temperature, or the protein content of grain yield samples.
The experimental results suggest that the strongest correlation was detected between the total amount of protein and the experimental treatments, with no impact of crop years’ weather in accordance with the findings of Győri (2008) and Pepó (2010).
Table 2. Correlation between precipitation, temperature, plant nutrition (control versus treatments), grain yield, and protein yield of wheat varieties. Nagygombos, 2015, 2016.
Correlation
r value Precipitation Temperature N supply
Crop variety
Grain yield
Protein content
Protein yield
Precipitation 1
Temperature 0.156 1 N supply 0.378 –0.023 1
Crop variety 0.453 0.234 0.571 1
Grain yield 0.784 –0.214 0.873 1 Protein
content 0.512 0.103 0.776 0.613 –0.216 1
Protein yield 0.886 –0.317 0.912 0.566 0.879 0.762 1
Yield figures of the cultivars were in close correlation with plant nutrition with a few exceptions only. However, this correlation proved to be stronger and at the same time more balanced in the favorable crop year.
The correlations of crop yield components were much weaker in both crop years in comparison with those of yield and protein values. The most vulnerable phenological periods of winter wheat were the stages of heading and flowering related to precipitation, and vernalization and ripening concerning temperature
4. Conclusions
Precipitation and temperature patterns were studied in a long-term field experiment to determine water availability and plant nutrition impacts on yield quantity and quality. The aim of the study was to evaluate favorable and non- favorable crop year conditions for winter wheat Triticum aestivum L. Three winter wheat varieties and six nitrogen topdressing application levels were applied in two consecutive crop years representing different precipitation and temperature patterns to evaluate yield, yield components, and quality manifestation. The results of the experiment suggest that precipitation patterns related to the wheat development phenophases had profound influence on the yield and the protein formation of the crop. From among phenophases, flowering and grain filling periods proved to be the most influential stages. The two crop years resulted in different amounts of protein yield. The favorable one significantly increased the total amount of protein in comparison with that of the non-favorable vintage. There were detectable differences in the protein yield of the wheat varieties studied; however, the efficiency of the respective varieties also differed in the two crop years. Strong correlation was detected between the total amount of protein and the experimental treatments in both years. Yield figures of the wheat varieties were in close correlation with plant nutrition in general. Correlations of crop yield components were lower in both crop years in comparison with those of yield and protein values.
Acknowledgements: This paper presents research results gained from a long-term trial supported by VKSZ and NVKP funds of the Government of Hungary.
References
Grimwade B, Tatham AS, Freedman RB, Shewry PR, and Napier JA. 1996: Comparison of the expression patterns of wheat gluten proteins and proteins involved in the secretory pathway in developing caryopses of wheat. Plant Mol. Biol. 30, 1067–1073.
https://doi.org/10.1007/BF00020817
Győri, Z., 2006: A trágyázás hatása az őszi búza minőségére. Agrofórum 17(9), 14–16.
Győri, Z. 2008: Complex evaluation of the quality of winter wheat varieties. Cereal Res.Commun. 36, 1907–1910. https://doi.org/10.1556/CRC.36.2008.Suppl.1
Horváth Cs., 2014: Storage proteins in wheat (Triticum aestivum L.) and the ecological impacts affecting their quality and quantity, with a focus on nitrogen supply. Columella 1(2), 57–75.
https://doi.org/10.18380/SZIE.COLUM.2014.1.2.57
KDVVIZIG, 2016: Monthly precipitation and temperature. Hydrometeorological databank.
http://www.kdvvizig.hu/index.php/vizrajz/havi-hidromet-tajekoztato/
Kismányoky, T. and Ragasits, I., 2003: Effects of organic and inorganic fertilization on wheat quality.
Acta Agronomica Hungarica, 51, 47–52. https://doi.org/10.1556/AAGR.51.2003.1.6
Lakatos M., Bihari Z., Szentimrey T., Spinoni J., and Szalai, S., 2016: Analyses of temperature extremes in the Carpathian region in the period 1961–2010. Időjárás 120, 41–51.
Lásztity, R., 1999: Cereal Chemistry. Akadémiai Kiadó: Budapest.
MSZ 6383:1998, 824/2000/EK Wheat quality standards.
Pepó, P., 2010: Adaptive capacity of wheat (Triticum aestivum L.) and maize (Zea mays L.) crop models to ecological conditions. Növénytermelés 59, Suppl. 325–328.
https://doi.org/10.1556/Novenyterm.59.2010.Suppl.3
Pollhamer, E. 1981: A búza és a liszt minősége. Mezőgazdasági Kiadó, Budapest.(in Hungarian) Ványiné, Sz. A., Nagy, J., 2012: Effect of nutrition and water supply on the yield and grain protein
content of maize hybrids. Australian J. Crop Sci. 6. 381–388.
https://doi.org/10.21475/ajcs.2016.10.06
Vida, Gy., Bedő, Z., and Jolánkai, M., 1996: Agronómiai kezeléskombinációk őszi búzafajták sütőipari minőségére gyakorolt hatásának elemzése főkomponens-analízissel. Növénytermelés 45. 453–
462. (in Hungarian)