DOI:10.28974/idojaras.2019.2.7
IDŐJÁRÁS
Quarterly Journal of the Hungarian Meteorological Service Vol. 123, No. 2, April – June, 2019, pp. 241–264
Fog climatology in Hungary
Anikó Cséplő1*, Noémi Sarkadi1, Ákos Horváth2, Gabriella Schmeller1, and Tünde Lemler2
1University of Pécs, Faculty of Sciences Institute of Geography and Earth Sciences
Ifjúság útja 6, 7624 Pécs, Hungary
2Hungarian Meteorological Service Storm Warning Observatory Vitorlás utca 17, 8600 Siófok, Hungary
*Corresponding author E-mail: acseplo@gamma.ttk.pte.hu
(Manuscript received in final form June 25, 2018)
Abstract⎯ The fog not only makes the traffic more difficult, but it is frequently accompanied by increased air pollution. A research program has been started recently to improve our knowledge about fog both in macro and micro scales. In the first part of the research project, analysis of the data collected in the last 60 years has been performed.
This database contains information about the visibility and the duration of the reduced visibility at 8 different cities in different regions of Hungary. The climatology of fog in Hungary has been studied in only few research programs, and no comprehensive analysis of the data has been performed. The first results of the data analysis show that the frequency and duration of the mist significantly reduced between the 1980s and 2000s, and the most dramatic reduction occurred in the northeast region of the country.
Furthermore, the frequency of fog also dropped in this time period. The most dramatic reduction of the fog and mist events was found in northeastern Hungary, which was one of the most polluted regions in the country until the 90s of the last century. The coincidence of the significant reduction of duration of fog and that of the sulfate emission in NE Hungary supports the hypothesis that there is a strong correlation between the air pollution and the formation of the mist and fog.
Key-words: fog, mist, fog climatology, statistical analysis
1. Introduction
Low visibility due to fog increases the hazard of the traffic on road, landing of airplanes or shipping in the coastal area. The fog is frequently accompanied by enhanced air pollution, which can significantly increase the health risk.
The reduced horizontal visibility can be caused by rainfall, fog, smog, haze, mist, and even sand storm. The fog is defined as an atmospheric phenomenon which reduces the visibility below 1 km due to suspended water droplets nearby surface of the Earth (National Oceanic and Atmospheric Administration, 1995) (WMO, 2011). The reduced visibility in case of mist is between 1 km and 5 km.
(WMO, 2011). The fog is a greatly localized phenomenon, because the conditions necessary for its formation − increased moisture content and/or cooling of air mass − are typically influenced by geographical characteristic of location where fog forms (Peace, 1969).
In Hungary, only few papers have been published about the characteristics of the fog. These studies have examined mainly the physics of fog, the characteristics of fog at different meteorological conditions, and have analyzed data about reduced visibility at some airports. The results of these researches were published in the middle decades of the 20th century. These studies focused on local regions in Hungary; comprehensive, climatological analysis of the available data has not been accomplished.
In the fog-prone regions of the world, some scientists investigated the microphysics of fog to improve the forecast and understanding of fog formation.
The spatial and temporal frequency of fog have been studied, furthermore, methods about the identification and classification of fog have been presented.
One of the earlier researches examined the annual frequency of days with heavy fog in the United States. Peace (1969) assessed that heavy fog (visibility is one-fourth mile or less − about 0.4 km) occurred over 20 days per year at 50
% of the main weather stations, and the frequency of heavy fog was found to be higher than in previous 30 years. The regions with largest frequency of heavy fog are located in the West Coast, Appalachian Mountains, and Atlantic and Gulf Coasts. The annual mean data were displayed by histograms and isopleth analysis (steep gradient was 10 days increment up to 100 days). Hardwick (1973) used an objective analysis by applying special computer program called SYMAP to create maps about the monthly and annual distribution of heavy fog days over the continental part of the United States. The author found similar result in case of the annual distribution of heavy fog than Peace did, but the isopleth analysis was proved to be a more precise tool than the computer analysis. The analysis accomplished by the latter method overestimated the relative frequency of the fog within New England and Washington State. The monthly data were plotted by maps for each month showed similar spatial distribution of fog than it was published by Peace (1969).
Meyer and Lala (1990) used term of fog events instead of foggy days to avoid multiple counting of the same fog event and to consider the changing characteristics of the fog (e.g., the formation and evolution of fog lasts not only one day). According to their result, the peak of the number of radiation fog events is in September and October at Albany, New York. During the studied period (1970−1979), radiation fog events were 71% of all fog events in this area.
The most reliable method to examine fog climatology is the combination of surface meteorological observation data and digital satellite images (Bendix, 1994). Using satellite data with high spatial resolution (1 km2) helps to avoid overestimation of fog frequency which can derive from the extrapolation of surface data. Data from NOAA-AVHRR were used in this study to determine areas covered by fog according to the image of temperature differences between channel 3 and 4 for day and night. The result of this study affirmed that the extension of fog is highly influenced by the weather condition and the airflow.
Shanyengana et al. (2002) published interesting results about fog climatology in Namibia. The frequency of fog was investigated in the Namib Desert to promote the utilization of fog water deposition. In this location, the coincidence of the peak of fog deposition and the high groundwater salinity is favorable to dilute saline groundwater for drinking purposes from August to February.
The temporal variation of fog was studied in mountainous areas as well.
Błas et al. (2002) published analysis of data observed in Mt. Szrenica, Poland.
The results based on hourly observed data of 51 stations showed that the average number of annual foggy days was about 274. The longest foggy period lasted for 371 h, and very dense fog (visibility is equal or less than 100 m) occurred predominantly. Furthermore, the spatial variation of fog was examined in the Sudety (Poland). The result proved that the local geographical features (such as landform type, exposure of the windward side, etc.) could play more important role in the spatial variability of fog than the altitude.
About 50 years data from 12 airports were collected and analyzed with two-tailed t-test to determine the long term climatological changes of dense fog in the USA by Witiw and Baars (2003). The results showed that the occurrence of dense fog decreased at 7 regions (Seattle−Tacoma, San Francisco, Los Angeles, Long Beach, La Guardia [New York], Baltimore−Washington International, and Washington Reagan), furthermore, an increase was reported in Boston, a slight increase was found at Denver, and not significant difference was found in the case of Minneapolis−St. Paul, Atlanta, and Dallas−Fort Worth during the studied period. In this study it was also reported, that the frequency of fog decreases in the cities in some country, e.g., in Canada, Brazil, Argentina, United Kingdom.
Further statistical methods have been applied to study the fog climatology.
The effect of urban heat island, particulate pollution, and sea surface temperature were examined; how they could influence the occurrence of dense fog in Los Angeles (LaDochy, 2005). The results showed that the increase of the temperature
in the urban area and the improvement of air quality played important role in the reduction of the number of foggy days. However, it was also found that the Pacific Decadal Oscillation and El-Niño-Southern Oscillation impacted the interannual fog variability by the changing of coastal sea surface temperature.
The knowledge and dataset which have been retrieved from the study of fog climatology can be used to improve the forecast; e.g., new technology exists to plot frequencies of different meteorological conditions on SD-graphs (seasonal-diurnal) (Gultepe et al., 2007). Martin (1972) utilized this method to examine the ceiling frequencies at different flight categories. The improvement of computer capacity, statistical analyses methods, and graphic user interface allowed the SD-graphs to be improved (Gultepe et al., 2007). This technique was used by Fisk (2004) to display the fog formation frequency in London, Point Mugu, and St. John’s, Newfoundland. It was also applied by Tardif and Rasmussen (2007) to provide detailed data about onset and dissipation of different fog types. In the latter study it was conceded, that the hourly observation data might be useful to identify fog events, and atmospheric conditions have been analyzed by a decision algorithm to deduce the formation of different fog types. The authors suggested determining the fog events on the base of regular observation data.
Scherrer and Appenzeller (2014) presented a long-term FLS-climatology (FLS: fog-low stratus) of the Swiss Plateau. The study based on daily relative sunshine duration measurements to create different categories for duration of FLS cases. These indicators (full FLS and at least half FLS days) were analyzed for three time periods (entire series, the foggiest and the least foggy decades).
The results suggested that there were decadal and interannual variability of fog.
However, significant long-term trend was not reported. Strong correlation was found between the numbers of cool air pools days and FLS data.
Evaluation of fog climatology of Japan based on statistical analysis of data about foggy days and fog events was presented by Akimoto and Kusaka (2015).
They studied the relation between the visibility of fog and the surrounding geographical environment (topography and land use). The classification of fog events was based on the extent of horizontal visibility (fog, quasi-dense fog, and dense fog events). Long-term data series (from 1966 to 2005) were used to demonstrate long-term changes in the number of foggy days in Japan. The results indicated that most of the foggy days and the densely foggy regions could be observed on the inland mountainous areas, basins, and on the Pacific coast of Japan; furthermore, it was also found that the most common fog type was radiation fog. They also asserted that the number of foggy days decreased at most of observation sites in Japan during the studied period. Different trends for the number of foggy days were found in different regions of Japan. While in inland sites decreasing trend was reported, at some area located on coastal region the decreasing trend was not obvious. Furthermore, increasing trends were recorded at some locations (e.g., Miyako). No physical explanation was found for the diversity of the trends in the different geographical regions.
Satellites data has been affirmed to be useful for fog observation, because of their large temporal and spatial resolution. Therefore, surface observation can be completed with satellite observation about low clouds (Avotniece et al., 2015). The fog is similar to low stratus cloud in many respects, the main difference between these phenomena is the altitude of ceiling (ceiling of fog is at the surface). Hence, the surface observation of fog can be compared to satellite data about low cloud. Atmospheric circulation patterns were also studied to find favorable atmospheric conditions for fog formation in Latvia. The results indicated that the high-pressure over the whole country was the most favorable criterion of fog formation. The trend about the number of foggy days has been descending in Latvia since the middle of the previous century.
Fog was found to depend on definite thresholds and regimes of meteorological variables (Goswami and Sarkar, 2015). To improve fog forecasting and modeling, they looked for relations between the meteorological variables (hourly temperature, dew point depression, wind, and relative humidity) and the formation of the fog. They asserted that the contrast between the meteorological variables characterizing the foggy and non-foggy days sometimes could be more significant at the 850 hPa level, than near-surface. They also suggested that the observation data from the surface should have been completed by satellite data to accomplish a comprehensive analysis of fog dynamic.
Cermak and Bendix (2008) also asserted that the data of surface observations at meteorological stations could not provide coherent overview about the distribution of fog/low stratus. Satellite data has been conceded to be useful to complement the incomplete data sets. In the earlier seventies the detection of fog by satellite was studied by Hunt (1973), who found that the small droplets (that fog contains) had smaller emissivity at the wavelength of 3.9 µm than at 10.8 µm. This dependence of the emissivity on the wavelength was negligible in case of larger droplets and cloud-free areas. As mentioned above, fog detection by satellites is usually based on the difference between the brightness temperatures observed at channels 3 and 4 of AVHRR (Advanced Very High Resolution Radiometer). The optical properties of fog droplets can be used to make distinction between the fog and the surface during both day and night. Using satellite data, Bendix (2002) investigated the frequency of fog occurrence in Germany and in adjacent areas.
While the frequency of fog occurrence was found to be the largest at the Lake Constance area, it was much smaller over elevated terrains (e.g., Alps) and at the top of lower mountains (e.g., Vosges, Harz Mountain). New detection technology was worked out by Bendix et al. (2006) to improve the distinction between the fog and several cloud types. This method was called radiative transfer-based classification scheme. It was implemented into the Moderate Resolution Imaging Spectroradiometer (MODIS) gauge that was installed on board of Terra and Aqua platform as well. This method was not efficient enough to distinguish the fog from several other cloud types, if their optical properties were similar to those of fog.
Cermak and Bendix (2008) developed a new fog/low stratus detection algorithm to
improve daytime detection of fog and low stratus from geostationary platforms.
This scheme involves the sequence of spectral and spatial fog/low stratus property complementary tests.
Using satellite data, Cermak et al. (2009) published the fog and low stratus (FLS) climatology of Europe. The results showed that the frequency of FLS occurrence reduces from North toward South. This study based on satellite- derived maps of fog and low stratus. The applied method involves both the spectral and the spatial tests. These tests allow us to assess the characteristics of fog and its environment (Satellite-based Operational Fog Observation Scheme − SOFOS, Cermak, 2006). Ground-based observation data set and satellite data set were synchronized in this study. The satellite maps have larger spatial resolution, and as a consequence of this, several small-scale patterns can be detected only on the satellite-derived maps. Compared to surface observation data, the satellite data have higher temporal resolution as well. However, the satellites are not able to detect fog or low stratus if another opaque cloud layer is located above them, and similarly to the surface observation, satellites are not able to detect the fog patches with very small spatial extension (sub-pixel size).
Wang et al. (2010) investigated the frequency of heavy fog in Beijing area using the indicator of fog frequency distribution intensity. This indicated the area weighted averages of foggy days based on data which were observed by some polar orbit meteorological satellites. The results showed that the southeastern, eastern, and central parts of Beijing were foggier than the western area.
Egli et al. (2017) evolved fog and low stratus climatology of Europe using geostationary satellite data. The FLS detection scheme (Cermak and Bendix, 2008) was improved by the moving-window technique, which allows us to avoid inaccuracies derived from changing of geographic location of pixels (illumination variation) and differences of surface types (shifts in spectral band differences). In addition, the discrimination between small and large droplets of clouds at daytime was improved by observations of the reflection of solar radiance at 3.9 µm. The results showed that the maximum values of FLS in units [h day-1] occurred in winter months accompanied by the latitudinal gradient.
Interannual trend of FLS-occurrence was also investigated by involving air temperature and wind speed. They found that frequency of fog showed decreasing trend mainly over Central Europe in winter months.
As it was mentioned previously, the fog has been studied in only few research programs in Hungary. Antal and Péczely (1956) investigated the cloud features in the case of different macrosynoptic situations over Hungary. The results of statistical analysis proved that from late autumn to early spring, the atmospheric conditions characterize the anticyclone promoted the formation of fog. Mainly the radiation and advection types of fog are frequent at this condition. Lépp and Rajkay (1957) dealt with horizontal visibility and cloud height data to improve the safety of aviation at several airports in Hungary. The data of two winter seasons indicated that data of visibility during the night was slightly smaller than during the day. To
increase the reliability of fog forecasting, Antal (1958) studied the climatology of fog at 11 meteorological stations (mainly at airports). Data observed during 11 years in winter seasons were analyzed. The author asserted, that the frequency of the fog was the highest in December, furthermore, the comparison of fog frequency at different locations showed that the frequency of fog was the smallest in Győr, and it was the largest in Budapest and Miskolc. Fog cases with different macrosynoptic situations and different duration were studied. It was found that in October and March, the most favorable macrosynoptic condition of the occurrence of fog is the cyclonic warm or occluded front. In the other months, the high pressure center of anticyclones or the presence of divergences zone can contribute to the formation of fog, which can last all day. The frequency of the short term fog was found to be significantly higher than that of the long term fog. The predominance of the short term fog stems from the fact that the radiation fog − which is the most typical form of fog in Hungary − generally disappears shortly after the sunrise. Kéri (1965) studied the characteristics of fog in urban regions by comparing the data which were observed in Budapest and Kalocsa. The analysis of observed data (from 1901 to 1960) revealed that at the start of the period, the number of foggy days was 48 in Budapest, and it increased by about 10 % by the end of the investigated period. The contrast between the urban and rural areas was established by the fact, that in the Budapest region, the number of foggy days was 8 days larger than in the country sides. Probáld (1965) also investigated the urban effect on the visibility related to the air pollution. The author analyzed the annual trend of the visibility and the relation between the fog and wind direction. The conclusion of the research was that the horizontal visibility in Budapest depends on the wind direction, because the transport of the air pollution was sensitive to that.
Wantuch (2001) proposed a nowcasting method for forecast fog formation and visibility. The author evolved the fog stability index (FOGSI) and fog decision tree method, which involved observed data and derived physical parameters. The atmospheric conditions have been classified into normal and cold air pool categories. The classification was based on the observed humidity, wind speed, and radiative cooling. Tuba and Bottyán (2018) suggested a more reliable method to forecast the horizontal visibility focusing on airports in Hungary. The authors developed a new hybrid forecast model based on combining fuzzy logic-based analogue and output of numerical forecasts.
In the current study, we focus on the statistical analysis of long-term data series of reduced visibility in Hungary. We investigate: (i) the duration and frequency of fog and mist over the last six decades; (ii) the occurrence and characteristics of fog in different regions in Hungary; (iii) the relation between the air pollution and the frequency of fog.
The data and methods applied in this study are described in Section 2. The results will be published in Section 3, and finally, the last section involves the conclusions and outlook.
2. Data and methods
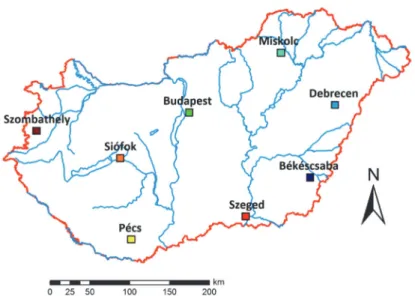
Data about reduced visibility for the period of 1956−2017 have been collected from 8 meteorological synoptic weather stations (see Fig. 1). These stations were chosen, because data series for this long period are available at these locations. The observation frequency was 3 hours between 1956 and 2017. This study is mostly based on the evaluation of fog events instead of foggy days to give a more accurate description of fog frequency. The raw data of reduced visibility have been distributed into 5 categories according to the spatial extent of horizontal visibility (mist; and four visibility categories for fog: 1000−700 m, 700−500 m, 500−300 m, <300 m). To reduce the uncertainty caused by the inaccuracy of observed visibility, these categories were regrouped into 3 categories: mist, fog (1000 m–300 m), and dense fog (less than 300 m).
Because the reported time period of mist and that of fog generally included the duration of fog and dense fog, the raw data needed some preprocessing to avoid overestimation of the duration of mist and fog periods. Foggy and mist events duration of which were reported longer than 240 hours were rejected.
Fig. 1. The current locations of meteorological stations where data about mist and fog were observed.
Locations of the meteorological observation stations where data have been observed are plotted in Fig. 1. The relocation of few stations (see Table 1) may cause some inhomogeneity in the database. Besides the operating dates of the stations, the elevation and the type of the landform of station locations are summarized in Table 1. Most of the stations (except Siófok and Budapest) were moved during the past decades from one location to another; however, significant
change occurred only in the case of the station in Miskolc. During the first decades of the studied period (until 1990), the observations were taken at the airport nearby to Miskolc on 118 m ASL. In 1990, the meteorological station was moved into the city area with elevation of 231 m ASL. The station was moved further in 1997.
Although it stayed in the city area, the elevation of the new position was 231.8 m ASL. The last relocation of the station occurred in 2013, and it is currently operated in Diósgyőr at elevation of 161 m. The station of Békéscsaba was also replaced many times in the past decades. The observation was taken in the suburb area of the city except between 1947−1964 and 2002−2010. Stations of Szombathely, Pécs, Szeged, and Debrecen are located in the surrounding area of the cities, furthermore, the station in Siófok is located on the shore of Lake Balaton. The station in Budapest is at the edge of a suburb area of the city.
Table 1. The location of the stations over the period from 1950s to present days Designation of the
meteorological observation stations
Location (and elevation) of the
stations from the 1950s to 1990 Location(and elevation) of the stations from 1990 to nowadays
Budapest 06.15. 1953.: Budapest-Pestszentlőrinc (138.1 m) (plain)
Budapest-Pestszentlőrinc (same before 1990.)
Békéscsaba 09.01.1947. –02.29.1964.: Kazinczy str.
(87 m) and
06.01.1951. – 07.31.1957.: Airport (84 m) 06.01.1961. –06.27.1985.: Fényes (87 m) 06.28.1985. –06.30.1994.: Nagyrét (Ionosphere Research Observatory) (84,5 m)
07.01.1994. –12.05.2002.: Airport 2.
(86.1 m)
10.09.2002. –11.05.2010.: Waterworks (85.2 m)
10.29.2010.: Békés Airport (86.8 m) (all of the locations: plain) Debrecen 01.01.1950. –04.19.1960.: Airport (110 m)
04.20. 1960. –07.31.1995.: Airport (104 m)
08.01.1995. – Airport (Mikepércsi str.) (106.6 m) (all of the locations: plain) Miskolc
(the station is inside in the city)
08.01.1950. –06.01.1990.: Airport (118 m) (plain)
06.02.1990. –06.24.1997.: Avas (231 m) (hilltop area)
06.24.1997. –06.27.2013.: Avas (231.8 m) (hilltop area)
06.27.2013. – Diósgyőr: Fire-fighter barrack (161 m) (valley area) Pécs 02.19.1946. –03.31.1957.: Uránváros –
Airport (124 m) (plain)
06.02.1956. –03.03.1969.: Pogány Airport (Harkányi str.) (201 m)
03.04.1969. –03.24.1998.: Pogány Airport (near the airport building) (206 m)
03.24.1998. –03.31.2004.: Pogány Airport (Harkányi str.) (201.8 m) 03.31.2004. – Pogány Airport (199.2 m) (all of the locations: hilly area)
Siófok 1956. – on the shore of Lake Balaton (108 m) (plain)
on the shore of Lake Balaton (same before 1990.)
Szeged 01.01.1951. –07.31.1965.: Airport (82 m) 08.01.1965. –05.05.2004.: Airport (Radiosounding Observatory) (81 m)
05.05.2004.: Airport (80.8 m) (all of the locations: plain) Szombathely 01.01.1950. –12.31.1964.: Airport (224 m)
01.01.1965. –04.24.2002.: Airport (220 m)
02.27.2002. – Komárom str. (200.1 m) (all of the locations: hilly area) Format of the date: mm.dd.yyyy.
3. Results
The duration and frequency of reduced visibility categories have been analyzed to investigate their time series during the last six decades in Hungary.
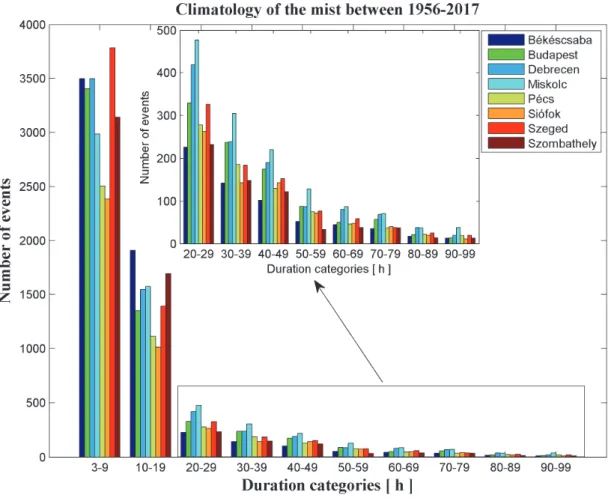
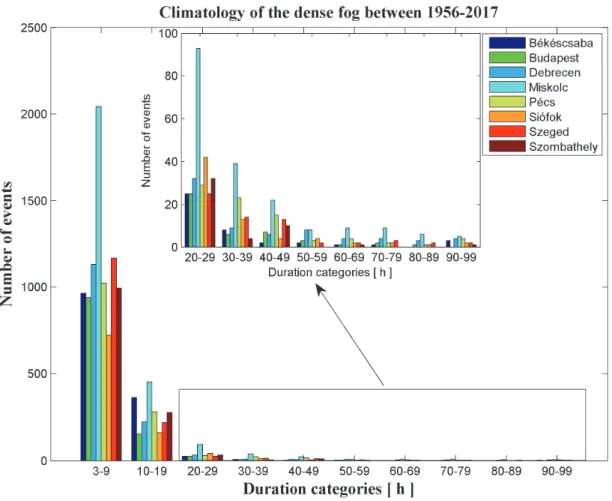
The frequencies of durations for three types of reduced visibility were plotted by histograms. The frequency categories were determined by intervals of 10 hours (except the first interval, where boundaries are 3 and 9 hours). The results show the frequency of events with different lifetimes in the different visibility categories at different cities, which characterize the different regions in Hungary. The columns with different colors represent the data related to different cities (see Fig. 1). The categories on the x axis are the intervals for duration.
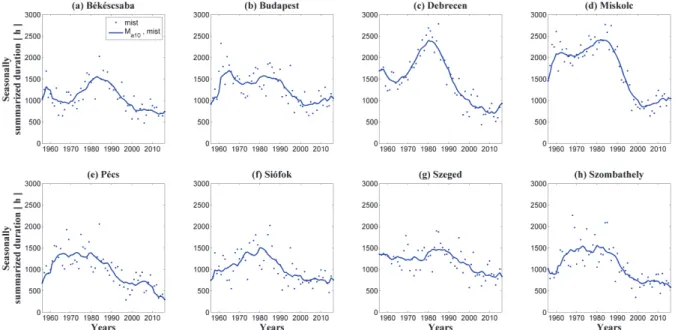
The year-to-year variation of the seasonally summarized (from October to March – winter half-year) durations of different types of reduced visibility events are also plotted and analyzed. The strong fluctuations of the data were smoothed by using moving average. Data have been depicted on some graphs, the spots represent the seasonally summarized durations of each types of events, the solid lines reveal the 10 years moving average. The application of moving average method allows us to calculate the mean values of consecutive 10 years from data base and to emphasize the long-term trends by smoothing of the year- to-year fluctuations.
3.1. Analysis of data
3.1.1. Mist (horizontal visibility is between 5000 m − 1000 m)
The distribution of durations of mist events can be seen in Fig. 2. The number of events decreases nearly exponentially as the duration increases. Most of the events are included in the shortest duration category (3 − 9 hour). While in the shortest duration category the largest number of the events was observed at Szeged, from the third category (duration is longer than 20 hours) the largest number of the events was reported at Miskolc. Note, also, that in the first two duration categories, the smallest numbers of events were observed in Pécs and Siófok. While the largest numbers of events in the second category are related to Békéscsaba and Szombathely, from the third category the largest numbers of events were observed in the northeast part of the Hungary (Miskolc and Debrecen). This may stem from the fact that while the formation of mist (or fog) with shorter lifetime can be related or partly related to local conditions, the formation of mist with longer lifetime is mostly the consequence of macroscale processes.
Fig. 2. The distribution of the duration of mist events at different cities. The different colors represent the data related to different cities (see Fig. 1). The categories on the x axis are the intervals for the duration of mist.
The seasonally summarized durations of mist events at the different cities, furthermore, the moving averages have been depicted in Fig. 3. At most of the stations, the seasonally summarized duration reached its maximum values between 1980 and 1990. However, due to the strong year-to-year oscillation, the duration of the mist changed between 1000 and 2000 hours at most of the stations before the 90s. The maximum values at the northeastern part of Hungary (Debrecen Fig. 3(c) and Miskolc Fig. 3(d)) were about 50% larger than in the other regions. If the values after 2000 are compared, no significant difference can be noticed between the regions, the seasonally summarized durations have been between 500 and 1000 hours. Trends of the moving average show decreasing tendency after the 80s at each station. The seasonally summarized durations of the mist significantly decreased everywhere in the country between the 80s and the early years of 2000. The steepness of the decrease changes between factor of two (Szeged Fig. 3(g)) and factor of five
(Debrecen Fig. 3.(c)). After 2000, the trend lines show that the seasonally summarized durations of the mist remain near constant. Before the 80s, the trends show rather distinct characteristics at the different cities. While in Szeged (Fig. 3(g)) the seasonally summarized durations of the mist were nearly constant, in one group of the cities (Budapest Fig. 3(b), Miskolc Fig. 3(d), and Pécs Fig. 3(e)), a steep increase occurred before the 60s, and in the other group of the cities (Békéscsaba Fig. 3.(a), Debrecen Fig. 3(c), and Siófok Fig. 3.(f)), a gradual increase of the duration can be observed.
Fig. 3. Variation of the seasonally summarized durations of mist events (blue dots mean seasonally summarized duration of mist events) and the 10 years moving averages (blue solid lines) for all stations between 1956 and 2017.
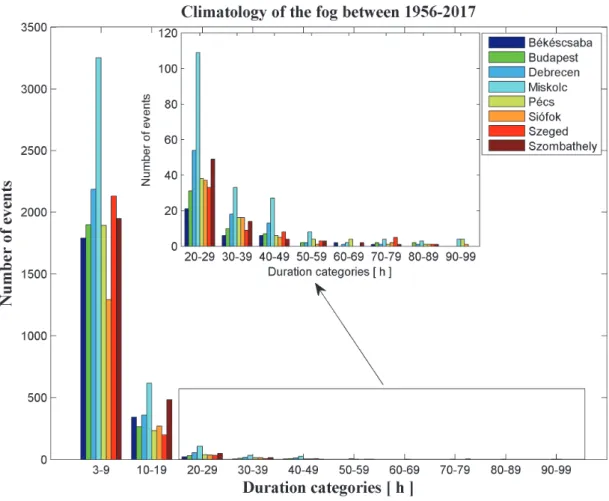
3.1.2. Fog (horizontal visibility is between 1000 m – 300 m) and dense fog (horizontal visibility is less than 300 m)
The distribution of durations of fog and dense fog events are shown in Figs. 4 and 5, respectively. Similarly to mist, the number of events exponentially decreases as the duration increases. The largest number of events for both fog and dense fog cases were reported at Miskolc in each duration category. In these cases, contrary to the mist events, the number of events has been significantly larger (two or three times) at Miskolc in each duration category than at any other cities. This significant difference between Miskolc and the group of other cities can be explained by the unique environmental conditions characterizing the
meteorological station in Miskolc. Although the station was outside of the city until the 90s, the high level of industrial pollution must have promoted the fog (smoke) formation. Note that at Miskolc and Debrecen, in the last four duration categories, more dense fog events were reported than fog events (compare Fig. 4 to Fig. 5). It means that if the lifetime of the fog is large enough, the chance of the formation of dense fog is relatively large in this region of the country.
Comparison of the histograms of fog (Fig. 4) and that of mist (Fig. 2) shows that while in the first duration category (3−9 hours), the number of fog events is similar to that of mist events at each station, in the cases of longer duration categories, the differences are more significant. This suggests that the mist-fog transition is more frequent if the lifetime of these events is relatively short.
Fig. 4. The distribution of the duration of fog events at different cities. The different colors represent the data related to different cities (see Fig. 1). The categories on the x axis are the intervals for the duration of fog.
Fig. 5. The distribution of the duration of dense fog events at different cities. The different colors represent the data related to different cities (see Fig. 1). The categories on the x axis are the intervals for the duration of dense fog.
The variations of the seasonally summarized durations of fog events at different cities are plotted in Fig. 6. The trends of the duration of fog events are more diverse than in the case of the mist. While at some of the stations (Békéscsaba Fig. 6(a), Budapest Fig. 6(b), Pécs Fig. 6(e), and Siófok Fig. 6(f)), the duration of fog remained near constant after the 80s, at another group of the stations (Debrecen Fig. 6(c), Miskolc Fig. 6(d) and Szeged Fig.6(g)) significant reduction of the duration occurred. Unlike other regions in the country, a slight increase of duration occurred by the early 2000s at Szombathely (Fig. 6(h)).
Note, that while the length of the mist periods was near the same at Miskolc (Fig. 3(d)) and Debrecen (Fig. 3(c)) in the 80s, the duration of fog was significantly smaller in Debrecen (Fig. 6(c)) than in Miskolc (Fig. 6(d)).
Fig. 6. Variation of the seasonally summarized durations of fog events (red dots represent seasonally summarized duration of fog events) and the 10 years moving averages (red solid lines) for all stations between 1956 and 2017.
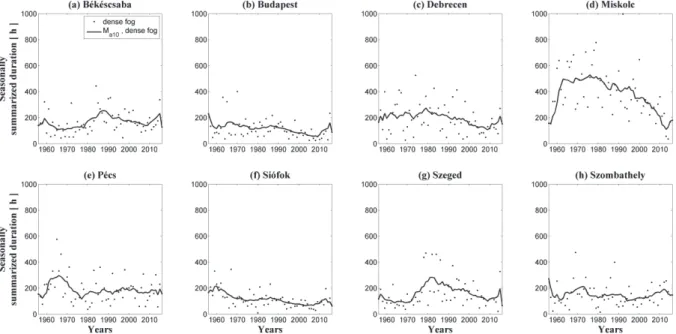
Before the 90s of the last century, the seasonal duration of the dense fog was less than 400 hours except for few years and expect for Miskolc (Fig. 7).
Similarly to the mist and fog in this time period, the longest seasonally summarized durations were reported at Miskolc (Fig. 7(d)). This is the only city, where the duration of dense fog has significantly decreased after the 80s. Due to the industrial emission, the air pollution in Miskolc was very high in the middle decades of the 20th century. From end of the 1980s, the pollution caused by this type of emission was significantly reduced (Kukely and Zábrádi, 2003), that might have contributed to the improvement of the air quality and to the reduction of the frequency of the fog and mist.
Fig. 7. Variation of the seasonally summarized durations of dense fog events (black dots visualize the seasonally summarized duration of dense fog events) and the 10 years moving averages (black solid lines) for all stations between 1956 and 2017.
3.2. Analysis of the relation between wind and reduced visibility based on climatological data
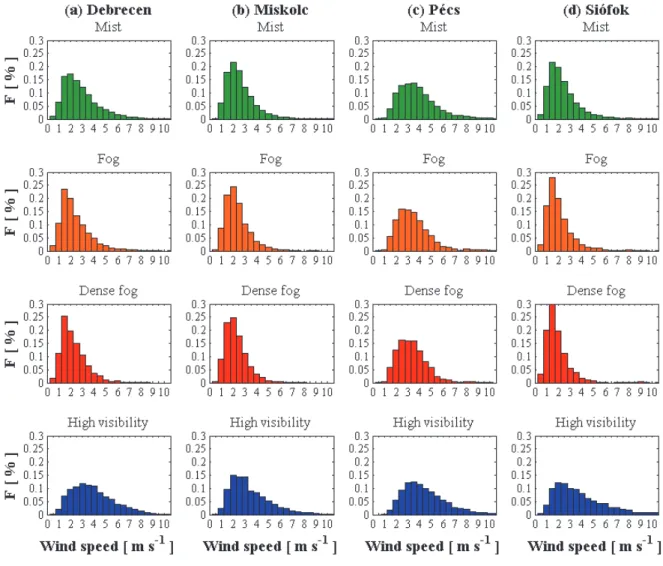
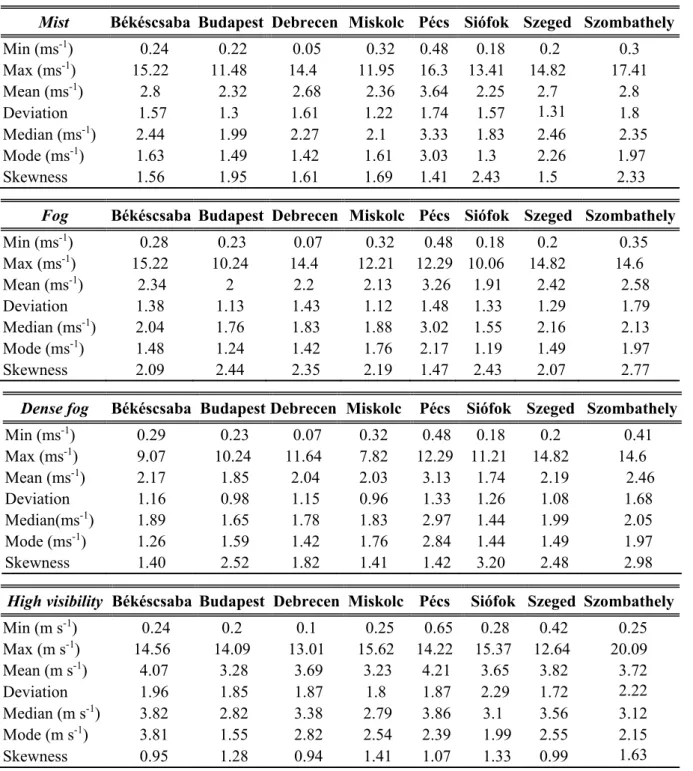
Wind has a strong impact on the evolution of the fog. The turbulence enhanced by the wind can mitigate the fog formation or destroy the fog by reducing the vapor content near to the surface (Cotton and Anthes, 1989). However, sometimes the turbulence can promote the fog formation by lowering the stratus clouds (Cotton and Anthes, 1989). Because currently only the daily climatological data are available for the wind, the detailed discussion about the relation between the fog and wind speed is not possible. The statistical characteristics of the wind speed related to different types of reduced visibility categories and to high visibility (visibility is larger than 5 km) are summarized in Table 2. The average daily values of wind speed measured at 10 m above the surface were retrieved from the CARPATCLIM database (Szalai et al., 2013) covering the period from 1961 to 2010. In the line with the previously mentioned assumption, the mean, median, and mode of the distributions are significantly smaller in the case of the reduced visibility than in the case of the high visibility (Table 2). The smaller values of the standard deviation in the case of the reduced visibility (Table 2) mean lower frequency of the wind speeds above the value of 5 m s-1 (Fig. 8). The distributions of the wind speed in
different cases for Debrecen (a), Miskolc (b), Pécs (c), and Siófok (d) are plotted in Fig. 8. The shapes of the distributions suggest that the wind speed shows gamma distribution (Fig. 8). The smaller value of the skewness parameter in the case of the high visibility also means the higher frequency of the larger wind speed (Table 2).
Fig. 8. Distribution of the wind speed at 10 m elevation level in case of different horizontal visibility at different stations ((a): Debrecen, (b): Miskolc, (c): Pécs, and (d):
Siófok)). Values of „F” denote frequency of wind speed for each wind speed interval.
Analysis of the wind speed data related to mist, fog, dense fog events and high visibility suggested an assumption about the difference of the wind speed related to different cases. The assumption declared that the wind speeds were different during the days related to reduced visibility events and to high visibility. Wind speed data of Budapest (form 1961 to 2010) were investigated
by chi-squared probe to demonstrate or reject this assumption. The distribution of daily wind speed was analyzed between high visibility and mist events;
between mist and fog events, and between fog and dense fog events. The results of the test showed that the null-hypothesis (there is no difference between the distributions of the wind speed between foggy days and related to high visibility) can be rejected even at significance level of 0.01.
Table 2. Statistical characteristics of the wind speed for all of the stations. The table contains values about all types of reduced visibility and high visibility (visibility is larger than 5000 m). (Data from: CARPATCLIM database, Szalai et al., 2013)
Mist Békéscsaba Budapest Debrecen Miskolc Pécs Siófok Szeged Szombathely Min (ms-1) 0.24 0.22 0.05 0.32 0.48 0.18 0.2 0.3
Max (ms-1) 15.22 11.48 14.4 11.95 16.3 13.41 14.82 17.41 Mean (ms-1) 2.8 2.32 2.68 2.36 3.64 2.25 2.7 2.8
Deviation 1.57 1.3 1.61 1.22 1.74 1.57 1.31 1.8 Median (ms-1) 2.44 1.99 2.27 2.1 3.33 1.83 2.46 2.35 Mode (ms-1) 1.63 1.49 1.42 1.61 3.03 1.3 2.26 1.97 Skewness 1.56 1.95 1.61 1.69 1.41 2.43 1.5 2.33
Fog Békéscsaba Budapest Debrecen Miskolc Pécs Siófok Szeged Szombathely Min (ms-1) 0.28 0.23 0.07 0.32 0.48 0.18 0.2 0.35 Max (ms-1) 15.22 10.24 14.4 12.21 12.29 10.06 14.82 14.6 Mean (ms-1) 2.34 2 2.2 2.13 3.26 1.91 2.42 2.58 Deviation 1.38 1.13 1.43 1.12 1.48 1.33 1.29 1.79 Median (ms-1) 2.04 1.76 1.83 1.88 3.02 1.55 2.16 2.13 Mode (ms-1) 1.48 1.24 1.42 1.76 2.17 1.19 1.49 1.97 Skewness 2.09 2.44 2.35 2.19 1.47 2.43 2.07 2.77
Dense fog Békéscsaba Budapest Debrecen Miskolc Pécs Siófok Szeged Szombathely Min (ms-1) 0.29 0.23 0.07 0.32 0.48 0.18 0.2 0.41 Max (ms-1) 9.07 10.24 11.64 7.82 12.29 11.21 14.82 14.6 Mean (ms-1) 2.17 1.85 2.04 2.03 3.13 1.74 2.19 2.46 Deviation 1.16 0.98 1.15 0.96 1.33 1.26 1.08 1.68 Median(ms-1) 1.89 1.65 1.78 1.83 2.97 1.44 1.99 2.05 Mode (ms-1) 1.26 1.59 1.42 1.76 2.84 1.44 1.49 1.97 Skewness 1.40 2.52 1.82 1.41 1.42 3.20 2.48 2.98
High visibility Békéscsaba Budapest Debrecen Miskolc Pécs Siófok Szeged Szombathely Min (m s-1) 0.24 0.2 0.1 0.25 0.65 0.28 0.42 0.25 Max (m s-1) 14.56 14.09 13.01 15.62 14.22 15.37 12.64 20.09 Mean (m s-1) 4.07 3.28 3.69 3.23 4.21 3.65 3.82 3.72 Deviation 1.96 1.85 1.87 1.8 1.87 2.29 1.72 2.22 Median (m s-1) 3.82 2.82 3.38 2.79 3.86 3.1 3.56 3.12 Mode (m s-1) 3.81 1.55 2.82 2.54 2.39 1.99 2.55 2.15 Skewness 0.95 1.28 0.94 1.41 1.07 1.33 0.99 1.63
3.3. Frequency of the occurrence of the reduced visibility events
Fig. 9 shows the daily distribution of the different types of reduced visibility for the period from October 1956 to March 2017. The relative frequency of the mist, fog, and dense fog reports are plotted in Fig. 9.(a), (b), and (c), respectively. In each case the relative frequency has its maximum at 6 am. This means that most of the reports about reduced visibility were issued at 6 UTC. A secondary maximum in the case of mist can be found at 18 UTC (Fig. 9(a)).
This stems from the fact, the radiative cooling is the strongest near to the sunrise, and in the winter season the temperature can decrease significantly after the sunset. The strong reduction of the temperature increases the relative humidity near to 100% (see Geresdi, 2004). The relation between the radiation and the relative humidity explains why the numbers of reports have their minimum values at noon and early afternoon. Compared to the mist (Fig. 9(a)), the number of the fog reports (Fig. 9(b)) and especially that of the dense fog reports (Fig. 9(c)) are relatively high in the second half of the night (between midnight and 6 UTC). The consecutive secondary maximums of the mist and that of fog and dense fog suggest that the midnight fog has frequently evolved from the mist formed late afternoon or evening due to the radiative cooling. The high frequency of the fog in the morning (before 6 or 9 UTC) and the increase of the fog frequency next to the secondary maximum of the mist frequency at 18 UTC suggest that radiation fog is the most common type of fog in Hungary.
(Unfortunately, no direct information is available to make distinction between the different types of fogs formed in Hungary.)
The reports were also categorized on the base of the month they were issued (Fig. 10). This type of plots shows less sensitivity to the location of stations. The monthly distribution of the reduced visibility is almost the same in each region of the country. However, the monthly distribution of the mist (Fig. 10(a)) is rather different to that of the fog (Fig. 10(b)) and dense fog (Fig. 10(c)). While the monthly distribution of the mist is rather uniform in the investigated season (from October to March), the monthly distribution of the fog and that of the dense fog have a significant maximum in December/January.
That is the ratio of the maximum and minimum frequencies is about 1.5 in the case of the mist, and this ratio is 4−5 in the case of fog and dense fog. Near half of the fog events occur in December and January, and just 5% of the events can be observed in March.
Fig. 9. Frequency of reports issued for mist, fog, and dense fog for three hours intervals for the period from October in 1956 to March in 2017. E.g., 0 means that the report was issued between midnight and 3 UTC, etc. The different colors represent the data related to different cities (see Fig. 1).
Fig. 10. Monthly frequency of occurrence of events related to different reduced visibility categories at different cities. The different colors represent the data related to different cities (see Fig. 1).
4. Conclusions
The fog climatology in Hungary has been compiled. The sources of the data were surface observations at eight meteorological stations in different regions of the country. The number of events, the seasonally summarized durations and frequency of reduced horizontal visibility events were evaluated. The results show that (i) the most reduced horizontal visibility events were reported from Miskolc and the least were observed at Siófok; (ii) the seasonally summarized duration of mist events decreased significantly in the last two decades of the previous century in Hungary with the largest steepness in the northeastern part of the country (see in Fig. 3 at Debrecen (c) and Miskolc (d)); (iii) the number of events (mist, fog, and dense fog) exponentially decreases as the duration increases (see Figs. 2, 4, and 5); (iv) most of the reports about fog have been issued at 6 UTC (see Fig. 9.(b)), this fact indirectly supports the idea that the most fog and mist events occurred due to the radiative cooling in Hungary; (v) while the monthly distribution of the mist (see Fig. 10(a)) follows uniform distribution, the monthly distribution of fog (see Fig. 10(b)) and that of dense fog (Fig. 10(c)) follow normal distribution with maximum in December and January.
Analyses of the climatological data about the wind support the well-known fact, that low wind speed is necessary for the fog formation, because the absence of the vertical mixing between the polluted air mass near the surface and the cleaner air above promote the fog formation. However, in some cases, the strong turbulence caused by the larger wind speed can result in fog formation by lowering the stratus clouds (Cotton and Anthes, 1989). Analysis of the wind data suggests that this type of fog is rare in Hungary.
Some authors investigated the impact of the decreasing concentration of the sulfate emission in the last decades in the previous century in Hungary (e.g., Havasi et al., 2001 and Geresdi et al., 2006). It was found that the reduced emission of SO2 significantly resulted in a decrease of the number concentration of water drops in stratocumulus clouds. Both the theoretical consideration and coincidence of reduction of industrial air pollution and decrease of the frequency of mist and fog events suggest that the the decrease of the SO2 amount in the atmosphere mitigate the mist and fog formation. This hypothesis is supported by our finding that the most dramatic decrease of the reports about the mist and fog events occurred in the northeastern region of Hungary (at Miskolc and at Debrecen), where the air pollution was rather significant.
Acknowledgements: The present study was supported by Economic development and innovation operational program (project number: GINOP 2.3.2-15-2016-00055). The authors are indebted to the Hungarian Meteorological Service for data utilized this study.
References
Akimoto, Y. and Kusaka, H., 2015: A climatological study of fog in Japan based on event data. Atmos.
Res. 151, 200−211. https://doi.org/10.1016/j.atmosres.2014.04.003
Antal, E., 1958: A köd gyakorisága és tartama a különböző makroszinoptikus helyzetekben. Időjárás 62, 39-45. (In Hungarian)
Antal, E. and Péczely, Gy., 1956: Adalékok Magyarország makroszinoptikus helyzeteinek felhőzeti viszonyaihoz. Időjárás 60, 277–286. (In Hungarian)
Avotniece, Z., Klavins, M., and Lizuma, L., 2015: Fog climatology in Latvia. Theor. Appl. Climatol.
122, 97–109. https://doi.org/10.1007/s00704-014-1270-4
Bendix, J., 1994: Fog climatology of the Po Valley. Riv Meteorol Aeronaut. V. LIV, 25−36.
Bendix, J., 2002: A satellite-based climatology of fog and low-level stratus in Germany and adjacent areas. Atmos. Res. 64, 3−18. https://doi.org/10.1016/S0169-8095(02)00075-3
Bendix, J., Thies, B., Nauß, T., and Cermak, J., 2006: A feasibility study of daytime fog and low stratus detection with TERRA/AQUA-MODIS over land. Meteorol. Appl. 13, 111−125.
https://doi.org/10.1017/S1350482706002180
Błas, M., Sobik, M., Quiel, F., and Netzel, P., 2002: Temporal and spatial variations of fog in the Western Sudety Mts., Poland. Atmos. Res. 64, 19−28. https://doi.org/10.1016/S0169-8095(02)00076-5 Cermak, J., 2006: SOFOS - A new Satellite-based Operational Fog Observation Scheme. Dissertation
zur Erlangung des Doktorgrades der Naturwissenschaften dem Fachbereich Geographie der Philipps-Universität Marburg. (In German)
Cermak, J. and Bendix, J., 2008: A novel approach to fog/low stratus detection using Meteosat 8 data.
Atmos. Res. 87, 279−292. https://doi.org/10.1016/j.atmosres.2007.11.009
Cermak, J., Eastman, R.M., Bendix, J., and Warren, S.G., 2009: European climatology of fog and low stratus based on geostationary satellite observations. Q. J. Royal Meteorol. Soc. 135, 2125−2130. https://doi.org/10.1002/qj.503
Cotton, W.R. and Anthes, R.A., 1989: Storm and Cloud Dynamic. Academic Press, San Diego.
Egli, S., Thies, B., Drönner, J., Cermak, J., and Bendix, J., 2017: A 10 year fog and low stratus climatology for Europe based on Meteosat Second Generation data. Q. J. Royal Meteorol. Soc.
143, 530−541. https://doi.org/10.1002/qj.2941
Fisk, C.J., 2004: Two-Way (Hour-Month) Time-Section Plots as a Tool For Climatological Visualization and Summarization, 14th Conf. Appl. Climatology, Am. Meteor. Soc. 11−15 January 2004, Seattle, Washington.
Geresdi, I., 2004: Felhőfizika. Dialóg Campus Press, Budapest-Pécs. (In Hungarian)
Geresdi, I., Mészáros, E., and Molnár, A., 2006: The effect of chemical composition and size distribution of aerosol particles on droplet formation and albedo of stratocumuls clouds. Atmos.
Environ. 40, 1845−1855. https://doi.org/10.1016/j.atmosenv.2005.11.012
Goswami, P. and Sarkar, S., 2015: Analysis and quantification of contrasts in observed meteorological fields for foggy and non-foggy days. Meteorol. Atmos.Phys. 127, 605−623.
https://doi.org/10.1007/s00703-015-0384-2
Gultepe, I., Tardif, R., Michaelides, S.C., Cermak, J., Bott, A., Bendix, J., Müller, M.D., Pagowski, M., Hansen, B., Ellrod, G., Jacobs, W., Toth, G., and Cober, S.G., 2007: Fog Research: A Review of Past Achievements and Future Perspectives. Pure Appl. Geophys. 164, 1121−1159.
https://doi.org/10.1007/s00024-007-0211-x
Hardwick, W.C., 1973: Monthly Fog Frequency in the continental United States. Mon. Weather Rev.
101, 763−766. https://doi.org/10.1175/1520-0493(1973)101<0763:MFFITC>2.3.CO;2
Havasi, Á., Bozó, L., and Zlatev, Z., 2001: Model simulation on the transboundary contribution to the atmospheric sulfur concentration and deposition in Hungary. Időjárás 105, 135−144.
Hunt, G.E., 1973: Radiative properties of terrestrial clouds at visible and infra-red thermal window wavelengths. Q. J. Roy. Meteorol. Soc. 99, 346−369. https://doi.org/10.1002/qj.49709942013 Kéri, M., 1965: A nagyvárosi jelleg tükröződése Budapest ködviszonyaiban. Időjárás 69, 265–270. (In
Hungarian)
Kukely, Gy. and Zábrádi, Zs., 2003: Az ipar szerepe vidéki nagyvárosaink rendszerváltozás utáni fejlődésében. Magyar Tudományos Művek Tára (In Hungarian).
LaDochy, S., 2005: The disappearance of dense fog in Los Angeles: Another urban impact? Phys.
Geogr. 26(3), 177−191. https://doi.org/10.2747/0272-3646.26.3.177
Lépp, I. and Rajkay, Ö., 1957: Repülőtereink éjszakai alkalmasságának kérdései. Időjárás 61, 278–284. (In Hungarian)
Martin, D.E., 1972: Climatic Presentations for Short-Range Forecasting Based on Event Occurrence and Reoccurrence Profiles, J. Appl. Meteor. 11, 1212−1223.
https://doi.org/10.1175/1520-0450(1972)011<1212:CPFSRF>2.0.CO;2
Meyer, M.B. and Lala, G.G., 1990: Climatological Aspects of Radiation Fog Occurrence at Albany, New York. J. Climate 3, 577−586.
https://doi.org/10.1175/1520-0442(1990)003<0577:CAORFO>2.0.CO;2
National Oceanic and Atmospheric Administration, 1995: Surface weather observations and reports.
Federal Meteorological Handbook No. 1.
Peace, R.L. Jr., 1969: Heavy-Fog Regions In The Conterminous United States. Mon. Weather Rev. 97, 116−123. https://doi.org/10.1175/1520-0493(1969)097<0116:HRITCU>2.3.CO;2
Probáld, F., 1965: Városi hatások a látástávolságra Budapest. Időjárás 69, 370–374. (In Hungarian) Scherrer, S.C. and Appenzeller, C., 2014: Fog and low stratus over the Swiss Plateau−a climatological
study. Int. J. Climatol. 34, 678−686. https://doi.org/10.1002/joc.3714
Shanyengana, E.S., Henschel, J.R., Seely, M.K., and Sanderson, R.D., 2002: Exploring fog as a supplementary water source in Namibia. Atmos. Res. 64, 251−259.
https://doi.org/10.1016/S0169-8095(02)00096-0
Szalai, S., Auer, I., Hiebl, J., Milkovich, J., Radim, T., Stepanek, P., Zahradnicek, P., Bihari, Z., Lakatos, M., Szentimrey, T., Limanowka, D., Kilar, P., Cheval, S., Deak, Gy., Mihic, D., Antolovic, I., Mihajlovic, V., Nejedlik, P., Stastny, P., Mikulova, K., Nabyvantes, I., Skyryk, O., Krakovskaya, S., Vogt, J., Antofie, T., and Spinoni, J., 2013: Climate of the Greater Carpathian Region. Final Technical Report. http://www.carpatclim-eu.org/pages/home/ . CARPATCLIM Database © European Commission – JRC.
Tardif, R. and Rasmussen, R.M., 2007: Event-Based Climatology and Typology of Fog in the New York City Region. J. Appl. Meteorol. Climatol. 46, 1141−1168.
https://doi.org/10.1175/JAM2516.1
Tuba, Z. and Bottyán, Zs., 2018: Fuzzy logic-based analogue forecasting and hybrid modelling of horizontal visibility. Meteorolol. Atmosph. Phys.130, 265−277.
https://doi.org/10.1007/s00703-017-0513-1
Wang, J.L., Li, S.M., Liu, X.L., and Wu, X.J., 2010: An analysis of the fog distribution in Beijing for the 2001–2005 period using NOAA and FY data. Atmos. Res. 96, 575−589.
https://doi.org/10.1016/j.atmosres.2010.01.007
Wantuch, F., 2001: Visibility and fog forecasting based on decision tree method. Időjárás 105, 29−38.
Witiw, M.R. and Baars, J.A., Terabeam Corporation, 2003: Long Term Climatological Changes In Fog Intensity And Coverage. Proc. 14th Symp. Global Change and Climate Variations, Am.
Meteor. Soc., Long Beach, CA.
WMO, 2011: Manual on codes, international codes. Technical Report, World Meteorological Organization, Geneva Switzerland.