DOI:10.28974/idojaras.2019.4.4
IDŐJÁRÁS
Quarterly Journal of the Hungarian Meteorological Service Vol. 123, No. 4, October – December, 2019, pp. 469–486
Modeling the impact of climate change on yield, water requirements, and water use efficiency of maize and soybean grown under moderate continental climate in the
Pannonian lowland
Milena Jancic Tovjanin 1*, Vladimir Djurdjevic2, Borivoj Pejic 1, Nebojsa Novkovic 1, Beba Mutavdzic 1, Monika Markovic 3, and Ksenija Mackic 1
1 University of Novi Sad, Faculty of Agriculture Department of Field and Vegetable Crops Dositej Obradovic Sq 8, 21000 Novi Sad, Serbia
2 University of Belgrade, Faculty of Physics Institute of Meteorology
Dobracina 16, 11000 Beograd, Serbia
3 University of Osijek, Faculty of Agriculture Kralja Petra Svacica 1d, 31000, Osijek, Croatia
* Corresponding Author e-mail: milena.jancic@polj.uns.ac.rs (Manuscript received in final form September 4, 2018)
Abstract⎯ In Central and Eastern Europe, climate changes have been predicted (Trnka et al., 2009). These changes are expected to have a great impact on field crops during the spring-summer growing season. The aim of this paper is to estimate the impact of climate change on the main field crops (maize and soybean) in the Republic of Serbia. The AquaCrop model was used as a tool to quantify climate change impact on yield and net irrigation using results from the ECHAM climate model (SRES A2 scenario for the 2041–2070 and 2071–2100 periods) and data from two experimental fields located in the southern part of the Pannonian lowland. The analyzed results for the 2041–2070 and 2071–2100 periods showed an increase in maize (1 and 1.3 t/ha) and soybean (1.9 and 2.8 t/ha) yields and a very significant increase in the net irrigation of 151.4 and 183.1 mm in maize production and 179.3 and 227.3 mm in soybean production under climate change conditions compared to the 1961–1990 period. Additionally, irrigation water use efficiency was calculated to estimate the importance of irrigation, because crop production is usually conducted under rainfed conditions. It was concluded that maize and soybean production should benefit from climate changes but with higher water quantities.
Key-words: AquaCrop model, climate change impact, crop water requirement; maize, soybean, yield
1. Introduction
Climate patterns with soil conditions play a fundamental role in shaping environmental ecosystems for agriculture production. Some short-term climate variations are natural, but long-term trends observed in recent decades indicate a changing climate on global (Downing et al., 2000; Harrison et al., 1995;
Houghton et al., 1996; Rosenzweig and Iglesias, 1994; Sathaye et al., 1997;
Wolf and Van Diepen, 1995) and regional (Alexandrov et al., 2002; Lalic et al.
2012) levels. Many projects (ADAGIO, COST 704) and research networks (AgMIP, MACSUR) are designed to assess and predict climate change impact on agriculture production (Bindi et al. 2015). Results published from the European Environmental Agency (EEA) regarding climate change, vulnerability, impacts, and adaptation in Europe (EEA, 2004, 2005, 2007a, 2007b) have shown a negative impact on agriculture in the southern and eastern European countries. The aim of climate change research was to integrate decision makers’ feedback to assess potential production risks and limitations at the local and regional levels for fundamental field crops. Under future climate conditions, higher temperatures, water shortages, and irrigation need are expected (Trnka et al., 2009).
In the research community, many crop models have been used (DSSAT, WOFOST, MARS, STICS SORKAM) to simulate the yield and phenology of main field and vegetable crops. Analyzed yield results in many previous studies expect to have lower yields under climate change conditions. Additionally, in recent studies in our region, a lower yield is expected for the main field crops (maize, wheat, and soybean) under rainfed conditions with climate change using the DSSAT crop model (Jancic, 2016a, 2016b). The FAO AquaCrop model was chosen for future simulations, because it was developed to simulate crop yield response to environmental stress (Farahani et al., 2009). It is a crop water productivity model that evaluates the yield response to water and salinity stress, and may be successfully used in locations where water may be a key limiting factor in crop production.
The model was calibrated and validated (Abedinpour et al., 2012; Ahmadi et al., 2015; Paredes et al., 2014; Stricevic et al., 2011) in many studies for yield and various irrigation conditions. The model was also successfully calibrated and validated under our environmental conditions for past climate and soil conditions and various different field management (Stricevic et al., 2011), and a previous research verified the use of the AquaCrop model in further studies to simulate yield and net irrigation under future climate conditions for main field crops.
Serbia is an emerging country where agriculture plays an important role in the national economy. Field crops are vulnerable to climate changes, especially spring-summer crops, which have huge water requirements during the summer months (Pejić et al., 2011a, 2011b). In this study, Rimski Sancevi in Vojvodina,
the southern part of the Pannonian lowland with great agricultural potential, climatic and soil conditions, was chosen for high production. This study is important for assessing the risk of climate change impact on maize and soybean yield and irrigation water use efficiency (IWUE) to maintain economically high production under optimum irrigation and for estimating potential limitations under future conditions. Both crops have a growing season from April to September (AS period), during which less precipitation, higher temperature, and more days with extreme high temperatures were predicted (Jancic, 2017; Jancic et al., 2015; Mihailović et al., 2014).
In Serbia, maize and soybean are mostly cultivated under non-irrigated conditions on 1.77 million ha with a production of 872.1 million t and on 171000 ha with a production of 540859 t, respectively (Statistical Office of the Republic of Serbia [RSSS], 2012). The largest production area is in the Vojvodina region (RSSS, 2012).
The aim of this paper is to quantify the impact of climate change on the water requirements, yield and irrigation water use efficiency of maize and soybean under favorable agricultural conditions using an AquaCrop model, and to analyze the possibilities and limitations to the production of these two crops under future conditions.
2. Materials and methods 2.1. Location and experimental data
Experimental fields were in Rimski Sancevi, located in the southern part of the Pannonian lowland (latitude 45° 20’ N, longitude 19° 51’ E, altitude 84 m). The experimental field location was characterized by a moderate continental climate (Mihailović et al., 2014) with an annual maximum temperature of 16.3 °C, minimum temperature of 5.9 °C, relative humidity of 74.8%, and precipitation of 576.8 mm (Rimski Sancevi station records for 1961–1990). The fields are the property of the Institute for Field and Vegetable Crops. Maize and soybean experimental fields were cultivated for six years, from 1998 to 2003 for mid- season maize and from 1989 to 2004 for soybean first maturity groups.
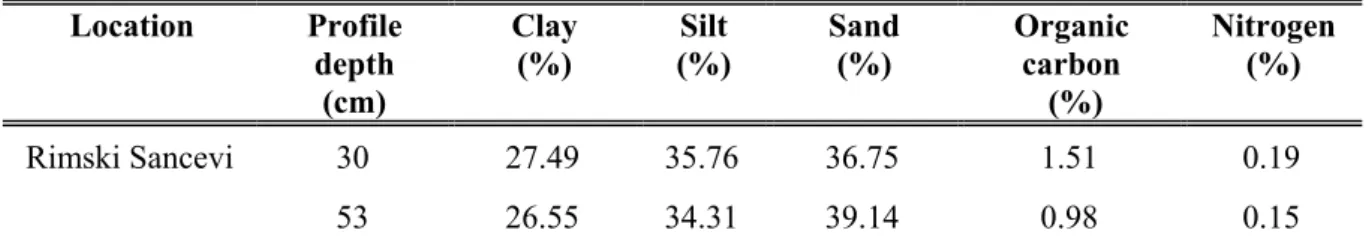
Soil type was classified according to the International Use of Soil Science Working Group (WRB) as a calcareous chernozem by the WRB classification (IUSS Working Group WRB, 2007). Mechanical, chemical, and hydrological characteristics of the soils were obtained from field samplings and are given in Tables 1 and 2. The soil’s texture class was silty clay. Soil analyses were performed for two layers: the upper 30 cm and the lower 53 cm, at which the maize and soybean roots are most developed. The chemical properties for crop production were characterized as very favorable. The carbon content was 1.51%
in the upper layer and 0.98% in the deeper layer, and the nitrogen content was
water in the active rhizosphere of maize was 200 mm/m, and the bulk density was 1.21 g/cm3. Soil moisture for irrigation needs was monitored by the standard gravimetric method every seven days. Samples were collected by means of a drill from two layers: 0–30 and 30–53 cm. The field capacity was defined at 33 vol%, permanent wilting point at 13 vol%, and saturation at 46 vol%.
Table 1. Mechanical and chemical characteristics of the soil at Rimski Sancevi Location Profile
depth (cm)
Clay (%)
Silt (%)
Sand (%)
Organic carbon
(%)
Nitrogen (%)
Rimski Sancevi 30 27.49 35.76 36.75 1.51 0.19
53 26.55 34.31 39.14 0.98 0.15
Table 2. Hydrological characteristics of the soil at Rimski Sancevi Bulk density
(g/cm3)
Field capacity (vol %)
Permanent wilting point (vol%)
Saturation (vol%)
Total available water (mm/m)
1.21 33 13 46 200
2.2. Past and future climate data
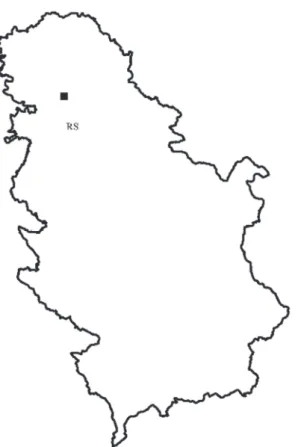
The daily weather data used for current climate conditions were observed at the weather station at Rimski Sancevi (Fig. 1), near the experimental field. The dataset included maximum and minimum temperature (°C), precipitation (mm), vapor pressure (mbar), and wind speed (m/s). The reference evapotranspiration rates were calculated by applying the FAO Penman-Monteith method (Allen et al., 1998). The time period included years from 1961 to 1990. The data for future climate conditions were assumed from the integrated coupled model ECHAM developed at the Max Planck Institute for Meteorology (Roeckner et al., 2003). The resulting data were dynamically downscaled for two periods from 2041 to 2070 and from 2071 to 2100. The A2 scenario determined by the Intergovernmental Panel on Climate Change (IPCC, 2001) was used for greenhouse gas (GHG) emissions for the two integration periods mentioned above. All simulations were performed considering the CO2 effect. The average CO2 concentration for the 1961–1990 period was 333.4 ppm, for the 2041–2070 period it was 560 mm, and for the 2071–2100 period it was 734.5 ppm. The absolute change in air temperature and relative change in precipitation for future conditions for the April – September growing season and June – July – August (JJA period) summer period were analyzed as the most limited agroclimatic parameters in field crop production (Olesen et al., 2011).
Fig. 1. The location of the study area at Rimski Sancevi (latitude 45°20’N and longitude 19°51’E).
2.3. Field crop and management data
Maize phenology, yield, irrigation data, and crop management were observed for six years, from 1998 to 2003 from a field experiment in Rimski Sancevi.
In maize production, sowing was performed from April 16 to 22, depending on the weather conditions for each season. The mid-season maize NSSC 640 usually requires approximately 10 days after sowing to emerge, with a maximum canopy of approximately 40 days. Flowering was observed from the end of the first week of July to mid-July and maturity from the 14th to the 29th of September (Table 3). The plant density was maintained at 5.7 to 6.3 plants/m2, with 0.9 m row spacing. Crop management was as practices with no specific changes.
In soybean production, sowing was performed in approximately April 20, with soybean maturity group I. The plant density was 4.0 to 4.3 plants/m2, with a row spacing of 0.9 m. The phenology was also observed, and the soybean I maturity group usually required 10 to 15 days after sowing to emerge, with a maximum canopy cover of approximately 78 days. Flowering was observed at the end of June and beginning of July and maturity from the 1st to the 8th of September. The observed phenology for each year is presented in Table 3.
Table 3. Plant density, sowing/emergence/flowering/harvesting dates, precipitation, and irrigation
Year Plant density (plants/ha)
Sowing Emergence Flowering Harvesting Precipitation (mm)
Irrigation (mm) Maize
1998 57000 Apr 21 May 1 Jul 16 Sep 14 412.3 60
1999 57000 Apr 22 May2 Jul 14 Sep 17 477.9 0
2000 60000 Apr 18 Apr 28 Jul 11 Sep 18 123.0 180
2001 63000 Apr 16 Apr 30 Jul 10 Sep 19 605.8 60
2002 60000 Apr 16 Apr 29 Jul 7 Sep 23 212.3 120
2003 63000 Apr 22 May 1 Jul 7 Sep 29 220.3 240
Soybean
1989 42000 Apr 21 May 3 Jul 1 Sep 5 305.8 120
1990 40000 Apr 22 May 7 Jun 30 Sep 3 140.0 180
1991 43000 Apr 22 May 7 Jul 2 Sep 8 414.8 0
1992 42000 Apr 19 May 2 Jun 28 Sep 1 171.3 180
1993 42000 Apr 21 May 4 Jul 4 Sep 2 181.3 240
1994 42000 Apr 22 May 7 Jul 5 Sep 6 258.1 180
2.4. AquaCrop model parameters, calibration and validation, and input data For simulations, the AquaCrop model requires input data based on the observed climate, soil, and crop management data. Steduto et al., (2009) provide a detailed description and present the architecture of the model.
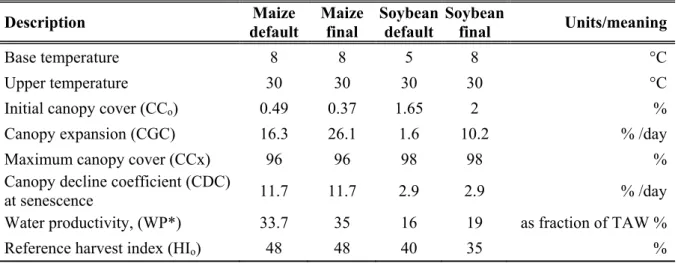
AquaCrop version 5.0 offers files that contain parameters suitable for the simulation of maize and soybean production, but the default values for maize and soybean were chosen only as a starting point, and the final key parameters were modified to fit the local crop management. All crop parameters were calibrated for the NSSC 640 maize hybrid, thus the crop model can simulate and present the real crop production under our local conditions. Table 4 presents the final parameters used in the AquaCrop model calibration for maize and soybean production. The initial canopy cover was 0.37%, with a maximum canopy cover of 96% (Table 4).
The base temperature, under our conditions, was set to 8 °C, and the upper temperature was set to 30 °C. Water productivity was 35 g/m2, and the harvest index was 48% (Table 4). The crop management was as usual under our conditions, and soil fertility was considered as sufficient amounts added to set ideal conditions for yield genetic potential and for estimated climate change conditions.
Applied net irrigation and precipitation observed for each year during the growing season for maize and soybean are presented in Table 3.
Table 4. Default and final parameters for AquaCrop model calibration for maize and soybean production
Description Maize
default
Maize final
Soybean default
Soybean
final Units/meaning
Base temperature 8 8 5 8 °C
Upper temperature 30 30 30 30 °C
Initial canopy cover (CCo) 0.49 0.37 1.65 2 %
Canopy expansion (CGC) 16.3 26.1 1.6 10.2 % /day
Maximum canopy cover (CCx) 96 96 98 98 %
Canopy decline coefficient (CDC)
at senescence 11.7 11.7 2.9 2.9 % /day
Water productivity, (WP*) 33.7 35 16 19 as fraction of TAW %
Reference harvest index (HIo) 48 48 40 35 %
The AquaCrop model was calibrated for maize production using daily weather data from the Rimski Sancevi weather station, soil characteristics, and crop management data for the 1999 experimental field (Table 5, Fig. 2).
The relative deviation between the observed and simulated dry matter yields was 1%, and the absolute change in net irrigation was 0 mm. The validation was performed for a six-year period from 1998 to 2003 at the same location (Table 5, Fig. 2). The relative deviation (Tornqvist et al., 1985) between the simulated and observed dry matter yields was calculated for each year to show how the model fits in various climate conditions under the same or similar crop management activity. The relative deviation between the simulated and observed yields varied from 1 to 10%, except in one year, 2000. The absolute change in net irrigation varied from 0 to 15 mm, except in 2000 and 2001. The highest deviation in yield, 13%, and the absolute change in net irrigation, 117.6 mm, occurred in 2000; the latter was 60 mm in 2001, when the number of dry days was greater than the long-term average, with significant low precipitation in the growing season. This significant difference between the simulated and observed yield values is a consequence of the model’s inability to simulate the plant reaction to stress under extreme conditions, such as high variations in daily air temperature and precipitation in short time intervals (Lalic et al., 2011). The coefficient of determination (R2) calculated for yield was 0.7823, and the coefficient of correlation (R) was 0.8845, which improves high agreement between the simulated and observed yields.
Table 5. Calibration (for 1999) and validation of maize grain yield (dm t/ha) for the 1998–2003 period
Year Observed yield (dm t/ha)
Simulated yield (dm t/ha)
Relative deviation
in yield (%)
Observed IWUE (kg/m3)
Simulated IWUE (kg/m3)
1998 8.8 9.7 10 14.7 14.1
1999 9.8 9.9 1 0.0 0.0
2000 11.6 10.1 –13 6.4 3.4
2001 9.3 9.7 5 15.5 0.0
2002 11.7 10.6 –9 9.8 7.9
2003 11.6 10.7 –8 4.8 4.6
Fig. 2. Validation of net irrigation (mm) in the maize production.
The AquaCrop model was also calibrated for soybean I maturity group production for 1994 (Table 6, Fig. 3). The default and final crop parameters are presented in Table 4. All parameters were calibrated to fit the soybean yield production and phenology under local conditions. The base temperature was set to 8 °C, and the maximum temperature was 30 °C. The initial canopy cover was 2%.
Water productivity was 19 g/m2, and the harvest index was 35% (Table 4).
Table 6. Calibration (for 1994) and validation of I group maturity soybean grain yield (dm t/ha) for the 1989–1994 period
Year Observed yield (dm t/ha)
Simulated yield (dm t/ha)
Relative deviation (%)
Observed IWUE (kg/m3)
Simulated IWUE (kg/m3)
1989 3.9 4.4 12 0.3 0.4
1990 4.5 4.6 2 0.3 0.2
1991 4.3 4.5 4 0.0 0.0
1992 4.5 4.7 5 0.3 0.2
1993 4.5 4.6 2 0.2 0.2
1994 4.6 4.7 2 0.3 0.2
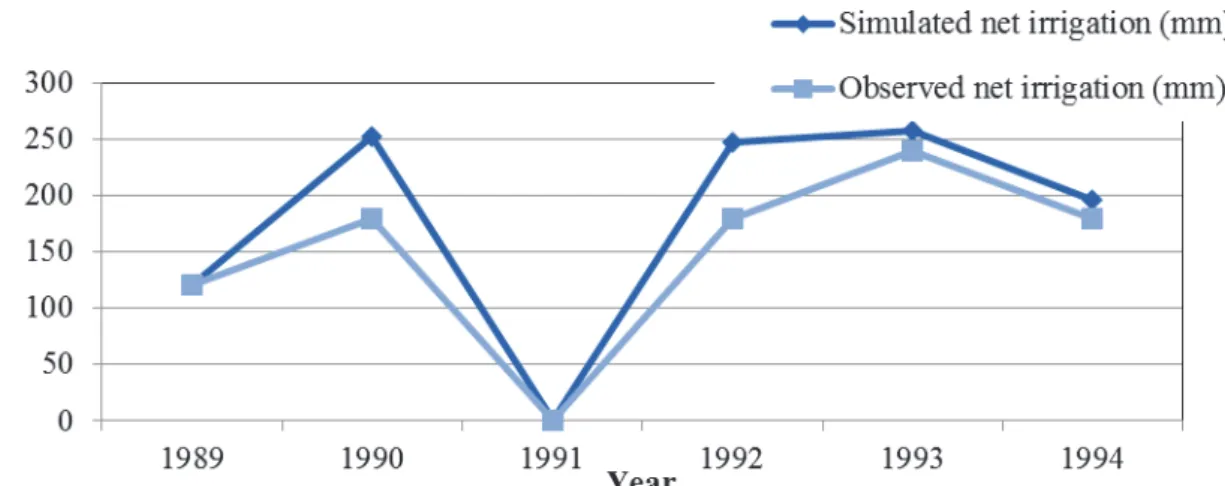
Fig. 3. Validation of net irrigation (mm) in the I group maturity soybean production.
The relative deviation between the simulated and observed dry matter yields was 2%, and the absolute change in net irrigation was 16.9 mm. The model was validated for a 6-year experiment at the same location (Table 6, Fig. 3). The relative deviation between the simulated and observed yields varied from 2 to 5%, except in 1989, when the relative deviation was 12%. The absolute change in net irrigation varied from 0 to 16.9 mm, except in 1990 and 1992, when the precipitation was significantly lower than the long-term average.
In years with significant dry weather conditions, the model gave higher net irrigation from 66.9 to 70 mm, which is two applications more than under our agroclimatic conditions. The coefficient of determination calculated for yield was 0.8529, and the coefficient of correlation was 0.9235, which implies a high agreement between the simulated and observed yields.
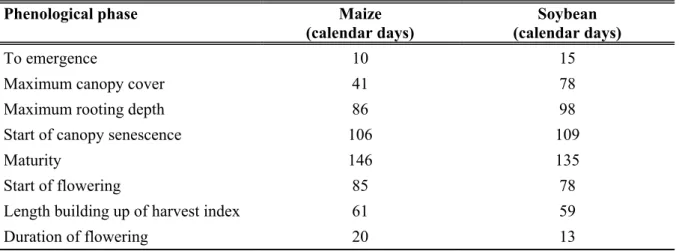
For past climate conditions, from 1961 to 1990, and future climate conditions, 2050, some crop management operations in AquaCrop model simulations had to be set and fixed to ensure that the model simulates only the climate impact on the current crop production. In the model, for maize and soybean production for the 1961–1990 period and future conditions, sowing and phenology were set at the average sowing, emergence, maximum canopy cover, flower appearance, and maturity dates (Table 7). Additionally, under irrigated conditions, the readily available water was set at 80%, below which the soil water content in the root zone may not drop, as in our experimental fields. This irrigation method in the model, including defined and set local soil hydrological characteristics, gave similar net irrigation quantities to the measured net irrigation from the field experiments.
Table 7. Calendar days of maize and soybean by growth phases for crop simulations for 1961 – 1990 period and expected climate conditions
Phenological phase Maize Soybean
(calendar days) (calendar days)
To emergence 10 15
Maximum canopy cover 41 78
Maximum rooting depth 86 98
Start of canopy senescence 106 109
Maturity 146 135
Start of flowering 85 78
Length building up of harvest index 61 59
Duration of flowering 20 13
The irrigation water use efficiency was calculated as follows:
IWUE = yield / irrigation , (1)
where IWUE is the irrigation water use efficiency (kg/m3), while yield (kg/ha) and irrigation (m3/ha) are measured/simulated from the field experiments.
3. Data analyses
Three statistical methods were used to analyze and compare observed yield data from field experiments and simulation yield results.
The first statistical parameter was the relative deviation (Tornqvist et al., 1985) calculated between the simulated and observed dry matter yields for each year. The method was chosen to show how the model works and its sensitivity to various climate conditions each year under the same or similar crop management activities:
r = (S – M) / M*100 , (2)
where r is the relative deviation (%), M is the observed yield (dm t/ha), and S is the simulated yield (dm t/ha). The crop model fits when r is less than 15% (Tsuji et al., 1998).
The second calculated statistical parameter was the coefficient of determination, R2:
( )( )
( ) ( )
−
−
−
= − 2 2
2
S Si M
Mi
S Si M R Mi
,
(3)
where S_ and M_ are the mean values of the simulated and observed data. The coefficient provides information on how much the variation in simulated yield results is defined by the impact of input data, which shows the model’s ability to simulate real crop production. The model fits when R2 tends to be 1.
The third statistical parameter was the coefficient of correlation R. It describes the relative measure of the degree of agreement between the measured and simulated values, a linear connection between these two variables.
4. Results 4.1. Current and future climate conditions
The analyses for current climate conditions (1961–1990) included observed daily weather data for air temperature and precipitation for growing seasons April- September (AS) and June-July-August (JJA) (Table 8). The average air temperature was 18.9 °C for the AS period and 20.4 °C in the summer months. The precipitation was 286.4 mm for the AS period and 199.0 mm for the driest period JJA. Absolute change in temperature and relative change in precipitation were calculated for 2041–2070 and 2071–2100, according to the current period 1961–1990.
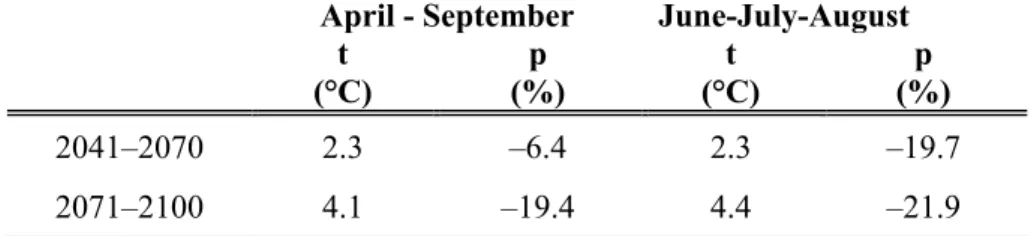
For future conditions, in the AS period, the increase in temperature was predicted to be 2.3 °C in the 2041–2070 period and 4.1 °C in the 2071–2100 period. The highest increase in temperature is expected during the summer months (JJA) for 2.3 °C in 2041–2070 and 4.4 °C in 2071–2100. At the same time, the predicted precipitation is expected to be lower in the AS period, by 6.4% in 2041–2070 and 19.4% in 2071–2100, and significantly lower in the JJA
Table 8. Climate conditions for the 1961-1990 period at Rimski Sancevi (t - temperature;
p - precipitation)
April - September June-July-August t
(°C)
p (mm)
t (°C)
p (mm)
1961–1990 18.9 286.4 20.4 199.0
Table 9. Absolute change in temperature (°C) and relative change in precipitation (%) for 2041–2070 and 2071–2100 using ECHAM model under A2 scenario (t – temperature; p – precipitation).
April - September June-July-August t
(°C)
p (%)
t (°C)
p (%)
2041–2070 2.3 –6.4 2.3 –19.7
2071–2100 4.1 –19.4 4.4 –21.9
4.2. Climate change impact on maize and soybean yield, net irrigation, and IWUE Using current climate data for the 1961–1990 period, soil characteristics, current crop management, and fixed crop parameters from the AquaCrop model calibration, as well as dry matter yield and net irrigation were simulated for the mid-season maize and soybean I maturity groups under the current climate conditions for 30 years.
Table 10a shows the simulated dry matter yield (kg/ha) for the mid-season maize and I maturity group soybean for the current period 1961–1990.
The analyzed results showed a very high yield for soybean and maize production for the current period, similar to the real production in the northern part of Serbia. The net irrigation varied from year to year, according to various weather conditions. The average net irrigation was 521 m3/ha, and IWUE was also calculated as 18 kg/m3.
For future conditions, the average yield, IWUE, and calculated absolute change in yield and net irrigation for the 2041–2071 and 2071–2100 periods under the A2 scenario were shown, according to the 1961–1990 period (Table 10b).
Table 10a. Yield (dm kg/ha), net irrigation (mm), and IWUE (kg/m3) in maize and soybean production
Average maize yield
(dm kg/ha)
IWUE in maize production
(kg/m3)
Maize net irrigation
(m3/ha)
Average soybean
yield (dm kg/ha)
IWUE in soybean production
(kg/m3)
Soybean net irrigation
(m3/ha)
1961–1990 9400 18.0 521 4300 3.6 1187
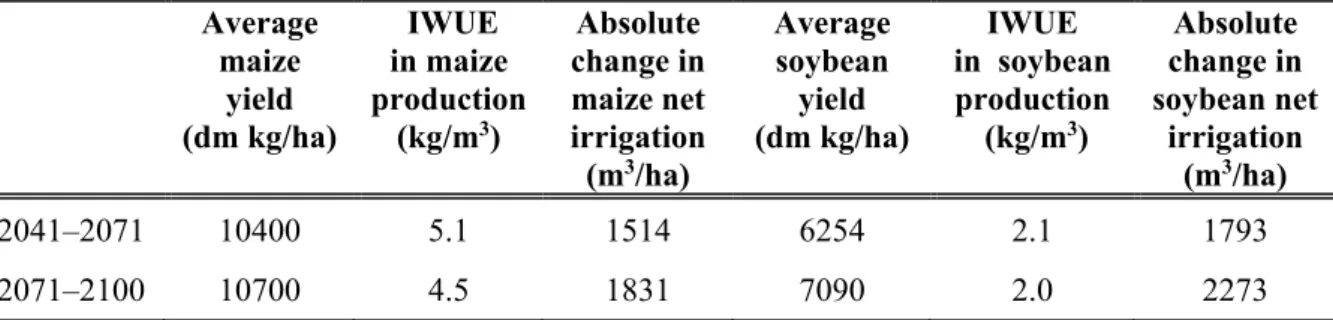
Table 10b. Average yield (dm kg/ha), absolute change in net irrigation (mm), and IWUE (kg/m3) in maize and soybean production using ECHAM model under A2 scenario Average
maize yield (dm kg/ha)
IWUE in maize production
(kg/m3)
Absolute change in maize net irrigation (m3/ha)
Average soybean
yield (dm kg/ha)
IWUE in soybean production (kg/m3)
Absolute change in soybean net
irrigation (m3/ha)
2041–2071 10400 5.1 1514 6254 2.1 1793
2071–2100 10700 4.5 1831 7090 2.0 2273
The simulated maize yield was 10400 kg/ha in the 2041–2070 period, which is higher than the 1000 kg/ha grain yield in the past climate conditions.
The minimum simulated yield in the 2041–2070 period was 9900 kg/ha, and the maximum was 10800 kg/ha. In 2071–2100, the simulated yield showed a higher value of 10700 kg/ha. The minimum simulated yield was 10400 kg/ha, and the maximum was 10900 kg/ha. The production is expected to be higher under future conditions according to the 1961–1990 period, but at the same time, the net irrigation showed significantly higher norms of 1514 m3/ha in 2041–2070 and 1831 m3/ha in 2071–2100. The IWUE calculated was 5.1 kg/m3 for the 2041–2070 period and 4.5 kg/m3 for the 2071–2100 period.
The simulations for soybean production showed a significantly higher yield of 6254 kg/ha in the 2041–2070 period, which is 1900 kg/ha higher than the grain yield according to the 1961-1990 period. The minimum simulated yield was 5800 kg/ha, and the maximum was 6700 kg/ha. For the 2071–2100 period, the model simulated a grain yield of 7090 kg/ha. A 2800 kg/ha higher grain yield is expected according to the past climate conditions. The minimum simulated yield was 6700 kg/ha, and the maximum was 7500 kg/ha. The AquaCrop model simulated benefits in soybean production under future climate conditions, and the net irrigation was expected to be significantly higher, 1793 m3/ha in the 2041–2070 period and 2273 m3/ha in the 2071–2100 period, than in the past climate conditions. The IWUE calculated for the 2041–2070
5. Discussion
5.1. The climate and the maize and soybean production in 1961–1990
Maize and soybean are temperate crops with widespread aerial production, especially maize. The base temperature for emergence is 8 °C for both crops (Djordjevic et al., 2015; Kotorac, 2014; Miladinović et al., 2008).
Maize root and morphology are well developed, and this crop does not have a high demand for water. The mid-season maize NSSC 640 was developed in 1989 as a hybrid at the Institute of Field and Vegetable Crops, Novi Sad. It has high genetic potential in yield, is very resistant to diseases and highly tolerant to drought. This hybrid is very adaptable under various agroecological conditions (Stojaković et al., 2015).
Soybean is more vulnerable to drought and erosion at the beginning of the growing season, with a less developed root system and crop cover. However, toward the end of the vegetative phase, the crop has a strong root system and has approximately 500 mm water requirement during the growing season (Djordjevic et al., 2015).
For both crops, the critical period for water is from the flowering to grain filling in the summer months, a period when the temperature is highest with a low relative humidity and the lowest precipitation in Serbia.
From 1961 the 1990, temperature and precipitation were analyzed as decisive agrometeorology parameters that may limit crop production. The temperature was observed from 12.1 to 28.2 °C in the JJA period, and the average precipitation varied from 102.6 mm to 368.6 mm in the same JJA period. The temperature did not exceed critical limits, while the precipitation varied from year to year. The temperature conditions were favorable for both maize and soybean productions; s it was necessary to irrigate crops only in several dry year during the JJA period.
5.2. Climate change impact on yield, net irrigation, and IWUE for 2041–2070 and 2071–2100
The analyzed results for temperature and precipitation under future conditions confirm previous researches (Jancic, 2017; Jancic et al., 2015; Olesen et al., 2011) and reports (Central and Eastern Europe Climate Change Impact and Vulnerability Assessment [CECILIA], 2006; IPCC, 2001), that temperature is expected to increase, especially during summer months, with lower precipitation. The higher temperatures, more days with extreme high temperatures, and lack of precipitation lead to the simulated lower yields for maize and soybean when irrigation is not included (Jancic, 2016b; Jancic et al., 2015), and to stable and higher yields when the crop is under irrigated conditions (Jancic et al., 2015). Simulations with the CO2 effect also gave higher yields, as in previous studies, for soybean (CECILIA, 2006; Jancic et al.,
2015; Mihailović et al., 2014; Southworth et al., 2002; Wittwer, 1995) and maize (Jancic, 2016a; Mihailović et al., 2014; Wang et al., 2011). The expected increase in temperature and lack of precipitation caused higher net irrigation and lower IWUE values in the simulated maize and soybean crop productions under optimum available water conditions. Previous research in various regions has also reported and expected higher water demands in future conditions (FAO Water Reports, 2011).
6. Conclusions
• Higher temperatures are expected during the AS growing period, especially during summer months (JJA).
• Precipitation is expected to be significantly lower in the future conditions during all months of the growing season (AS), especially in the summer JJA period.
• In future conditions, the expected benefit is higher yield in maize and soybean production.
• Significantly higher net irrigation is expected with the same total available water conditions under current crop management and lower IWUE values.
The crop simulation results showed higher yield production for both maize and soybean crops under future conditions. On the basis of the crop model results, maize and soybean production is expected to benefit from climate changes and increases in CO2, which make it possible to increase these crop production areas in Serbia. Additionally, it is necessary to note that the AquaCrop model gave high yield production results under very significant higher net irrigation in future conditions. The AquaCrop model has a solution to fix the percent of total available water for crops and gives the possibility to estimate and test various irrigation methods and quantities through simulations and their impact on yield using climate scenarios. It is also noticeable that irrigation water efficiency is lower. Water is a natural resource that has limitations, and it is necessary in further researches to test limited irrigation conditions as a sustainable water use, their impact on yield, and the limit of water use to maintain a high yield in maize and soybean production under future conditions. Additionally, it is necessary to estimate various adaptation measures, such as earlier sowing date, mulching, sustainable fertilization, various genetic varieties of crops, and most adaptable crops in future climate conditions.
Acknowledgements: The research described here was funded by the Serbian Ministry of Science and Technology under project No. III 43007 “Research of climate changes and their impact on environment. Monitoring of the impact, adaptation and moderation” for 2011-2018, and project No.
References
Abedinpour, M., Sarangi, A., Rajput, T.B.S., Singh, M., Pathak, H. and Ahmad, T., 2012: Performance evaluation of AquaCrop model for maize crop in a semi-arid environment. Agric. Water Manage. 110, 55–66. https://doi.org/10.1016/j.agwat.2012.04.001
Ahmadi, S.H., Mosallaeepour, E., Kamgar-Haghighi, A.A. and Sepaskhah, A.R., 2015: Modeling maize yield and soil water content with AquaCrop under full and deficit irrigation managements. Water Res. Manage. 29, 2837–2853. https://doi.org/10.1007/s11269-015-0973-3 Alexandrov, V., Eitzinger, J., Cajic, V. and Oberforster M., 2002: Potential impact of climate change
on selected agricultural crops in north‐eastern Austria. Glob. Change Biol. 8, 372–389.
https://doi.org/10.1046/j.1354-1013.2002.00484.x
Allen, R.G., Pereira, L.S., Raes, D. and Smith, M., 1998: Crop Evapotranspiration. Guidelines for computing crop water requirements. Irrigation and drainage paper 56. FAO, Rome.
Bindi, M., Palosuo, T., Trnka, M. and Mikhail, A., 2015: Modelling climate change impacts on crop production for food security. Climate Res. 65, 3–5. https://doi.org/10.3354/cr01342
Central and Eastern Europe Climate Change Impact and Vulnerability Assessment (CECILIA), 2006:
Climate change impacts in central-eastern Europe: Crop yield and forest tree growth changes influenced by climate change effects, regional conditions and management systems (Project No.
037005, Report: D6.1). National Forest Center, Forest Research Institute, Zvolen, Slovakia.
Djordjevic, V., Malidža, G., Vidić, M., Milovac, Ž. and Šeremešić, S., 2015: Priručnik za gajenje soje – Danube Soya. Novi Sad, Srbija. (In Serbian)
Downing, T.E., Harrison, P.A., Butterfield, R.E. and Lonsdale, K.G., 2000: Climate Change, climatic variability and agriculture in Europe. An integrated assessment (Research Report 21, Contract ENV4-CT95-0154). Commission of the European Union, Brussels, Belgium.
EEA, 2004: Impacts of Europe`s changing climate: An indicator – based assessment (EEA Report no.
2/2004). EEA, Copenhagen.
EEA, 2005: Climate change and river flooding in Europe (Briefing No. 1). EEA, Copenhagen.
EEA, 2007a: Climate change: The costs of inaction and the cost of adaptation (Technical Report 13/2007). EEA, Copenhagen.
EEA, 2007b: Climate change and water adaptation issues (Briefing Document 2007: 01). EEA, Copenhagen.
FAO Water Reports, F. W., 2011: Climate change, water and food security. Food and Agricultural Organization of the United Nations, Rome.
Farahani, H.J., Izzi, G. and Oweis, T.Y., 2009: Parameterization and evaluation of the AquaCrop model for full and deficit irrigated cotton. Agronomy J. 101, 469–476.
https://doi.org/10.2134/agronj2008.0182s
Harrison, P., Butterfield, R. and Downing, T., 1995: Climate change and agriculture in Europe assesment of impacts and adaptation. University of Oxford, Oxford, UK.
Houghton, J.T., Filho, L.G.M., Callander, B.A., Harris, N., Kattenberg, A. and Maskell, K., 1996:
Climate change. The science of climate change. Cambridge University Press, Cambridge, UK.
Intergovernmental Panel on Climate Change (IPCC), 2001: Fourth Assessment Report 2001 Report of working group III Mitigation. https://www.ipcc.ch/ipccreports/tar/wg3/index.htm
IUSS Working Group WRB, 2007: World Reference Base for Soil Resources 2006; First Update 2007. World Soil Resources Reports 103. FAO, Rome.
Jančić, M., Lalic, B., Mihailovic, D.T. and Jacimovic, G., 2015: Impact of climate change and carbon dioxide fertilization effect on irrigation water demand and yield of soybean in Serbia. J. Agric.
Sci. 153, 1365–1379. https://doi.org/10.1017/S0021859615000179
Jančić, M., 2016a: Climate change adaptation in maize production in Serbia (FACCE MACSUR Reports 2: SP9 – 3). MACSUR, Tromso-Trondheim.
Jančić, M., 2016b: Uticaj klimatskih promena na biljnu proizvodnju (PhD thesis), University of Novi Sad, Novi Sad.
Jančić, M., 2017: The use of Agriclim model in agriculture production analyses in Novi Sad.
Proceedings of the 45th International Symposium on Agricultural Engineering, Actual Tasks on Agricultural Engineering, 21-24, Opatija, Croatia.
Kotorac, F., 2014: Utjecaj obrade tla i gnojidbe dušikom na prinos kukuruza (Batchelor work), Poljoprivredni fakultet, Sveučilište Josipa Jurja Strossmayera, Osijek.
Lalic, B., Eitzinger, J., Mihailovic, D. T., Thaler, S. and Jancic, M., 2012: Climate change impacts on winter wheat yield change – which climatic parameters are crucial in Pannonian lowland? J.
Agric. Sci. 151, 757–774. https://doi.org/10.1017/S0021859612000640
Lalic, B., Eitzinger, J., Thaler, S., Nejedlik, P., Kazandjiev, V., Vucetic, V., and Eckersten, H., 2011:
Using results of modelled yield deviation and indices of weather extremes towards a better yield assessment – current state of research. the Abstracts, International Conference on Current Knowledge of Climate Change Impacts on Agriculture and Forestry in Europe, 3.-6.5.2011, Topolcianki, Slovačka.
Mihailović, D. T., Lalić, B., Drešković, N., Mimić, G., Djurdjević, V. and Jančić, M., 2014: Climate change effects on crop yields in Serbia and related shifts of Köppen climate zones under the SRES‐A1B and SRES‐A2. Int. J. Climatol. 35, 3320–3334. https://doi.org/10.1002/joc.4209 Miladinović, J., Hrustić, M. and Vidić, M., 2008: Soja, monografija. Institut za Ratarstvo i Povrtarstvo,
Novi Sad i Sojaprotein, Bečej. (In Serbian)
Olesen, J. E., Trnka, M., Kersebaum, K. C., Skjelvåg, A. O., Seguin, B., Peltonen-Sainio, P., and Micale, F., 2011: Impacts and adaptation of European crop production systems to climate change. Eur. J. Agronomy 34, 96–112. https://doi.org/10.1016/j.eja.2010.11.003
Paredes, P., de Melo-Abreu, J. P., Alves, I. and Pereira, L.S., 2014: Assessing the performance of the FAO AquaCrop model to estimate maize yields and water use under full and deficit irrigation with focus on model parameterization. Agric. Water Manage. 144, 81–97.
https://doi.org/10.1016/j.agwat.2014.06.002
Pejić, B., Maheshwari, B., Šeremešić, S., Stričević, R., Pacureanu-Joita, M., Rajić, M. and Ćupina, B., 2011b: Water-yield relations of maize (Zea mays L) in temperate climatic conditions. Maydica 56, 315–323.
Pejic, B., Maksimović, L., Cimpeanu, S., Bucur, D., Milić, S. and Ćupina, B., 2011a: Response of soybean to water stress at specific growth stages. J. Food Agric. Environ. 9, 280–284.
FAO Water Reports, F. W., 2011: Climate change, water and food security. Food and Agricultural Organization of the United Nations, Rome.
Roeckner, E., Bäuml, G., Bonaventura, L., Brokopf, R., Esch, M., Giorgetta, M., and Tompkins, A., 2003: The atmospheric general circulation model ECHAM-5: Model description (Report No.
349). Max-Planck-Institut fur Meteorologie, Hamburg, Deutschland.
Rosenzweig, C. and Iglesias, A., 1994: Implication of climate change for international agriculture, crop modeling study (EPA 230-B-94-. 003). Environmental Protection Agency, Washington, DC, US.
Sathaye, J.A., Dixon, R.K. and Rosenzweig, C., 1997: Climate change country studies. Applied Energy, 56(3), 225–235. https://doi.org/10.1016/S0306-2619(97)0007X-4
Southworth, J., Pfeifer, R., Habeck, M., Randolph, J., Doering, O., Johnston, J. and Rao, D.G., 2002:
Changes in soybean yields in the midwestern United States as a result of future changes in climate, climate variability, and CO 2 fertilization. Climatic Change 53, 447–475.
https://doi.org/10.3354/cr022073
Statistical Office of the Republic of Serbia (RSSS), 2012: Statistical yearbook of the Republic of Serbia 2012. Statistical Office of the Republic of Serbia, Belgrade, Serbia.
Steduto, P., Hsiao, T. C., Raes, D. and Fereres, E., 2009: AquaCrop—The FAO crop model to simulate yield response to water. I. Concepts and underlying principles. Agronomy J. 101, 426–
437. https://doi.org/10.2134/agronj2008.0139s
Stojaković, M., Jocković, Đ., Bekavac, G., Nastasić, A., Mitrović, B., Stanisavljević, D. and Zorić, M., 2015: Prinos NS hibrida kukuruza iz različitih perioda selekcije. Selekcija i Semenarstvo 21, 93–102. (In Serbian) https://doi.org/10.5937/SelSem1502093S
Stricevic, R., Cosic, M., Djurovic, N., Pejic, B. and Maksimovic, L., 2011: Assessment of the FAO AquaCrop model in the simulation of rainfed and supplementally irrigated maize, sugar beet and sunflower. Agric. Water Manage. 98, 1615–1621. https://doi.org/10.1016/j.agwat.2011.05.011 Tornqvist, L., Vartia, P. and Vartia, Y.O., 1985: How should relative changes be measured? Amer.
Statistic 39, 43–46. https://doi.org/10.1080/00031305.1985.10479385
Trnka, M., Zalud, Z., Semeradova, D., Ventrella, D., Anastasiou, D. P., Medany, M., Altaher, S., Olejnik, J., Lesny, J., Nemeshko, N., Nikolaev, M., Simota, C. and Cojocaru, G., 2009: Final report, including recommendations on adaptation measures considering regional aspects. Final scientific report of the ADAGIO Project: “Adaptation of agriculture in European regions at environmental risk under climate change”; Specific Support Action, FP6-2005-SSP-5-A, Proj.No.044210, Sixth Framework Programme, European Commission, Ed.: Institute of Meteorology, University of Natural Resources and Applied Life Sciences, Vienna.
Tsuji, G., Hoogenboom, G. and Thornton, P.K., 1998: Understanding options for agricultural production. Kluwer Academic Publishers, Dordrecht, Netherlands.
https://doi.org/10.1007/978-94-017-3624-4
Wang, M., Li, Y., Ye, W., Bornman, J.F. and Yan, X., 2011: Effects of climate change on maize production, and potential adaptation measures: a case study in Jilin Province, China. Climate Res. 46, 223–242. https://doi.org/10.3354/cr00986
Wittwer, S.H., 1995: Food, climate, and carbon dioxide – the global environment and world food production. NewYork, NY: Lewis Publishers.
Wolf, J. and Van Diepen, C., 1995: Effects of climate change on grain maize yield potential in the European Community. Climatic Change, 29(3), 299–331.
https://doi.org/10.1007/BF01091866