DOI:10.28974/idojaras.2019.3.6
IDŐJÁRÁS
Quarterly Journal of the Hungarian Meteorological Service Vol. 123, No. 3, July – September, 2019, pp. 351–370
Future climate change impacts on residential heating and cooling degree days in Serbia
Aleksandar Janković1*, Zorica Podraščanin2, and Vladimir Djurdjevic3
1University of Banja Luka, Faculty of Architecture Civil Engineering and Geodesy
Bulevar vojvode Petra Bojovića 1A Banja Luka 78000, Bosnia and Herzegovina
2University of Novi Sad, Faculty of Sciences Dr Zorana Đinđića 1, Novi Sad 21000, Serbia;
3University of Belgrade, Faculty of Physics Studentski trg 1, Belgrade 11000, Serbia;
*Corresponding author E-mail: aleksandar.jankovic@aggf.unibl.org (Manuscript received in final form June 1, 2018)
Abstract⎯ This study analyzes the potential changes of residential heating and cooling degree days (HDD and CDD) in the 21st century over Serbia with the regional climate model (RCM) EBU-POM under two different forcing scenarios (A1B and A2). The validation of the model shows that the model reproduces the spatial variability, magnitude, and annual cycles of HDD and CDD for the reference period very well.
According to both scenarios, a significant decrease of HDD and increase of CDD is expected all over Serbia. The simulations show a spatial heterogeneity in the potential changes, with the largest decrease of HDD in southern (mountainous) Serbia and largest increase of CDD in northern (lowland) Serbia. Results also show that by the end of the 21st century, the existing ratio between populations weighted regional mean CDD and HDD of 1:7.3 could be reduced to 1:2.3 according to the A1B scenario and 1:2.0 according to the A2 scenario. At the end of the 21st century cooling season length will be for about two times longer than at the reference period, while length of the heating season will be reduced for about 25%. According to both scenarios model projected an increase of the heating and cooling season temperature through 21st century by slightly less than 2 °C. Our study is the first research of future changes in HDD and CDD over Serbia based on regional climate modeling. Results of the research should help the policy of energy management and planning through provided indications of future spatial and seasonal changes of HDD and CDD within Serbia.
Key-words: climate change, heating degree days, cooling degree days, regional climate model, building energy demand, Serbia
1. Introduction
The globally averaged surface temperature of the Earth increased 0.85 °C over the 1880 to 2012 period. It is extremely likely that the observed warming of the climate system was caused by the increased anthropogenic emission of green- house gases. Due to the further human induced contribution and natural climate variability, it is expected that, according to four different scenarios of greenhouse gases emissions (from scenario of immediate decrease of emissions to scenario of constant increase), global surface temperature will increase from 0.3 to 4.8 °C by the end of the 21st century (2081–2100) relative to the period of 1986–2005 (IPCC, 2013). During the period 1960–2012, significant increase of daily mean temperature was observed in Serbia with an average trend of 0.3 °C/decade on annual level. The whole territory of Serbia experienced a significant increase in temperatures from the middle of the previous century, especially during the summer and spring seasons (Second National Communication of the Republic of Serbia under the United Nations Framework Convention on Climate Change, 2017). Future changes in climate indices with regional climate models (RCMs) over Serbia were investigated by very few authors (Krzić et al., 2011). Recent research shows that relative to the reference period (1961–1990), by the end of the 21st century (2071–2100) it is expected that the surface air temperature will increase for 3.2–3.6 °C and 3.6–4.0 °C (Second National Communication of the Republic of Serbia under the United Nations Framework Convention on Climate Change, 2017) according to the A1B and A2 scenarios, respectively.
The predicted increase in temperature due to climate change will significantly affect the energy consumption in the Republic of Serbia (Serbia).
Heating and cooling in the building sector of Serbia currently accounts around 45% of gross final energy consumption according to the official data(National Renewable Energy Action Plan of the Republic of Serbia, 2013). The expected climate change will significantly alter this balance. In particular, higher temperatures are projected decreasing the energy demand for heating in winter and increasing the electricity demand for cooling in summer. A useful tool for evaluating heating and cooling demands in building sector is the degree day method(Quayle and Diaz, 1980). Even though this technique is associated with some limitations (Day and Karayiannis, 1998; Krese et al., 2011), it has been widely used to estimate energy demand for heating and cooling in the climate change studies both at global and regional levels. Isaac and Vuuren (2009) have shown in their study that regional HDD weighted by population will decrease by the 21st century, and that CDD will increase for all regions on the Earth.
Consequently, the global energy demand for cooling will increase rapidly over the whole 21st century, while global energy demand for heating is expected to increase by 0.8% per year until 2030, and after that it will decrease slowly. A significant decrease of HDD is expected through the 21st century over the
European region, especially over Scandinavia and European Russia, while an increase of CDD is expected, which peaks over the Mediterranean region and the Balkans(Spinoni et al., 2018). With included population projections over the 21st century it is expected, that despite the persisting warming, the related energy demand expressed as energy degree days (EDD) will result in an overall increase over Europe. According to the author, energy degree days as a measure of total energy demand are obtained by summing heating and cooling degree days. Christenson et al. (2006) projected a decrease between 13% and 87% in HDD for the period of 1975–2085 for Switzerland and accelerating positive trends for CDD through the 21st century, which will lead to significant, seasonally and regionally variable shifts in the energy consumption of Swiss buildings. Petri and Caldeira (2015) explored future changes in HDD/CDD in the United Sates and concluded that areas with high HDD/CDD will suffer relatively large decrease/increase, respectively, while energy degree days (HDD + CDD) as indicator of total energy demand for heating and cooling will decrease in the middle and northern parts of the United States, while southern parts will suffer an increase of this quantity. Shi et al. (2016) predicted the significant decreases in population weighted HDD and increases in the CDD over China, which will result in a decrease of around 15% in the potential energy demand over China.
The climate change and the consequent necessity for reduction of energy consumption and greenhouse gas emissions motivated us to examine future climate change impacts on indicators of residential heating and cooling energy demand. The objective of the paper is to quantify the impact of expected climate changes on the air temperature on residential heating and cooling degree days over Serbia. It should be emphasized that this research does not quantify future changes in heating or cooling residential energy demand, but gives an overview of projected changes in indicators which point to the sign and trend of changes in energy demand. Climate projections were conducted with the RCM EBU- POM using A1B and A2 scenarios (Djurdjevic and Rajkovic, 2010). Due to the higher spatial resolution and more precise description of terrain and surface characteristics, RCM can provide more information about the response of heating and cooling degree days (HDD and CDD) to global warming over some specific region. The first section gives a brief introduction and an overview of the latest research in this area. After that a brief description of the used RCM EBU-POM and calculation methods for HDD and CDD are presented. The third section covers the results of our research, including validation of the model performance when applied in this impact assessment. Results of the HDD and CDD calculation from measured and modeled data for the reference period (1971–2000) and for the future periods (2011–2040, 2041–2070, 2071–2100) are shown later in this section. The interpolation of HDD and CDD data on high resolution over Serbia for the reference period and future period (2071–2100) was done using estimated regression model considering also topography
variability using DEM (Digital Elevation Model) dataset. Temporal evolution and annual cycle of population weighted means of HDD and CDD over Serbia in the 21st century (2011–2100) were investigated under A1B (medium emissions) and A2 (high emissions) SRES scenarios. Finally, regionally averaged length and temperature of the heating and cooling season of the four considered periods are calculated according to both forcing scenarios. Both quantities are population weighted in order to more accurately reflect on the temperature-related energy demand at the country level. The last section gives a discussion about the importance of our research findings and a basic conclusion with respect to future changes in HDD and CDD values over Serbia. Results and methodology presented in this study provide the information for assessment of future energy demands and its annual redistribution, and may contribute to the future planning in this sector, which is an important part of the future sustainable development. The results of this study can be very useful for quantifying the future heating and cooling energy demand in the residential sector of Serbia.
2. Material and methods
2.1. Regional climate model
The simulation of future climate conditions are conducted with the RCM EBU- POM (Djurdjevic and Rajković, 2008) driven by the ECHAM5 coupled atmosphere–ocean general circulation model (Roeckner et al., 2003). EBU-POM is a two-way coupled RCM with an atmospheric domain that covers almost the entire European region with a horizontal resolution of 0.25° over land and 0.2°
over ocean. For the Serbian region, model results are validated against the observed data from 17 meteorological stations. The previous analysis showed that an improvement by EBU-POM has been achieved in reproducing the climate variation over a very small region compared to the driving global climate model (Kržić et al., 2012). In this paper, we used bias corrected daily values of temperature for the reference and future periods as it is common for climate impact studies. Bias correction was applied on EBU-POM results (Ruml et al., 2012) using the quantile mapping approach (Piani et al., 2010; Raisanen and Raty, 2013). A correction function for each month was derived using observed and modeled temperature data over the period 1961–1990 assumpting that the cumulative density functions for observed and modeled values should be equal, also that temperature data follow normal distribution.
2.2. Degree-days
HDD and CDD are quantitative indices of required energy for heating and cooling of building. Degree-days are defined as accumulated temperature difference between the daily mean external air temperature and a reference
temperature for a given period of time (Hitchen, 1981). In some countries, a threshold temperature different from the reference temperature is used for heating. This threshold temperature determines the beginning, end, and length of the heating season (EN ISO 15927-6, 2007). If we introduce the concept of threshold temperature, degree days will indicate the total deficit (°C) relative to the reference temperature and duration of the period (days), when the external air temperature is lower than a determined threshold value, and when a building needs heating to maintain indoor thermal comfort (Matzarakis and Balafoutis, 2004). The unit for heating and cooling degree days will be labeled with °D as it was labeled in the paper of Shi et al. (2016).
Although each building has its own unique reference and threshold temperature depending on the characteristics of the building and the climatic conditions(Lindelöf, 2017), in the countries where the government controls the central heating system, the reference and threshold temperature are defined depending on the level of economic development, the average housing insulation properties, and climatic conditions (Martinaitis, 1998; Shen and Binhui, 2016). According to the current policy in the Republic of Serbia (Rule Book on energy efficiency of buildings, 2011),the length of the heating season and the number of annual HDD is defined by the following equation:
HDD=Z· trh-tht +∑Zn=1(tht-tn) (1) where tn is the daily temperature normal (it refers to the long-term average of daily mean external air temperautre) and Z is the length of the heating season in days. According to the current policy in the Republic of Serbia, the reference temperature for heating, trh is equal to 19 °C, and the heating threshold temperature tht is equal to 12 °C(Živković and Novoselec, 1998). Defined in this way, HDD take into account the accumulated temperature difference only during the heating season, where the length of the heating season is determined on the basis of the daily temperature normals (at least 20-year period of averaging).
The heating season officially begins on a first day of autumn with normal daily temperature lower than 12 °C and ends on a first day of spring with normal daily temperature higher than 12 °C.
In order to reflect on the actual energy demand for heating and to avoid a downward bias of HDD in transitional months (May, October), we decided not to calculate HDD from daily temperature normals and the fixed season length.
Instead, we opted to calculate HDD from all days of the given year with a daily mean external air temperature less than 12 °C. In this way, it is possible to include the effect of the inter-annual variability of HDD, the length of the heating season, and the mean temperature of the heating period. Defined in this way, HDD can be calculated according to the following equation:
HDD=∑Nn=1hh·(trh-tn), (2)
where N is the number of days in a year (365 or 366), tn is the daily mean external air temperature, and trh is the reference temperature for heating assumed to be equal to 19.0 °C. If a daily mean external air temperature is lower than the threshold temperature (tn<12 °C), hh is equal to 1, otherwise (tn>12 °C) hh is equal to 0.
However, the methodology for calculating CDD is not defined, as the building sector in Serbia on average consumes about 10 times less energy on cooling than on heating on average (National Renewable Energy Action Plan of the Republic of Serbia, 2013). There are a number of existing different methods for calculation of CDD and different definitions of reference temperatures. The most widely used method is ASHRAE method (ASHRAE. 2005; Al-Hadhrami, 2013) where the annual CDD are defined as:
CDD=∑Nn=1cc·(tn-trc) (3) where N is the number of days in a year (365 or 366), tn is daily mean external air temperature and trc is reference temperature for cooling assumed to be equal to 18.3 °C. If a daily mean external air temperature is higher than the reference temperature, cc is equal to 1, otherwise cc is equal to 0. According to this method, the cooling threshold temperature is equal to the reference temperature.
Since the country in Europe has its own standard computation, the ASHRAE method was accepted as the standard method for calculating CDD by the European Insulation Manufacturers Association (EURIMA) in their study on energy performance of European buildings(Boermans and Petersdorff, 2007).
2.3. Regression analysis
We used the RCM EBU-POM bias corrected daily values of temperature for 30 grid points over Serbia. Thirty output points from the model match the most populated places and the most famous tourist attractions in Serbia. In order to accurately map HDD/CDD over Serbia andto estimate degree days over the whole territory, the impact of the altitude z [m], longitude θ, and latitude λ [0] on HDD or CDD values must be taken into account through regression analysis (Idchabania et al., 2013; Vizi et al., 2011). For the information on altitude, longitude, and latitude, we used the Digital Elevation Model (DEM) of Serbia (U.S. Geological Survey, 2017) with resolution of 1-arc-second (approximately 30 m), therefore, final maps of HDD and CDD for reference and future periods has been drawn on this resolution.
3. Results
3.1. Verification of the regional climate model
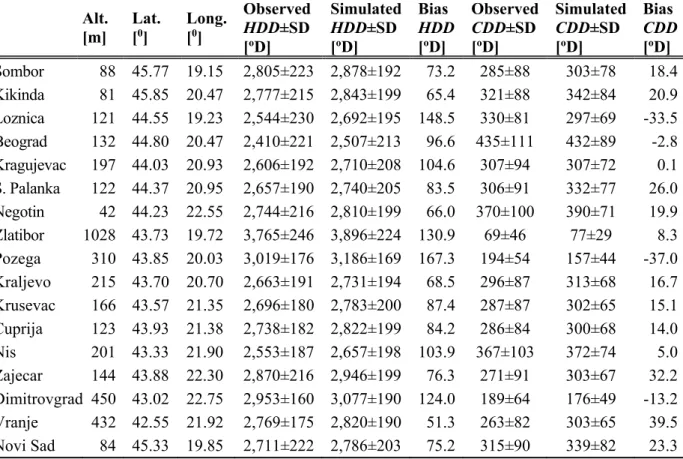
The credibility of the RCM to reproduce HDD and CDD can be assessed by comparing HDD and CDD calculated using observed daily temperature values with HDD and CDD calculated using the model daily temperature for the reference period. For that purpose and since we did not have measurements for all of the 30 model points, we used daily temperature observations from 17 stations of meteorological of observing system in Serbia (Republic Hydrometeorological Institute of Serbia). Table 1 shows the observed and simulated HDD and CDD values for the period 1971 to 2000, along with the standard deviation (SD) as a measure of the interannual variability and bias. Since the climate of Serbia is moderately continental, much larger values of HDD are found than CDD. The higher altitude areas, placed between the Pannonian valley and the Adriatic Sea have greater spatial variability of surface temperature and, consequently, HDD and CDD. The largest values of HDD and concurrently the lowest values of CDD are found for higher altitude locations (Zlatibor and Požega). Belgrade stands out as the place with the lowest annual HDD and the highest annual CDD, probably due to the effect of the urban heat island.
Table 1. Observed and simulated HDD and CDD along with the interannual standard deviation and bias between the modeled and observed values in the reference period (1971–2000) at 17 meteorological stations in Serbia
Alt.
[m]
Lat.
[0]
Long.
[0]
Observed HDD±SD [oD]
Simulated HDD±SD [oD]
Bias HDD [oD]
Observed CDD±SD [oD]
Simulated CDD±SD [oD]
Bias CDD [oD]
Sombor 88 45.77 19.15 2,805±223 2,878±192 73.2 285±88 303±78 18.4 Kikinda 81 45.85 20.47 2,777±215 2,843±199 65.4 321±88 342±84 20.9 Loznica 121 44.55 19.23 2,544±230 2,692±195 148.5 330±81 297±69 -33.5 Beograd 132 44.80 20.47 2,410±221 2,507±213 96.6 435±111 432±89 -2.8 Kragujevac 197 44.03 20.93 2,606±192 2,710±208 104.6 307±94 307±72 0.1 S. Palanka 122 44.37 20.95 2,657±190 2,740±205 83.5 306±91 332±77 26.0 Negotin 42 44.23 22.55 2,744±216 2,810±199 66.0 370±100 390±71 19.9 Zlatibor 1028 43.73 19.72 3,765±246 3,896±224 130.9 69±46 77±29 8.3 Pozega 310 43.85 20.03 3,019±176 3,186±169 167.3 194±54 157±44 -37.0 Kraljevo 215 43.70 20.70 2,663±191 2,731±194 68.5 296±87 313±68 16.7 Krusevac 166 43.57 21.35 2,696±180 2,783±200 87.4 287±87 302±65 15.1 Cuprija 123 43.93 21.38 2,738±182 2,822±199 84.2 286±84 300±68 14.0
Nis 201 43.33 21.90 2,553±187 2,657±198 103.9 367±103 372±74 5.0 Zajecar 144 43.88 22.30 2,870±216 2,946±199 76.3 271±91 303±67 32.2 Dimitrovgrad 450 43.02 22.75 2,953±160 3,077±190 124.0 189±64 176±49 -13.2 Vranje 432 42.55 21.92 2,769±175 2,820±190 51.3 263±82 303±65 39.5 Novi Sad 84 45.33 19.85 2,711±222 2,786±203 75.2 315±90 339±82 23.3
The spatial distribution and magnitudes of both HDD and CDD have been reproduced very well by RCM EBU-POM over Serbia. Spatial correlation coefficients between the modeled and observed data amounts 0.99 for HDD and 0.97 for CDD (statistically significantly at the 95% confidence level). The model gives slightly higher values of HDD all over Serbia. This difference occurs because HDD and CDD are cumulative values of temperatures for long period of time (heating or cooling period). The small difference in the range of the measurement error of the thermometer (0.2 °C) between the modeled and observed values can cause cumulative error. The relative bias varies from 1.9%
for Vranje to 5.8% for Loznica with a spatial average value of 3.4%. Concerning CDD, the model gives mainly lower values than those derived from observed temperatures, except for Loznica (–10.2%), Dimitrovgrad (–7.0%), Pozega (–19.0%), and Beograd (–0.6%). The positive relative bias varie from 0.0 % for Kragujevac to 15.0% for Vranje. Observed and simulated SD of HDD and CDD as a measure of interannual variability were compared. For HDD, the model mainly underestimate SD across northern Serbia and overestimate across southern Serbia with the correlation coefficient of 0.56 (statistically significantly at the 95% confidence level). For CDD, the model underestimate SD all over Serbia with the correlation coefficient of 0.90 (statistically significantly at the 95% confidence level). The relative difference between the observed and simulated SD of CDD varie from –5.0% for Kikinda to –35.4% for Zlatibor with a spatial average value of –20.4%.
The monthly regional averages of HDD and CDD for the period of 1971–
2000 obtained from observations and simulation over Serbia are presented in Fig. 1. Both the model and the observations show that the months with the highest regional mean HDD and CDD are January and July, respectively.The months in which a significant number of HDD and CDD appear simultaneously are the transitional months of May and September. The observed monthly values have been simulated very well by the RCM EBU-POM with overestimations of HDD and CDD in most months, mainly due to the overestimation of the mean temperature all over Serbia during summer and the underestimation in southern Serbia during the autumn and spring(Kržić et al., 2011).
The previously presented verification analysis shows that the model reproduces the spatial variability and annual cycles of HDD and CDD very well (Table 2). Biases are present, but at the same time they are smaller than the SD and negligible compared to the magnitude of HDD and CDD. However, it is important to note that the model underestimated observed the interannual variability of CDD to a certain extend all over Serbia.
Fig. 1. Annual cycle of the observed and simulated HDD and CDD average over Serbia in the reference period (1971−2000).
Table 2. Linear regression models of HDD and CDD for the reference (1971–2000) and future (2071-2100) periods
Period Equation
Correlation coefficient R []
Coefficient of determination R2 []
Standard error [oD]
Model (1971-2000) HDD=-4899+1.598·z+149.7·λ+38.13·θ 0.977 0.955 129.5 A1B (2071-2100) HDD=-3907+1.201·z+112.7·λ+34.12·θ 0.966 0.933 119.4 A2 (2071-2100) HDD=-3503+1.164·z+99.93λ+36.10·θ 0.963 0.927 122.4 Model (1971-2000) CDD=-814.3-0.229·z+17.81·λ+17.74·θ 0.907 0.823 48.1 A1B (2071-2100) CDD=-804.7-0.434·z+26.42·λ+20.64·θ 0.919 0.844 82.3 A2 (2071-2100) CDD=-856.7-0.460·z+27.25·λ+24.62·θ 0.917 0.841 88.1
3.2. Future changes of HDD and CDD
The spatial distribution of HDD and CDD are presented for the end of the 21st century (2071–2100) under two different emission scenarios (A1B and A2).
A1B and A2 scenarios are known as ‘medium’ and ‘high’ forcing scenarios
0 100 200 300 400 500 600 700
HDD or CDD [oD]
Observed HDD EBU-POM HDD Observed CDD EBU-POM CDD
(IPCC, 2007), where CO2 concentration at the end of the 21st century is about 1.8 and 2.2 times higher than the present value(Nakićenović and Swart, 2000). HDD and CDD values are calculated as 30-year averages for the future period and compared with model projection for the period 1971 to 2000. Based on the estimated regression model (Table 1), HDD and CDD were calculated in relation to the altitude, longitude, and latitude for each point of coordinates by using a geographical information system (GIS) environment(QGIS, 2014) and appropriate digital elevation model (DEM). The lower values of the coefficient of determination for CDD reveals a weaker correlation between CDD and geographical parameters. This could be influenced by some other factors such as humidity, urban heat island effects, and predominant winds from northwest and west during the warmer part of the year(Kržić et al., 2011; Smailagić et al., 2013).
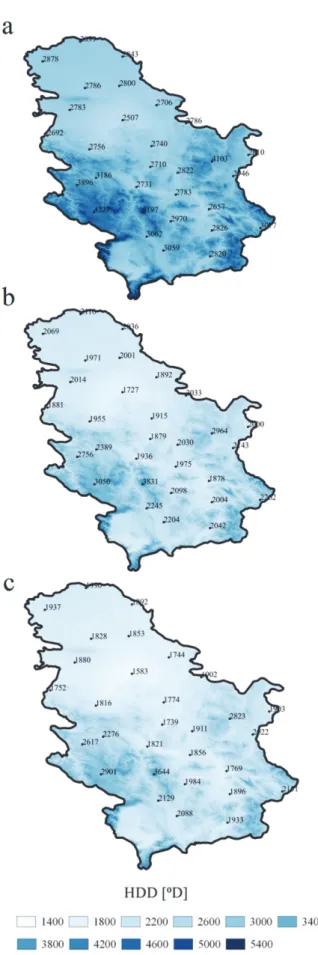
The spatial distribution of HDD is presented in Fig. 2 for the future (2071–
2100) and the reference period (1971–2000) under the A1B and A2 scenarios. The figure shows the values of HDD in 30 points derived from the bias corrected data of the RCM EBU-POM. The rest of Serbia is mapped using the regression analysis technique and correlation between HDD and geographical parameters with residual corrections. A decrease of HDD is expected all over Serbia.
The largest change of HDD is expected in the mountainous (southern) Serbia with a reduction of more than 1000 °D. According to the A1B and A2 scenarios by the end of the 21th century, Kopaonik will suffer a record reduction of HDD, 1366 and 1533 °D, respectively. Minimum reduction of HDD, 752 and 884 °D are expected at Veliko Gradište according to A1B and A2 scenarios, respectively. The population weighted regional average of HDD for the reference period (1971–
2000) is 2675 °D, while for the future period (2071–2100), under the A1B scenario it is 1877 °D. A2 scenario projects even larger reduction of HDD with regional average of 1743 °D. We assumed that the ratio between the settlements population will not change, so that the future population decline in Serbia will not affect the population weighted regional average of HDD and CDD.
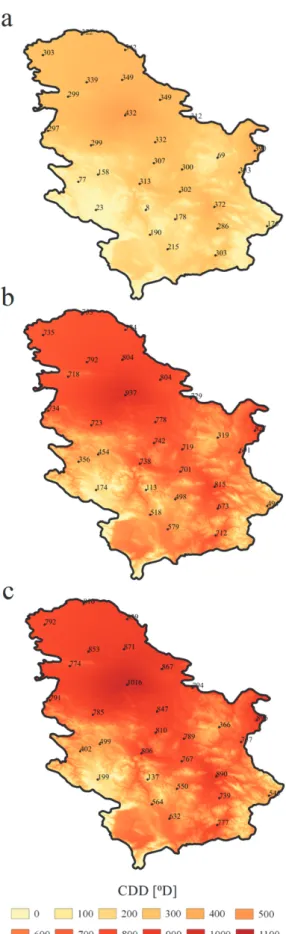
The spatial distribution of CDD is presented in Fig. 3 for the future (2071- 2100) and the reference period (1971-2000) under the A1B and A2 scenarios.
Figures show the values of CDD in 30 points derived from the bias corrected data of the RCM EBU-POM. The rest of Serbia is mapped using the regression analysis technique and correlation between CDD and geographical parameters with residual corrections. An increase of CDD is expected all over Serbia. Unlike for HDD, the largest change of CDD is expected in northern (lowland) Serbia with an increase of more than 500 °D. According to the A1B and A2 scenarios by the end of the 21st century, Belgrade will suffer a record increase of CDD, 505 and 584 ⁰D, respectively. Minimum reduction of CDD, 105 and 129 ⁰D are expected for Kopaonik according to the A1B and A2 scenarios, respectively. Population weighted regional average of CDD for the reference period (1971–2000) is 365
⁰D, while for the future period (2071-2100) under the A1B scenario, it is 823 ⁰D.
A2 scenario projects even larger CDD increase with a regional average of 894 ⁰D.
Fig. 2. Spatial distribution of HDD (a) for the reference period (1971–2000), (b) for the future period (2071–2100) under the A1B scenario, and (c) for the future period (2071 to 2100) under the A2 scenario.
Fig. 3. Spatial distribution of CDD (a) for the reference period (1971–2000), (b) for the future period (2071–2100) under the A1B scenario, and (c) for the future period (2071 to 2100) under the A2 scenario.
According to the population weighted regional average, the ratio between CDD and HDD for the reference period (1971–2000) is 1:7.3. By the end of the 21st century, the ratio between CDD and HDD could be reduced to 1:2.3 according to the A1B scenario and 1:2.0 according to the A2 scenario, which leads us to the conclusion that climate change will alter the balance between the energy demands for cooling and heating. Compared to the present-day energy demand, much more energy will be required for cooling the buildings by the end of the 21st century. The sum of HDD and CDD (HDD+CDD) can be considered as an indicator of the total energy required for heating and cooling, although we have to be quite cautious with this assumption, because there is no general agreement in the scientific community on the definition of CDD for Serbia.
Relative to the reference period (1971–2000), the population weighted HDD+CDD averaged over Serbia will decrease by the end of the 21st century (2071–2100) up to 11.2% and 13.3% according to the A1B and A2 scenarios, respectively. Although this means a reduction in the total required energy for heating and cooling, the increased electricity demand for cooling will probably lead to higher costs, because electricity is more expensive than the central heating by natural gas, heating oil, or biomass(Jaglom et al., 2014).
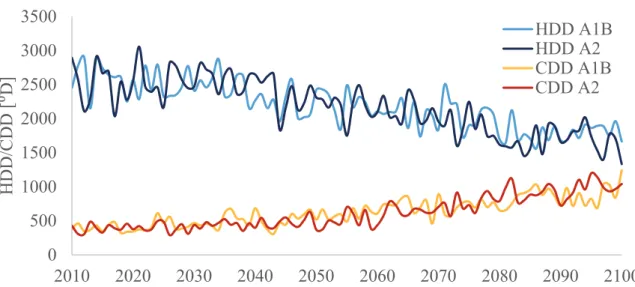
The temporal evolution of the population weighted HDD and CDD averaged over Serbia under the A1B and A2 scenarios are presented in Fig. 4.
Until 2035, no significant downward/upward trend in HDD / CDD is expected, respectively. More pronounced changes are expected during the second half of the 21st century, where the decrease in HDD is almost twice larger (–670 and – 915 °D according to the A1B and A2 scenarios, respectively) than the increase in CDD (385 and 565 °D according to A1B and A2 scenario, respectively).
During this period, an almost linear increase of CDD is expected by both scenarios (64 and 94 °D per decade according to the A1B and A2 scenarios, respectively), while HDD according to the A1B scenario is expected to stabilize after 2085 at ~1700 °D.
Fig. 4. Temporal evolution of the population weighted HDD and CDD averaged over Serbia in the 21st century (2011-2100) under the A1B and A2 scenarios.
Annual cycles of the population weighted HDD and CDD averaged over Serbia in the future compared to the reference period are shown in Fig. 5. The population weighted regional mean monthly values averaged for three future periods (2011–2040, 2041–2070, 2071–2100) under the A1B and A2 scenarios are compared with the corresponding values from the reference period (1971–
2000). According to both scenarios, transition from the reference period to the first future period (2011–2040) does not bring significant changes of HDD/CDD in the first six months, while in the later part of the year, the changes in these quantities are more pronounced. For the other two periods in the future (2041–
2070, 2071–2100), HDD reduction and CDD increase are expected in all months under both scenarios. Compared to the reference period, the peak of HDD in winter becomes less intensive in the future, while the peak of CDD in summer becomes more pronounced and sharpen, with this change being more prominent in the A2 scenario than in the A1B. Also there is a monthly shift, where the January at the end of the 21st century is more similar to the February at the end of the 20th century, February is like March, and so on. During the last future period (2071–2100), CDD becomes dominant over HDD in May, and the number of CDD in July exceeds the number of HDD in April by both scenarios. Although global warming is expected to reduce HDD and increase CDD, Serbia will remain the country where HDD dominates CDD, although this ratio will change considerably.
0 500 1000 1500 2000 2500 3000 3500
2010 2020 2030 2040 2050 2060 2070 2080 2090 2100
HDD/CDD [⁰D]
HDD A1B HDD A2 CDD A1B CDD A2
Fig. 5. Annual cycle of the population weighted HDD and CDD averaged over Serbia for the reference (1971–2000) and the future periods (2011–2040, 2041–2070, 2071–2100) according to the (a) A1B and (b) A2 scenario.
Regionally averaged length and temperature of the heating and cooling season of the four different considered periods are shown in Table 3. Both quantities are population weighted in order to more accurately reflect temperature-related energy demand at the country level. By the end of the 21st century, the reduction in the number of days of the heating season is somewhat less than 40 days according to the A1B scenario. A2 scenario projects even larger
0 100 200 300 400 500 600 700
HDD/CDD [⁰D]
HDD Model (1971-2000) HDD A1B (2011-2040) HDD A1B (2041-2070) HDD A1B (2071-2100) CDD Model (1971-2000) CDD A1B (2011-2040) CDD A1B (2041-2070) CDD A1B (2071-2100)
0 100 200 300 400 500 600 700
HDD/CDD [⁰D]
HDD Model (1971-2000) HDD A2 (2011-2040) HDD A2 (2041-2070) HDD A2 (2071-2100) CDD Model (1971-2000) CDD A2 (2011-2040) CDD A2 (2041-2070) CDD A2 (2071-2100)
reduction of about 50 days or 25.7% relative to the reference period (1971–2000).
Both scenarios projects an increase of the mean temperature of the heating season for about 2 °C. This could be a consequence of that the model expects almost the same temperature rise in winter (DJF) according to both scenarios (3.2–3.8 °C for A1B and 3.0–3.8 °C for A2 scenario) (Second National Communication of the Republic of Serbia under the United Nations Framework Convention on Climate Change, 2017). The cooling season extension is somewhat greater than the heating season shortening with a difference in the sign of a change. At the end of the 21st century, the cooling season length will be almost twice longer than at the end of the 20th century (44.7 and 51.8% relative change according to the A1B and A2 scenarios, respectively) According to both scenarios, the increase of the mean temperature of the cooling season is slightly lower than the increase of the mean temperature of the heating season. Considering the projected decrease of HDD, the temperature of the heating season, and its length, it is expected that the residential heating energy demand will decrease also on national and per capita levels. This assumption is even more probable according to the predicted decline in the population of Serbia (World Population Prospects, 2017) and the improvement of the energy efficiency of residential buildings (Novikova et. al., 2015). On the other hand, although the CDD, the mean temperature of the cooling season, and its length is projected to increase, we can not reasonably claim that the residential cooling energy demand will increase too on the national and per capita levels, because of the expected improvement of the energy efficiency of the residential buildings and population decline. A more accurate assessment can be made taking into account the demographic and economic factors, which will be the subject of the following research.
Table 3. Population weighted regional mean temperature and length of the heating and cooling season of the four different considered periods.
Period
Heating season Cooling season
Length [days] Temperature [°C] Length [days] Temperature [°C]
A1B A2 A1B A2 A1B A2 A1B A2
1971–2000 180 4.1 99 21.9
2011–2040 170 171 4.2 4.3 107 103 22.0 21.9
2041–2070 154 156 5.1 5.0 125 121 22.7 22.4
2071–2100 143 133 6.0 6.1 143 150 23.6 23.8
4. Conclusions and discussion
In this paper, future changes of HDD and CDD for Serbia are investigated using RCM EBU-POM under two different forcing scenarios (A1B and A2). Our main conclusions and findings can be summarized as follows:
(1) RCM has proven to produce spatial variability and annual cycles of HDD and CDD very well.
(2) A decrease of HDD is expected all over Serbia. It is expected that population weighted regional average of HDD will decrease from 2675 °D (1971–2000) to 1877 °D (2071–2100) under the A1B scenario. A2 scenario projects even larger reduction with regional average of 1743 °D.
The largest change is expected in southern (mountainous) Serbia with a reduction of more than 1000 °D. An increase of CDD is expected all over Serbia. It is expected that the population weighted regional average of CDD will increase from 365 °D (1971–2000) to 823 °D (2071–2100) under the A1B scenario. A2 scenario projects even larger increase with regional average of 894 °D. Unlike for HDD, the largest change of CDD is expected in northern (lowland) Serbia with an increase of more than 500 °D.
(3) By the end of the 21st century, the existing ratio between the population weighted HDD and CDD averaged over Serbia of 1:7.3 could be reduced to 1:2.3 according to the A1B scenario and 1:2.0 according to the A2 scenario. Although global warming is expected to reduce HDD and increase CDD, Serbia will remain the country where HDD dominates CDD, although this ratio will change considerably. Population weighted regional mean HDD+CDD will decrease by the end of the 21st century.
Until 2035, no significant downward/upward trend in population weighted regional mean HDD / CDD is expected, respectively. More pronounced changes are expected in the last two thirds of the 21st century, where the decrease in HDD is almost twice larger than the increase in CDD.
(4) Annual cycles of the population weighted HDD and CDD averaged over Serbia in the future (2041–2070, 2071–2100) compared to the reference period (1971–2000) shows HDD reduction and CDD increase in all months under both scenarios. During the last future period (2071–2100), CDD becomes dominant over HDD in May, and the number of CDD in July exceeds the number of HDD in April by both scenarios.
(5) The population weighted regional mean length of the cooling season will be twice longer at the end of the 21st century than at the end of the 20th century, while the population weighted regional mean length of the cooling season will be reduced by 25%. Both scenarios predict an increase of the population weighted regional mean temperature of heating and cooling season for a slightly less than 2 °C.
(6) The results of the research unambiguously show that at the end of the 21st century, the residential heating energy demand will be lower both at national and per capita levels. The expected improvement of the energy efficiency of residential buildings and decline of the population of Serbia contribute to this assumption. For the assessment of change in residential cooling energy demand at national and per capita levels, the influence of other factors should be taken into account (population decline, overall heat insulation quality of future residential buildings, floor area per capita, etc.)
This study provides high spatial resolution analysis over the territory of Serbia under the future climate change. The presented analysis should help the policy of energy management and planning in Serbia through the provided indications of future spatial and seasonal changes of HDD and CDD within Serbia. In light of the projected increase of CDD, the published results should encourage the necessity for introduction of legal frameworks and the energy classification of buildings based on the maximum allowable energy required for cooling. According to the current legislation in Serbia, the categorization is done on the basis of the maximum allowable annual final energy required for heating.
Future work will go in the direction of the direct assessment of energy demand for heating and cooling at national and per capita levels based on the characteristics of the building, the accumulated temperature difference, and other climatic factors.
References
Al-Hadhrami, L.M., 2013: Comprehensive review of cooling and heating degree days characteristics over Kingdom of Saudi Arabia. Renew. Sustain. Energ. Rev. 27, 305–314.
https://doi.org/10.1016/j.rser.2013.04.034
ASHRAE, 2005: Handbook – Fundamentals (SI). American Society of Heating, Refrigerating and Air- Conditioning Engineers, Atlanta.
Boermans, T. and Petersdorff, C., 2007: U-values for better energy performance of buildings.
Eurima/Ecofys, Brussels.
Christenson, M., Manz, H., and Gyalistras, D., 2006: Climate warming impact on degree-days and building energy demand in Switzerland. Energy Convers. Manage. 47, 671−686.
https://doi.org/10.1016/j.enconman.2005.06.009
Day, A.R. and Karayiannis, T.G., 1998: Degree-days: comparison of calculation methods. Build. Serv.
Engin. Res. Technol. 19, 1757–1764. https://doi.org/10.1177/014362449801900102
Djurdjevic, V. and Rajković, B., 2008: Verification of a coupled atmosphere–ocean model using satellite observations over the Adriatic Sea. Ann. Geophys. 26, 1935–1954.
https://doi.org/10.5194/angeo-26-1935-2008
Djurdjevic,V. and Rajković, B., 2010: Development of the EBU-POM Coupled Regional Climate Model and Results from Climate Change Experiments. In (Eds: Mihailović, D.T., Lalić, B.,) Advances in Environmental Modeling and Measurements. Nova Science, New York, 23–32.
European standard EN ISO 15927-6, 2007: Hygrothermal performance of buildings — Calculation and presentation of climatic data — Part 6: Accumulated temperature differences (degree-days).
European committee for standardization, Brussels.
Hitchen, E.R., 1981: Degree days in Britain. Building Serv. Engin. Res. Technol. 2, 73–82.
https://doi.org/10.1177/014362448100200202
Idchabania, R., Garouma, M., and Khaldounb, A., 2013: Analysis and mapping of the heating and cooling degree-days for Morocco at variable base temperatures. Int. J. Ambient Energ. 36, 190–198.
https://doi.org/10.1080/01430750.2013.842497
IPCC (Intergovernmental Panel on Climate Change), 2007: The physical science basis. In (eds:
Solomon, S., Qin, D., Manning, M., Chen, Z., Marquis, M., Averyt, K.B., Tignor, M., Miller, H.M.) Contribution of Working Group I to the Fourth Assessment Report of the Intergovernmental Panel on Climate Change. Cambridge University Press, Cambridge.
IPCC (Intergovernmental Panel on Climate Change), 2013: The physical science basis. In (eds:
Stocker, T.F., Qin, D., Plattner, G-K., Tignor, M., Allen, S.K., Boschung, J., Nauels, A., Xia, Y., Bex, V., Midgley, P.M.,) Contribution of Working Group I to the Fifth Assessment Report of the Intergovernmental Panel on Climate Change. Cambridge University Press, Cambridge.
Isaac, M. and van Vuuren, D.P., 2009: Modelling global residential sector energy demand for heating and air conditioning in the context of climate change. Energy Policy 37, 507−521.
https://doi.org/10.1016/j.enpol.2008.09.051
Jaglom, W.S., McFarland, J.R., Colley, M.F., Mack, C.B., Venkatesh, B., Miller, R.L., Juanita, H., Schultz, P.A., Perkins, B., Casola, J.H., Martinich, J.A., Cross, P., Kolian, M.J., and Kayin, S., 2014: Assessment of projected temperature impacts from climate change on the U.S. electric power sector using the Integrated Planning Model®. Energy Policy 73, 524–539.
https://doi.org/10.1016/j.enpol.2014.04.032
Krese, G., Matjaž, P., and Butala, V., 2011: Incorporation of latent loads into the cooling degree days concept. Energy Buildings 43, 507−521. https://doi.org/10.1016/j.enbuild.2011.03.042
Krzić, A., Tosić, I., Djurdjevic, V., and Rajković, B. 2012: Some indicators of the present and future climate of Serbia acording to the SRES-A1B scenario. In (eds: Berger A, Mesinger F, Šijački Đ) Climate Change. Springer-Verlag, Wien. https://doi.org/10.1007/978-3-7091-0973-1_17
Kržić, A., Tošić, I., Djurdjevic, V., Veljović, K., and Rajković, B., 2011: Changes in climate indices for Serbia according to the SRES-A1B and SRES-A2 scenarios. Climate Res. 49, 73–86.
https://doi.org/10.3354/cr01008
Lindelöf, D., 2017: Bayesian estimation of a building's base temperature for the calculation of heating degree-days. Energy Buildings 134, 154–161. https://doi.org/10.1016/j.enbuild.2016.10.038 Martinaitis, V., 1998: Analytic calculation of degree-days for the regulated heating season. Energy
Buildings 28, 185–189. https://doi.org/10.1016/S0378-7788(98)00015-2
Matzarakis, A. and Balafoutis, C., 2004: Heating degree days as an index of energy consumption.
Int.J. Climatol. 24, 1817–1828. https://doi.org/10.1002/joc.1107
Nakićenović, N. and Swart, R., 2000: Special report of the Intergovernmental Panel on Climate Change. Cambridge University Press, Cambridge.
National Renewable Energy Action Plan of the Republic of Serbia, 2013. Ministry of Energy, Development and Environmental Protection, Belgrade
Novikova, A., Csoknyai, T., Jovanović Popović, M., Stanković, B., Živković, B., Ignjatović, D., Sretenović, A., and Szalay, Z. 2015: The typology of the residential building stock in Serbia and modelling its low-carbon transformation. The Regional Environmental Center for Central and Eastern Europe (REC), Szentendre.
Petri, Y. and Caldeira, K., 2015: Impacts of global warming on residential heating and cooling degree- days in the United States. Sci. Rep. 5, 12427. https://doi.org/10.1038/srep12427
Piani, C., Haerter, J.O., and Coppola, E., 2010: Statistical bias correction for daily precipitation in regional climate models over Europe. Theor. Appl. Climatol. 99, 187–192.
https://doi.org/10.1007/s00704-009-0134-9
QGIS Development Team, 2014: QGIS Geographic Information System. Open Source Geospatial Foundation Project. https://qgis.org/
Quayle, R.G. and Diaz, H.F., 1980: Heating degree day data applied to residential heating energy consumption. J.Appl. Meteorol. 19, 241–246.
https://doi.org/10.1175/1520-0450(1980)019<0241:HDDDAT>2.0.CO;2
Raisanen, J. and Raty, O., 2013: Projections of daily mean temperature variability in the future: cross- validation tests with ENSEM- BLES regional climate simulations. Climate Dynam. 41, 1553–
1568. https://doi.org/10.1007/s00382-012-1515-9
Roeckner, E., Bäuml, G., Bonaventura, L., Brokopf, R., Esch, M., Giorgetta, M., Hagemann, S., Kornblueh, L., Schlese, U., Schulzweida, U., Kirchner, I., Manzini, E., Rhodin, A., and Tompkins, A., 2003: The atmospheric general circulation model ECHAM5. Part I: model description. Report 349. Max-Planck-Institute, Hamburg.
Rule Book on energy efficiency of buildings, 2011. Ministry of Energy, Development and Environmental Protection, Belgrade.
Ruml M., Vukovć A., Vujadinović M., Djurdjevic V., Ranković-Vasić Z., Atancaković Z., Sivčev B., Marković N., Matijašević S., and Petrović N., 2012: On the use of regional climate models:
Implications of climate change for viticulture in Serbia, Agricult. Forest Meteorol. 158, 53–62.
https://doi.org/10.1016/j.agrformet.2012.02.004
Second National Communication of the Republic of Serbia under the United Nations Framework Convention on Climate Change, 2017. Ministry of Environmental Protection, Belgrade.
Shen, X. and Binhui, L., 2016: Changes in the timing, length and heating degree days of the heating season in central heating zone of China. Scientific Rep. 6, 33384.
https://doi.org/10.1038/srep33384
Shi, Y., Gao, X., Xu, Y., Giorgi, F., and Chen, D., 2016: Effects of climate change on heating and cooling degree days and potential energy demand in the household sector of China. Climate Res.
67, 135–149. https://doi.org/10.3354/cr01360
Smailagić, J., Savović, A., Marković, D., and Nešić, D., 2013: Climate characteristics of Serbia.
Republic Hydrometeorological Service of Serbia, Belgrade.
Spinoni, J., Vogt, J.V., Barbosa, P., Dosio, A., McCormick, N., Biganob, A., and Füssele, H-M., 2018:
Changes of heating and cooling degree-days in Europe from 1981 to 2100. Int. J. Climatol. 38, e191-e208. https://doi.org/10.1002/joc.5362
U.S. Geological Survey, 2017: https://earthexplorer.usgs.gov/ (accessed 7 December 2017).
United Nations, Department of Economic and Social Affairs, Population Division, 2017: World Population Prospects: The 2017 Revision, Key Findings and Advance Tables. Working Paper No. ESA/P/WP/248.
Vizi, L., Hlasny, T., Farda, A., Štepanek, P., Skalak, P., and Siktova, Z., 2011: Geostatistical modeling of high resolution climate change scenario data. Időjárás 115, 71–85.
Živković, B. and Novoselec, A., 1998: Kriterijumi za izračunavanje broja stepen dana. KGH – Klimatizacija, grejanje, hlađenje 4, 45-48. ( In Serbian)