RESEARCH ARTICLE
Exercise and Cardiac Remodeling in Normal and Athletic States
Geometrical remodeling of the mitral and tricuspid annuli in response to exercise training: a 3-D echocardiographic study in elite athletes
Alexandra Fábián,1* Bálint Károly Lakatos,1* Márton Tokodi,1Anna Reka Kiss,1Nora Sydo,1,2 Emese Csulak,1Erika Kispál,1Máte Babity,1Andrea Szu†cs,1Orsolya Kiss,1,2Bela Merkely,1,2* and
Attila Kovács1*
1Semmelweis University Heart and Vascular Center, Budapest, Hungary and2Department of Sports Medicine, Semmelweis University, Budapest, Hungary
Abstract
Intense exercise exposes the heart to significant hemodynamic demands, resulting in adaptive changes in cardiac morphology and function. Nevertheless, the athletic adaptation of the atrioventricular valves remains to be elucidated. Our study aimed to character- ize the geometry of mitral (MA) and tricuspid (TA) annuli in elite athletes using 3-D echocardiography. Thirty-four athletes presented with functional mitral regurgitation (FMR) were retrospectively identified and compared with 34 athletes without mitral regurgitation (MR) and 34 healthy, sedentary volunteers. 3-D echocardiographic datasets were used to quantify MA and TA geometry and leaflet tenting by dedicated softwares. MA and TA areas, as well as tenting volumes, were higher in athletes compared with controls. MA area was significantly higher in athletes with MR compared with those without (8.2 ± 1.0 vs. 7.2 ± 1.0 cm2/m2,P<0.05). Interestingly, athletes with MR also presented with a significantly higher TA area (7.2 ± 1.1 vs. 6.5 ± 1.1 cm2/m2,P< 0.05). Nonplanar angle describ- ing the MA’s saddle shape was less obtuse in athletes without MR, whereas the values of athletes with MR were comparable with controls. The exercise-induced relative increases in left ventricular (35 ± 25%) and left atrial (40 ± 29%) volumes were similar; however, the increment in the MA area was disproportionately higher (63 ± 23%, overallP<0.001). The relative increase in TA area (40 ± 23%) was also higher compared with the increment in right ventricular volume (34 ± 25%,P<0.05). Atrioventricular annuli undergo a dis- proportionate remodeling in response to regular exercise. Athletic adaptation is characterized by both annular enlargement and increased leaflet tenting of both valves. There are differences in MA geometry in athletes presented with versus without FMR.
NEW & NOTEWORTHYWe have characterized the annular geometry of mitral and tricuspid valves in elite athletes using 3-D echo- cardiography. We have found that exercise-induced remodeling of the atrioventricular annuli comprises a disproportionate dilation of annular dimensions and increased leaflet tenting of both valves. Moreover, we have demonstrated a more pronounced saddle shape of the mitral annulus in athletes without mitral regurgitation, which was not present in those who had mild regurgitation.
3-D echocardiography; athlete’s heart; functional mitral regurgitation; mitral annulus; tricuspid annulus
INTRODUCTION
Regular, intense physical exercise results in complex adaptive changes in the morphology and function of the heart (1). Nevertheless, the vast majority of data are related to the ventricles and the atria (2). A balanced dilation of the cardiac chambers is a characteristic and unequivocal feature of an athlete’s heart. Although ventricular and atrial dilation can significantly affect atrioventricular annular geometry and related valvular competency in various pathological states, less is known about the exercise-induced alterations in the shape and function of the mitral and tricuspid annuli in elite athletes (3).
Primary valvular heart diseases show the same prevalence in athletes than in the general population (4). However, mitral and tricuspid insufficiency is reported more frequently among athletes, suggesting predominantly secondary (functional) ori- gin (5). The classical ventricular type of functional regurgita- tion is mainly characterized by increased leaflet tenting, whereas a notably enlarged annulus rather refers to atrial functional regurgitation (3). The athlete’s heart shares several features of both types of functional regurgitation: pronounced ventricular and atrial dilation may even exaggerate their impact on annular geometry and valvular function. Thus, a mixed type of functional regurgitation can be assumed in ath- letes presented with mitral or tricuspid insufficiency.
* A. Fábián, A. Kovács, B. K. Lakatos, and B. Merkely contributed equally to this work.
Correspondence: A. Kovács (attila.kovacs@med.semmelweis-univ.hu).
Submitted 29 October 2020 / Revised 29 January 2021 / Accepted 26 February 2021
mitral and tricuspid annuli in elite athletes compared with healthy, sedentary volunteers using three-dimensional (3-D) echocardiography. We hypothesized that atrioventricular annuli undergo a disproportionate remodeling in contrast to cardiac chambers, and there is a difference in the mitral an- nular geometry between athletes presented with versus with- out mitral regurgitation.
METHODS
As part of our Center’s complex sports cardiology screen- ing program, we retrospectively identified healthy athletes with 3-D transthoracic echocardiographic datasets avail- able for detailed analysis of the left and right hearts. Using this cohort, we have selected those athletes who presented with at least mild mitral regurgitation (MR). Exclusion cri- teria were1) presence of any primary cause for MR revealed at thefirst report or during the review process of the previ- ously acquired datasets (including prolapse, billowing, cleft, etc.),2) suboptimal 3-D dataset image quality for the analysis of the annuli, and3) noncompatible image source, as tricuspid annular (TA) quantification is available only by a single vendor. An additional age-matched cohort of athletes was selected from our database with the same sex distribution but no mitral regurgitation. An age-matched healthy, sedentary population (<3 h of exercise/wk) with the same sex distribution served as the control group hav- ing neither MR nor tricuspid regurgitation (TR). Detailed medical history and training regime were obtained along with a standard physical examination and 12-lead ECG.
Two-dimensional (2-D) and 3-D echocardiography and then cardiopulmonary exercise testing (CPET) were per- formed on all athletes on the same day. All participants provided written, informed consent to study procedures.
Our study is in accordance with the Declaration of Helsinki and approved by the Medical Research Council (ETT- TUKEB No. 13687-0/2011-EKU).
Cardiopulmonary Exercise Testing
CPET for peak oxygen uptake (V_O2and V_O2/kg) quantifi- cation was performed on a treadmill until the exhaustion of the athletes. The volume and composition of the expired gases were analyzed breath by breath using an automated cardiopulmonary exercise system (Respiratory Ergostik, Geratherm, Bad Kissingen, Germany). Subjects were encouraged to achieve maximal effort, which was confirmed by respiratory exchange ratio, by lactate curves by regular fingertip lactate measurements every 2 min during the test, and by reaching the predicted maximal heart rate and a plateau in V_O2.
2-D and 3-D Echocardiography
Transthoracic echocardiographic examinations were per- formed on a commercially available ultrasound system (E95, 4Vc-D probe, GE Vingmed Ultrasound, Horten, Norway). A standard acquisition protocol consisting of 2-D loops from parasternal, apical, and subxiphoid views was applied.
Beyond conventional echocardiographic examination, ECG- gated full-volume 3-D datasets reconstructed from four
obtained for further analysis on a separate workstation (Fig.
1). Left ventricular (LV) internal diameters and wall thick- nesses; left atrial (LA) 2-D end-systolic volume; mitral inflow velocities andEwave deceleration time; systolic (s0), early di- astolic (e0), and atrial (a0) velocities of the mitral lateral and septal annulus; average E/e0; right ventricular (RV) basal short-axis diameter, tricuspid annular plane systolic excur- sion (TAPSE), fractional area change (FAC), and TA veloc- ities; and right atrial (RA) 2-D end-systolic volume were measured according to current guidelines (6).
MR was graded based on the measurement of vena con- tracta width (VCW), preferably on zoomed color parasternal long-axis view loops at the narrowest portion of the regurgi- tation jet as it emerges beyond the orifice. Mild MR was defined as having a measurable vena contracta but with a width of <0.3 cm as per current guidelines (7). “Non-MR” was defined as an absolutely not or just barely detectable jet, noflow convergence, and not having measurable vena con- tracta with a faint, incomplete, or no continuous-wave Doppler signal. Similarly, TR grading was based on meas- uring the VCW. TR jet was established either on apical four- chamber or in parasternal right ventricular (RV) inflow views. Mild TR was defined as a small jet but with measura- ble VCW (<0.3 cm). Lack of TR was defined as an absolutely not or just barely detectable jet, no flow convergence, and not having measurable VCW with a faint, incomplete, or no continuous-wave Doppler signal.
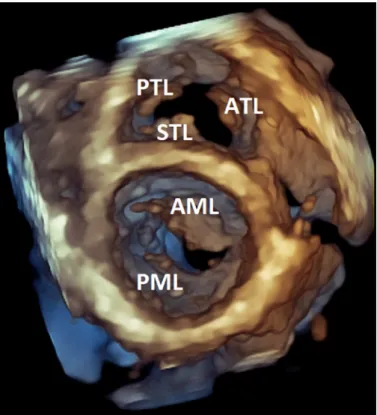
Figure 1.Representative volume-rendered three-dimensional (3-D) trans- thoracic echocardiographic image of an athlete’s heart (diastolic frame).
Using an apical perspective, anterior mitral valve leaflet (AML), posterior mi- tral valve leaflet (PML), septal tricuspid valve leaflet (STL), posterior tricuspid valve leaflet (PTL), and anterior tricuspid valve leaflet (ATL) are visible. The generally excellent transthoracic windows of athletes represented the basis for our advanced mitral and tricuspid valve measurements.
3-D datasets focused on the left heart were processed using semiautomated, commercially available softwares (4D LV-Analysis 3, TomTec Imaging, Unterschleissheim, Germany, and EchoPAC v204, 4D Auto LAQ, GE). We deter- mined LV end-diastolic volume index (EDVi), end-systolic volume index (ESVi), stroke volume index (SVi), and LV mass index (LV Mi). To assess global LV function, ejection fraction (EF), global longitudinal strain (GLS), and global cir- cumferential strain (GCS) were also calculated. Concerning the 3-D quantification of the LA, we measured maximal (LAVmax) and minimal (LAVmin) volumes and the volume at the onset of atrial contraction (LAVpreA). Using these volu- metric data, we calculated LA total emptying fraction as 100(LAVmax–LAVmin)/LAVmax, LA passive emptying frac- tion as 100 (LAVmax – LAVpreA)/LAVmax, and LA active emptying fraction as 100 (LAVpreA–LAVmin)/LAVpreA, as parameters of LA reservoir, conduit, and contractile func- tion, respectively. The analysis of the 3-D datasets focused on the right heart was performed using 4D RV-Function 2 software (TomTec Imaging). We quantified 3-D RV EDVi, ESVi, and SVi, EF, and septal and free wall two-dimensional (2-D) longitudinal strain as well. Concerning the 3-D quanti- fication of the RA, we used the same software as for the LA (EchoPAC v204, 4D Auto LAQ, GE) due to the lack of dedi- cated RA software package. Similarly, we measured maximal (RAVmax) and minimal (RAVmin) volumes and the volume at the onset of atrial contraction (RAVpreA). Using these volu- metric data, we calculated RA total emptying fraction as 100 (RAVmax – RAVmin)/RAVmax, RA passive emptying fraction as 100(RAVmax–RAVpreA)/RAVmax, and RA active emptying fraction as 100(RAVpreA–RAVmin)/RAVpreA, as parameters of RA reservoir, conduit, and contractile func- tion, respectively.
3-D Quantification of Mitral and Tricuspid Annuli
Mitral annulus (MA) was quantified by a commercially available software (EchoPAC v204, 4D Auto MVQ, GE) previ- ously validated against other mitral valve quantification soft- wares and also against transesophageal image acquisition and subsequent analysis (8). First, the automatic selection of end- diastolic and end-systolic time points was confirmed by visual assessment of cardiac cycle events. Then, the orientation of the 3-D dataset was aligned to conform with prespecified standard views. A midsystolic reference frame was automati- cally selected, which was subsequently used to report static parameters. Six anatomical landmark points were placed using the two standard orthogonal planes (commissural and long-axis views), and then, the software created the 3-D model of the mitral valve annulus and leaflets. If needed, model con- tours could be modified manually throughout the cardiac cycle. Reported MA and leaflet parameters are as follows (also presented graphically onFig. 2): 3-D MA area, 2-D MA area (projected 2-D area at the level of the best-fit plane), MA pe- rimeter, MA anteroposterior diameter, MA posteromedial-an- terolateral diameter, commissural diameter, intertrigonal distance, MA sphericity index (the ratio between anteroposte- rior and posteromedial-anterolateral diameters), MA height, MA nonplanar angle (describing the MA saddle shape), annu- lus height to commissural width ratio (ACHWR, describing the MA saddle shape), MA systolic excursion, MA maximal
systolic velocity, MA area fraction, mitral-aortic angle, ante- rior and posterior leaflet lengths, areas, angles, tenting height, area, and volume.
TA was quantified by commercially available software (EchoPAC v204, 4-D Auto TVQ, GE). First, the automatic selection of end-diastolic and end-systolic time points was confirmed by visual assessment of cardiac cycle events.
Then, the orientation of the 3-D dataset was aligned by the placement of tricuspid valve center point and adjusting RV long-axis to conform with prespecified standard views. A midsystolic reference frame was automatically selected, which was subsequently used to report static parameters.
Five anatomical landmark points were placed using the two standard orthogonal planes (4-chamber and RV 2-chamber views), and then, the software created the 3-D model of the tricuspid valve annulus and leaflets. If needed, model con- tours could be modified manually throughout the cardiac cycle. Reported TA and leaflet parameters are as follows (also presented graphically onFig. 3): 3-D TA area, 2-D TA area (projected 2-D area at the level of the best-fit plane), TA area fraction, TA perimeter, TA diameter on four- chamber view, TA diameter on two-chamber view, TA major and minor axes, sphericity index (the ratio between four-chamber view and two-chamber view diameters), TA systolic excursion, maximal tenting height, and tenting volume.
Parameters were normalized to body surface area (BSA) calculated by the Mosteller formula (9).
Statistical Analysis
Statistical analysis was performed using dedicated soft- ware (StatSoft Statistica, v. 12, Tulsa, OK). Continuous varia- bles are presented as means ± SD, whereas categorical variables are reported as frequencies and percentages.
Concerning LV EDVi, LAVimax, 3D MA area, RV EDVi, RAVimax, and 3-D TA area indices, individual values of ath- letes were normalized to the mean value of the control group to calculate their relative increase. After verifying the normal distribution of each variable using the Shapiro–Wilk test, athlete groups were compared with unpaired Student’sttest or Mann–Whitney Utest for continuous variables and chi- square or Fisher’s exact test for categorical variables, as appropriate. Multiple-group comparisons were performed using ANOVA (with Fisher’s post hoc test) or the Kruskal– Wallis test (with Dunn’s post hoc test). The relative increase in the aforementioned parameters was compared using one- way repeated-measures ANOVA (with Fisher’s post hoc test).
The Pearson or Spearman test was computed to assess the correlation between continuous variables. Multivariate lin- ear regression analysis was performed in athletes to find independent determinants of MA and TA 3-D area index. To avoid multicollinearity, tolerance was set at >0.4. A two- sidedPvalue of<0.05 was considered as statistically signifi- cant. The intra- and interobserver variabilities were eval- uated by intraclass correlation coefficient (ICC) values. To assess the intraobserver reproducibility of the presented key parameters, the experiencedfirst operator (A.F.) of the off- line measurements repeated the 3-D analysis in a randomly selected subset of 5-5-5 subjects from each group blinded to previous results. The interobserver variability was deter-
mined by 3-D analysis of the same subjects by a second expe- rienced operator (A.K.) in a blinded fashion.
RESULTS
Four hundred and twenty-five healthy athletes were iden- tified with a previous echocardiographic examination with both left heart- and right heart-focused 3-D datasets. From this cohort, 42 (9.9%) athletes presented with at least mild MR. Eight athletes were excluded due to either suboptimal image quality for MA quantification (n= 6) or noncompatible image source vendor (n= 2). Thus, 34 athletes (male/female:
26/8) formed thefinal study population (MR athlete group).
Furthermore, 34 age-matched athletes (non-MR athlete
group) and 34 healthy, sedentary individuals (control group) with the same sex distribution (male/female: 26/8) were selected from our database (Fig. 4;Table 1).
Basic anthropometric, hemodynamic, and training spe- cific data of the study groups are summarized inTable 1. Our athlete populations consisted of mixed or endurance-trained individuals, predominantly soccer players (28%), water polo players (28%), and swimmers (25%). Athletes had a higher height, weight, and lower resting heart rate than the seden- tary control group. Athletes without MR demonstrated sig- nificantly higher systolic blood pressure compared with the other two groups. Athletes have been participating in com- petitive sports for an average of 15 years; at the time of the echocardiographic investigation, they trained an average of Figure 2.Graphical representation of the three-dimensional (3-D) echocardiography-derived measurements concerning the mitral valve.A: annulus 3-D area. The yellow surface represents the adjusted 3-D area of the mitral annulus.B:
annulus two-dimensional (2-D) area. The yellow surface rep- resents the projected area at the level of best-fit plane of the mitral annulus.C: annulus perimeter. The yellow line represents the circumference of the mitral annulus.D: ante- roposterior diameter. The yellow line represents the dis- tance between the anterior and posterior reference points of the mitral annulus.E: posteromedial-anterolateral diame- ter. The yellow line represents the longest distance between the posteromedial and the anterolateral reference points of the mitral annulus.F: commissural diameter. The yellow line represents the distance between the annular points at the level of the commissures.G: intertrigonal dis- tance. The yellow line represents the distance between the points at which the anterior leaflet attached to thefibrous skeleton of the heart between trigones.H: annulus height.
The yellow line represents the distance between the high- est point and the lowest point of the mitral annulus.I: non- planar angle. The angle enclosed by the two yellow lines is used to calculate the nonplanar angle that describes the saddle shape of the mitral annulus. J: mitral-aortic angle.
The angle enclosed by the two yellow lines (axes of aortic and mitral annuli) is used to calculate the mitral-aortic angle.
K: anterior leaflet area. The yellow surface represents the area of the anterior mitral valve leaflet.L: posterior leaflet area. The yellow surface represents the area of the poste- rior mitral valve leaflet.M: anterior leaflet length. The yellow line represents the central contour line from which leaflet length is calculated.N: posterior leaflet length. The yellow line represents the central contour line from which leaflet length is calculated. O: anterior leaflet angle. The angle enclosed by the two yellow lines is used to calculate the an- terior mitral valve leaflet angle.P: posterior leaflet angle.
The angle enclosed by the two yellow lines is used to calcu- late the posterior mitral valve leaflet angle.Q: tenting height.
The highlighted yellow line shows the central maximal dis- tance between the mitral annular plane and the leaflet coap- tation point.R: tenting area. The highlighted yellow surface shows the maximal area between the mitral annular antero- posterior axis and the central leaflet coaptation point.S:
tenting volume. The yellow surface represents the volume enclosed between the mitral annulus and the mitral valve leaflets.
17 h/wk. BSA, heart rate, competitive years, weekly training hours, and CPET-derived peak exercise capacity did not dif- fer between the two athlete groups (Table 1).
Conventional 2-D and 3-D echocardiographic parameters are shown inTable 2. As expected, there were significant dif- ferences between the athlete groups and the control group concerning LV and RV morphological and functional param- eters. LV and RV EDVi and ESVi were significantly higher in the athletes compared with controls; on the other hand, these did not differ between the MR and non-MR athlete groups. LV Mi, LV SVi, and RV SVi values were the highest in the athlete group with MR compared with non-MR and con- trol groups. LV EF, GLS, GCS, RV FAC, and RV EF showed significantly decreased resting values in the athletic groups than controls. Notably, LV GLS was higher in the MR athlete group compared with the non-MR group. TAPSE and RV sep- tal and free wall longitudinal strain did not differ between groups. 3-D LA and RA maximal volume indices were higher among athletes with MR, even compared with non-MR ath- letes. In terms of LA reservoir and contractile function, there was no difference between the groups; however, LA passive EF referring to conduit function was significantly lower in the MR athlete group compared with controls. Although RA contractile function was similar, athlete groups presented with lower RA reservoir and conduit function. Moreover, RA total emptying fraction was significantly lower in the MR athlete group compared with non-MR athletes. Concerning diastolic function, there was no difference in either mitral inflow velocities or early diastolic mitral annular velocities between our study groups. In contrast, late diastolic annu- lar velocities (a0) were lower in athletes than in controls (Table 2).
In the MR athlete group, all individuals presented with mild MR, and no moderate regurgitation was established (VCW: 0.22 ± 0.07 cm). Interestingly, 74% of athletes with MR
also had mild TR (VCW: 0.19 ± 0.07 cm). In the non-MR group, 9% of athletes presented with mild TR (VCW: 0.12 ± 0.04 cm).
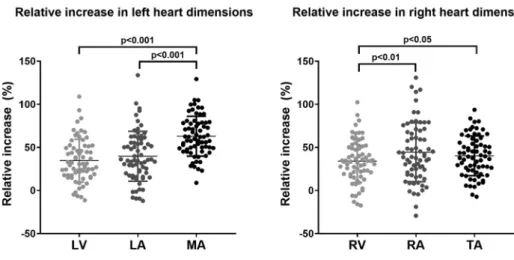
We have compared the exercise-induced relative dilation of the LV, the LA, and the MA in the overall athlete cohort.
Although the relative increase in LV EDVi and LAVimaxwas comparable, the MA 3-D area index’s increment was dispro- portionately higher, with an average enlargement of over 60%. Concerning the right heart, the relative increase in the 3-D TA area index was significantly higher than in RVEDVi but showed no difference compared with RAVimax. The in- crement in RAVimaxwas higher compared with RVEDVi (Fig.
5). We investigated the relative geometrical changes in female athletes (n= 16) separately and found that the incre- ment in LAVimax (46 ± 33%) was significantly higher com- pared with LVEDVi (32 ± 21%) but was still lower than MA 3- D area index (61 ± 30%, overallP < 0.001). In terms of the right heart, the increment in TA 3-D area index (35 ± 25%) was similar to RVEDVi (35 ± 25%), but both were lower com- pared with RAVimax(49 ± 45%, overallP<0.001).
The three groups differed significantly from each other with regard to all of the parameters (3-D and 2-D area indi- ces, perimeter, anteroposterior, posteromedial-anterolateral, commissural diameters, intertrigonal distance) describing the size of the MA, as athletes having MR had significantly higher values even compared with athletes without MR (Table 3; Fig. 6). The athlete groups had higher annulus height and less obtuse mitral-aortic angle. Athletes without MR had a more pronounced MA saddle shape, as suggested by the significantly less obtuse nonplanar angle and higher annulus height to commissural width ratio (AHCWR,Fig. 6).
Interestingly, athletes with MR were rather similar in this regard to sedentary controls. Sphericity, annular excursion, and MA area fraction did not differ between the athlete groups. Anterior leaflet length and area were significantly Figure 3.Graphical representation of the three-dimensional
(3-D) echocardiography-derived measurements concerning the tricuspid valve.A: annulus 3-D area. The yellow surface represents the adjusted 3-D area of the tricuspid annulus.B:
annulus two-dimensional (2-D) area. The yellow surface rep- resents the projected area at the level of best-fit plane of the tricuspid annulus.C: annulus perimeter. The yellow line represents the circumference of the tricuspid annulus.D: 4- chamber diameter: The yellow line shows the distance between the free wall and the septal reference points.E:
two-chamber diameter: The yellow line shows the distance between the anterior and the posterior reference points.F:
major axis. The yellow line shows the maximal diameter of the tricuspid annulus.G: minor axis. The yellow line shows the minimal diameter of the tricuspid annulus.H: coaptation point height. The highlighted line represents the distance between the distal coaptation point of the tricuspid valve leaflets and the annular plane.I: max tenting height. The highlighted line represents the distance between the proxi- mal coaptation point (tenting point) of the tricuspid valve leaflets and the annular plane.J: tenting volume. The yellow surface represents the volume enclosed between the tricus- pid annulus and the tricuspid valve leaflets.
higher in the MR athletes even compared with non-MR ath- letes; however, posterior leaflet length and area did not show a difference between the two athlete groups. The anterior leaflet angle was significantly lower in the MR athlete group compared with non-MR athletes. Tenting height, area, and
volume indices were higher in both athlete groups compared with the control group (Table 3;Fig. 6).
Interestingly, athletes with MR had also significantly enlarged TA, as shown by 3-D and 2-D area indices, four- chamber view diameters, and minor axis diameters compared
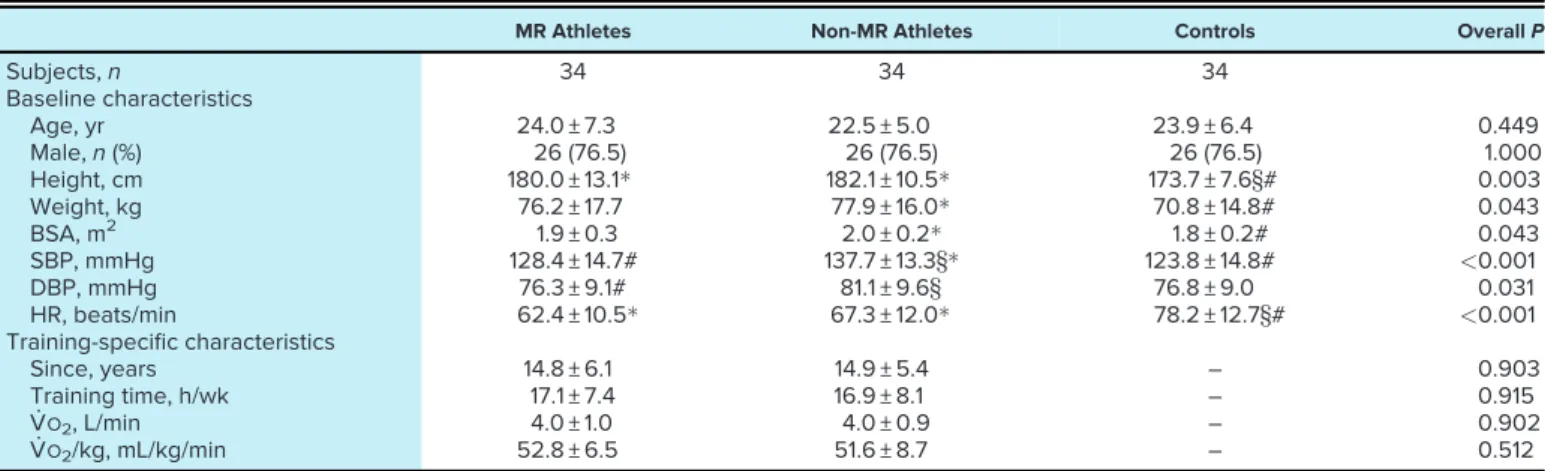
Table 1. Baseline and training-specific characteristics of athlete and control groups
MR Athletes Non-MR Athletes Controls OverallP
Subjects,n 34 34 34
Baseline characteristics
Age, yr 24.0 ± 7.3 22.5 ± 5.0 23.9 ± 6.4 0.449
Male,n(%) 26 (76.5) 26 (76.5) 26 (76.5) 1.000
Height, cm 180.0 ± 13.1 182.1 ± 10.5 173.7 ± 7.6§# 0.003
Weight, kg 76.2 ± 17.7 77.9 ± 16.0 70.8 ± 14.8# 0.043
BSA, m2 1.9 ± 0.3 2.0 ± 0.2 1.8 ± 0.2# 0.043
SBP, mmHg 128.4 ± 14.7# 137.7 ± 13.3§ 123.8 ± 14.8# <0.001
DBP, mmHg 76.3 ± 9.1# 81.1 ± 9.6§ 76.8 ± 9.0 0.031
HR, beats/min 62.4 ± 10.5 67.3 ± 12.0 78.2 ± 12.7§# <0.001
Training-specific characteristics
Since, years 14.8 ± 6.1 14.9 ± 5.4 – 0.903
Training time, h/wk 17.1 ± 7.4 16.9 ± 8.1 – 0.915
V_O2, L/min 4.0 ± 1.0 4.0 ± 0.9 – 0.902
V_O2/kg, mL/kg/min 52.8 ± 6.5 51.6 ± 8.7 – 0.512
Continuous variables are means ± SD; categorical variables are reported as frequencies (%).P<0.05 vs. controls, #P<0.05 vs. non- MR athletes,§P<0.05 vs. MR athletes. BSA, body surface area; DBP, diastolic blood pressure; HR, heart rate; MR, mitral regurgitation;
SBP, systolic blood pressure; V_O2, peak oxygen uptake; V_O2/kg, peak oxygen uptake indexed to body weight.
425 elite athleteswith D echocardiography 3
retrospecvely idenfied
42 athletespresented with
≥mild funconal MR
34 athletesincluded in the final study populaon:
“MR ATHLETE”group
athletes
8 excludeddue to
34age- and sex matched healthy, sedentaryvolunteers
without mitral and tricuspid regurgitaon:
“CONTROL”group 34age- and sex matched
athletes without mitral regurgitaon:
“NON-MR ATHLETE”group
● non-compable image source vendor (n=2)
● subopmal image quality (n=6)
Figure 4.Flowchart for the identification of the study groups. MR, mitral regurgitation.
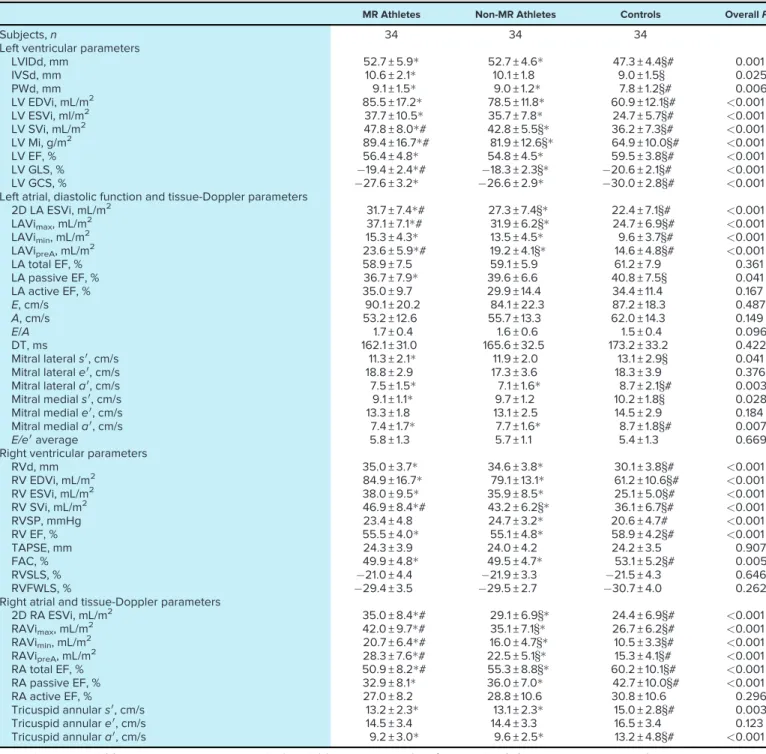
Table 2. Conventional 2-D and 3-D echocardiographic parameters of athlete and control groups
MR Athletes Non-MR Athletes Controls OverallP
Subjects,n 34 34 34
Left ventricular parameters
LVIDd, mm 52.7 ± 5.9 52.7 ± 4.6 47.3 ± 4.4§# 0.001
IVSd, mm 10.6 ± 2.1 10.1 ± 1.8 9.0 ± 1.5§ 0.025
PWd, mm 9.1 ± 1.5 9.0 ± 1.2 7.8 ± 1.2§# 0.006
LV EDVi, mL/m2 85.5 ± 17.2 78.5 ± 11.8 60.9 ± 12.1§# <0.001
LV ESVi, ml/m2 37.7 ± 10.5 35.7 ± 7.8 24.7 ± 5.7§# <0.001
LV SVi, mL/m2 47.8 ± 8.0# 42.8 ± 5.5§ 36.2 ± 7.3§# <0.001
LV Mi, g/m2 89.4 ± 16.7# 81.9 ± 12.6§ 64.9 ± 10.0§# <0.001
LV EF, % 56.4 ± 4.8 54.8 ± 4.5 59.5 ± 3.8§# <0.001
LV GLS, % 19.4 ± 2.4# 18.3 ± 2.3§ 20.6 ± 2.1§# <0.001
LV GCS, % 27.6 ± 3.2 26.6 ± 2.9 30.0 ± 2.8§# <0.001
Left atrial, diastolic function and tissue-Doppler parameters
2D LA ESVi, mL/m2 31.7 ± 7.4# 27.3 ± 7.4§ 22.4 ± 7.1§# <0.001
LAVimax, mL/m2 37.1 ± 7.1# 31.9 ± 6.2§ 24.7 ± 6.9§# <0.001
LAVimin, mL/m2 15.3 ± 4.3 13.5 ± 4.5 9.6 ± 3.7§# <0.001
LAVipreA, mL/m2 23.6 ± 5.9# 19.2 ± 4.1§ 14.6 ± 4.8§# <0.001
LA total EF, % 58.9 ± 7.5 59.1 ± 5.9 61.2 ± 7.9 0.361
LA passive EF, % 36.7 ± 7.9 39.6 ± 6.6 40.8 ± 7.5§ 0.041
LA active EF, % 35.0 ± 9.7 29.9 ± 14.4 34.4 ± 11.4 0.167
E, cm/s 90.1 ± 20.2 84.1 ± 22.3 87.2 ± 18.3 0.487
A, cm/s 53.2 ± 12.6 55.7 ± 13.3 62.0 ± 14.3 0.149
E/A 1.7 ± 0.4 1.6 ± 0.6 1.5 ± 0.4 0.096
DT, ms 162.1 ± 31.0 165.6 ± 32.5 173.2 ± 33.2 0.422
Mitral laterals0, cm/s 11.3 ± 2.1 11.9 ± 2.0 13.1 ± 2.9§ 0.041
Mitral laterale0, cm/s 18.8 ± 2.9 17.3 ± 3.6 18.3 ± 3.9 0.376
Mitral laterala0, cm/s 7.5 ± 1.5 7.1 ± 1.6 8.7 ± 2.1§# 0.003
Mitral medials0, cm/s 9.1 ± 1.1 9.7 ± 1.2 10.2 ± 1.8§ 0.028
Mitral mediale0, cm/s 13.3 ± 1.8 13.1 ± 2.5 14.5 ± 2.9 0.184
Mitral mediala0, cm/s 7.4 ± 1.7 7.7 ± 1.6 8.7 ± 1.8§# 0.007
E/e0average 5.8 ± 1.3 5.7 ± 1.1 5.4 ± 1.3 0.669
Right ventricular parameters
RVd, mm 35.0 ± 3.7 34.6 ± 3.8 30.1 ± 3.8§# <0.001
RV EDVi, mL/m2 84.9 ± 16.7 79.1 ± 13.1 61.2 ± 10.6§# <0.001
RV ESVi, mL/m2 38.0 ± 9.5 35.9 ± 8.5 25.1 ± 5.0§# <0.001
RV SVi, mL/m2 46.9 ± 8.4# 43.2 ± 6.2§ 36.1 ± 6.7§# <0.001
RVSP, mmHg 23.4 ± 4.8 24.7 ± 3.2 20.6 ± 4.7# <0.001
RV EF, % 55.5 ± 4.0 55.1 ± 4.8 58.9 ± 4.2§# <0.001
TAPSE, mm 24.3 ± 3.9 24.0 ± 4.2 24.2 ± 3.5 0.907
FAC, % 49.9 ± 4.8 49.5 ± 4.7 53.1 ± 5.2§# 0.005
RVSLS, % 21.0 ± 4.4 21.9 ± 3.3 21.5 ± 4.3 0.646
RVFWLS, % 29.4 ± 3.5 29.5 ± 2.7 30.7 ± 4.0 0.262
Right atrial and tissue-Doppler parameters
2D RA ESVi, mL/m2 35.0 ± 8.4# 29.1 ± 6.9§ 24.4 ± 6.9§# <0.001
RAVimax, mL/m2 42.0 ± 9.7# 35.1 ± 7.1§ 26.7 ± 6.2§# <0.001
RAVimin, mL/m2 20.7 ± 6.4# 16.0 ± 4.7§ 10.5 ± 3.3§# <0.001
RAVipreA, mL/m2 28.3 ± 7.6# 22.5 ± 5.1§ 15.3 ± 4.1§# <0.001
RA total EF, % 50.9 ± 8.2# 55.3 ± 8.8§ 60.2 ± 10.1§# <0.001
RA passive EF, % 32.9 ± 8.1 36.0 ± 7.0 42.7 ± 10.0§# <0.001
RA active EF, % 27.0 ± 8.2 28.8 ± 10.6 30.8 ± 10.6 0.296
Tricuspid annulars0, cm/s 13.2 ± 2.3 13.1 ± 2.3 15.0 ± 2.8§# 0.003
Tricuspid annulare0, cm/s 14.5 ± 3.4 14.4 ± 3.3 16.5 ± 3.4 0.123
Tricuspid annulara0, cm/s 9.2 ± 3.0 9.6 ± 2.5 13.2 ± 4.8§# <0.001
Continuous variables are means ± SD; categorical variables are reported as frequencies (%).P<0.05 vs. controls, #P<0.05 vs. non- MR athletes,§P<0.05 vs. MR athletes.A, mitral inflow velocity during atrial contraction;a0, peak late (atrial) diastolic annular velocity;
DT, deceleration time;E, early diastolic mitral inflow velocity;e0, early diastolic annular velocity; EDVi, end-diastolic volume index; EF, ejection fraction; ESVi, end-systolic volume index; FAC, fractional area change; GCS, global circumferential strain; GLS, global longitudi- nal strain; IVSd, interventricular septal thickness at end-diastole; LA, left atrium; LA active EF, LA active emptying fraction; LA passive EF, LA passive emptying fraction; LA total EF, LA total emptying fraction; LAVimax, left atrial maximal volume index; LAVimin, left atrial minimal volume index; LAVipreA, left atrial preA wave volume index; LV, left ventricle; LVIDd, LV internal diameter at end-diastole; Mi, mass index; MR, mitral regurgitation; PWd, posterior wall thickness at end-diastole; RA, right atrium; RA active EF, RA active emptying fraction; RA passive EF, RA passive emptying fraction; RA total EF, RA total emptying fraction; RAVimax, right atrial maximal volume index; RAVimin, right atrial minimal volume index; RAVipreA, right atrial preA wave volume index; RV, right ventricle; RVd, RV basal di- ameter; RVFWLS, RV free wall longitudinal strain; RVSLS, RV septal longitudinal strain; RVSP, right ventricular systolic pressure;s0, sys- tolic annular velocity; SVi, stroke volume index; TAPSE, tricuspid annular plane systolic excursion; 2-D, two-dimensional; 3-D, three- dimensional.
with both non-MR athletes and controls (Table 4andFig. 7).
TA perimeter, two-chamber view diameters, and major axis diameters were comparable between athlete groups but still larger than controls. TA sphericity, area fraction, and systolic excursion were similar between groups. Maximal tenting height and tenting volume index were significantly higher in the athlete groups compared with the sedentary controls (Table 4;Fig. 7).
In the pooled population (n= 102), MA 3-D area index cor- related with LV EDVi (r= 0.704,P<0.001), LV Mi (r= 0.657, P<0.001), and LAVimax(r= 0.719,P<0.001), whereas TA 3- D area index correlated with RV EDVi (r= 0.643,P<0.001)
and RAVimax(r= 0.741,P<0.001). MA tenting volume index correlated with LV EDVi (r= 0.673,P< 0.001), whereas TA tenting volume index correlated with RV EDVi (r= 0.617,P<
0.001). Furthermore, in athletes (n = 68), MA and TA 3-D area index correlated with V_O2/kg (MA:r= 0.443,P<0.001;
TA:r= 0.423,P<0.01). Multivariate linear regression models were built to identify independent determinants of MA and TA 3-D area index in athletes. In thefirst model (comprising age, sex, LVEDVi, LAVimax, and V_O2/kg), LAVimaxand V_O2/kg were found to be independent determinants of MA 3-D area index, with a cumulativeRvalue of 0.681 (P<0.001;Table 5). In a second model (comprising age, sex, RVEDVi, Figure 5. Comparison of the exercise- induced dilation of the left ventricle (LV), the left atrium (LA), and the mitral annulus (MA) (A) and the right ventricle (RV), the right atrium (RA), and the tricuspid annulus (TA) (B). Three-dimensional (3-D) MA area index showed a disproportionate incre- ment compared with both LV and LA vol- ume indices (n= 68, overall P < 0.001).
The relative increase in the 3-D TA area index was significantly higher compared with RV volume index (n= 68, overallP<
0.01).
Table 3. Mitral valve quantification of athlete and control groups
MR Athletes Non-MR Athletes Controls OverallP
Subjects,n 34 34 34
Annulus
Annulus 3-D area index, cm2/m2 8.2 ± 1.0# 7.2 ± 1.0§ 4.7 ± 0.6§# <0.001
Annulus 2-D area index, cm2/m2 7.3 ± 0.9# 6.4 ± 0.9§ 4.2 ± 0.6§# <0.001
Annulus perimeter, cm 14.2 ± 1.2# 13.6 ± 1.1§ 10.6 ± 0.9§# <0.001
A-P diameter, cm 3.6 ± 0.4# 3.4 ± 0.4§ 2.7 ± 0.4§# <0.001
PM-AL diameter, cm 4.5 ± 0.4# 4.3 ± 0.4§ 3.4 ± 0.3§# <0.001
Commissural diameter, cm 4.5 ± 0.4# 4.2 ± 0.4§ 3.4 ± 0.3§# <0.001
Intertrigonal distance, cm 3.3 ± 0.6# 2.9 ± 0.4§ 2.4 ± 0.4§# <0.001
Sphericity index 0.8 ± 0.1 0.8 ± 0.1 0.8 ± 0.1 0.312
Annulus height, mm 9.6 ± 2.8 10.5 ± 2.1 7.2 ± 2.0§# <0.001
Nonplanar angle, 128.9 ± 16.9# 116.0 ± 21.4§ 131.1 ± 13.8# <0.001
Mitral annular excursion, mm 12.9 ± 2.0 12.2 ± 2.1 11.3 ± 2.1§ 0.009
Annulus (2-D) area fraction, % 4.8 ± 6.5 2.5 ± 3.9 4.1 ± 9.0 0.371
Mitral-aortic angle, 140.4 ± 13.1 138.1 ± 12.1 147.1 ± 11.6§# 0.011
AHCWR, % 21.8 ± 6.8# 25.2 ± 5.6§ 21.6 ± 6.7# 0.036
Leaflets
Anterior leaflet area index, cm2/m2 4.4 ± 0.9# 3.4 ± 0.5§ 2.5 ± 0.4§# <0.001
Posterior leaflet area index, cm2/m2 4.2 ± 0.8 4.3 ± 0.8 2.6 ± 0.5§# <0.001
Anterior leaflet length, cm 2.7 ± 0.3# 2.5 ± 0.3§ 2.0 ± 0.3§# <0.001
Posterior leaflet length, cm 1.7 ± 0.3 1.8 ± 0.4 1.4 ± 0.3§# <0.001
Anterior leaflet angle, 23.9 ± 4.6# 26.3 ± 6.0§ 25.1 ± 4.8 0.043
Posterior leaflet angle, 39.5 ± 9.9 39.6 ± 7.6 40.6 ± 10.2 0.948
Tenting height, cm 1.0 ± 0.2 1.0 ± 0.2 0.8 ± 0.2§# <0.001
Tenting area index, cm2/m2 1.2 ± 0.3 1.2 ± 0.3 0.8 ± 0.2§# <0.001
Tenting volume index, mL/m2 2.0 ± 0.6 1.8 ± 0.6 0.9 ± 0.3§# <0.001
Continuous variables are means ± SD; categorical variables are reported as frequencies (%).P<0.05 vs. controls, #P<0.05 vs.
non-MR athletes,§P<0.05 vs. MR athletes. AHCWR, annulus height to commissural width ratio; A-P diameter, anteroposterior di- ameter; MR, mitral regurgitation; PM-AL diameter, posteromedial-anterolateral diameter; 2-D, two-dimensional; 3-D, three- dimensional.
RAVimax, and V_O2/kg), RAVimax was the only independent predictor of TA 3-D area index, with a cumulativeRvalue of 0.648 (P<0.001;Table 5).
Despite using transthoracic 3-D echocardiographic images for annular quantification, good intra- and interobserver varia- bilities could be assessed concerning all of the key measure- ments (intraobserver and interobserver ICC values with 95%
confidence intervals, respectively; MA 3-D area: 0.978 [0.949– 0.991] and 0.961 [0.909–0.984], nonplanar angle: 0.842 [0.656– 0.933] and 0.778 [0.534–0.903], MA tenting volume: 0.977 [0.945–0.991] and 0.944 [0.868–0.977], TA 3-D area: 0.973 [0.926–0.990] and 0.941 [0.863–0.976], TA tenting volume:
0.957 [0.898–0.982] and 0.884 [0.740–0.952]). These results are similar to those reported in previous publications (10,11).
DISCUSSION
To the best of our knowledge, our study is thefirst to char- acterize the annular geometry of mitral and tricuspid valves
in elite athletes using 3-D echocardiography. We have found that exercise-induced remodeling comprises a significant di- lation of annular dimensions and increased leaflet tenting of both atrioventricular valves. MA showed a disproportionate enlargement compared with both the LV and the LA, whereas TA was more extensively increased than the RV.
Moreover, we have demonstrated a more pronounced saddle shape of the MA in athletes without MR, which was not pres- ent in those athletes who had mild MR.
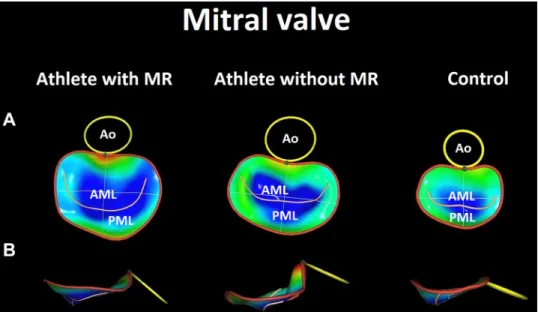
The mitral and tricuspid annuli are thefibrous continuity between ventricular and atrial myocardium and leaflet tis- sues. These saddle-shaped structures’function is to minimize leaflet stress and optimize coaptation throughout the corre- sponding phase of the cardiac cycle (12). 3-D echocardiogra- phy revolutionized our understanding of the MA geometry and dynamics, highlighting important pathophysiological dif- ferences between primary and secondary mitral valve dis- eases. Although MA dilation can be present both in patients with mitral valve prolapse (Barlow disease or fibroelastic Figure 6. Three-dimensional (3-D) mitral
annular reconstructions of athletes with and without mitral regurgitation (MR) and a healthy sedentary volunteer (control;
representative cases). The impact of regu- lar exercise training is represented by the larger dimensions of the mitral annulus in athletes; however, athletes presented with MR even had a larger annular size.
Athletes without MR had a more pro- nounced saddle shape, whereas athletes with MR and controls did not differ in this regard. See details in the text. A: sur- geon’s view. B: side view of the mitral annulus. More blueish hues represent more tenting of the mitral valve leaflets.
AML, anterior mitral valve leaflet; Ao, aor- tic annulus; PML, posterior mitral valve leaflet.
Table 4. Tricuspid valve quantification of athlete and control groups
MR Athletes Non-MR Athletes Controls OverallP
Subjects,n 34 34 34
Annulus
Annulus 3-D area index, cm2/m2 7.2 ± 1.1# 6.5 ± 1.1§ 5.0 ± 0.8§# <0.001
Annulus 2-D area index, cm2/m2 7.1 ± 1.1# 6.4 ± 1.1§ 4.9 ± 0.8§# <0.001
Annulus (2-D) area fraction, % 15.2 ± 4.4 15.4 ± 4.0 16.1 ± 4.2 0.622
Annulus perimeter, cm 13.3 ± 1.2 12.9 ± 1.2 10.8 ± 0.8§# <0.001
4-chamber diameter, cm 4.1 ± 0.3# 3.8 ± 0.4§ 3.2 ± 0.3§# <0.001
2-chamber diameter, cm 4.1 ± 0.4 4.0 ± 0.4 3.2 ± 0.4§# <0.001
Major axis, cm 4.4 ± 0.5 4.3 ± 0.5 3.6 ± 0.3§# <0.001
Minor axis, cm 3.9 ± 0.4# 3.7 ± 0.3§ 3.1 ± 0.3§# <0.001
Sphericity index 0.9 ± 0.1 0.9 ± 0.1 0.9 ± 0.1 0.712
Excursion, cm 1.6 ± 0.2 1.5 ± 0.3 1.5 ± 0.3 0.370
Leaflets
Max tenting height, cm 0.9 ± 0.1 1.0 ± 0.2 0.7 ± 0.1§# <0.001
Tenting volume index, mL/m2 2.1 ± 0.5 2.0 ± 0.6 1.0 ± 0.3§# <0.001
Continuous variables are means ± SD; categorical variables are reported as frequencies (%).P<0.05 vs. controls, #P<0.05 vs. non- MR athletes,§P<0.05 vs. MR athletes. MR, mitral regurgitation; 2-D, two-dimensional; 3-D, three-dimensional.
deficiency) and in patients with ventricular functional MR, the latter group is rather characterized by a stiff, hypody- namic MA. The flattening of the saddle-shaped MA is also considered as an adverse response to different pathological stimuli (11,12). The added value of 3-D echocardiography is evident not just in terms of describing the nonplanar MA ge- ometry and eliminating the underestimation of MA size (when assessed by linear measurements) but also in the more accurate quantification of MR and supporting a more person- alized diagnostic approach and subsequent therapeutic deci- sions (11). Recently, 3-D modeling and systolic tracking of the TA became available using 3-D echocardiography, and it
promises similar advantages compared with conventional assessment (13).
Regular physical exercise exposes the cardiovascular sys- tem to often extreme hemodynamic demands, resulting in significant changes in cardiac morphology and function (14).
Although the ventricular myocardium’s dynamic adaptation is definitely the most widely known aspect when considering an athlete’s heart, alterations of the interconnected valvular apparatus should not be overlooked. During intense exercise, the atrioventricular valves have to support an adequate dia- stolicfilling while also keeping their systolic competency to maintain the “one-way” circulation in the face of a wide range of intracardiac pressures and ventricular outputs (15).
Still, data are scarce even concerning MA and TA linear dimensions in athletes. In accordance with our current results, it was previously shown that athletes have signifi- cantly higher MA linear diameters than sedentary controls.
Moreover, a more pronounced MA enlargement exists in ath- letes presenting with MR (5). Although functional mitral and tricuspid regurgitation rarely exceed the mild degree in ath- letes, a higher overall prevalence of MR and TR is reported in the literature (5). In our cohort, the vast majority of athletes with functional MR had concomitant TR, and interestingly, the MR group is presented with higher TA dimensions as well.
This phenomenon implies that athletes prone to more exces- sive dilation of the MA are susceptible to a more pronounced TA remodeling. Of note, it has been suggested that alterations in TA geometry can be present even in the case of degenera- tive processes affecting the MA primarily (16). The mitral valve apparatus also shows a distinct change in shape if we compare the two athlete groups: although in athletes with MR, the parameters referring to the MA saddle shape, namely, annulus height to commissural width ratio (AHCWR) and nonplanar angle, were comparable with the values of seden- tary controls, increased AHCWR and a less obtuse nonplanar angle were found in athletes without MR. These latter indicate a more pronounced MA saddle shape in that group, which is, according to our knowledge, a unique finding across the spectrum of physiological or pathophysiological Table 5. Multivariate linear regression analysis: inde-
pendent determinants of MA 3-D area index and TA 3-D area index in athletes (n = 68)
Covariate b P
MA 3-D area index
Age 0.153 0.124
Sex 0.156 0.156
LAVimax 0.398 0.001
LV EDVi 0.200 0.131
V_O2/kg 0.260 0.033
CumulativeR 0.681
Standard error 1.13
CumulativeP 0.000001
TA 3-D area index
Age 0.040 0.719
Sex 0.117 0.299
RAVimax 0.543 <0.001
RV EDVi 0.013 0.932
V_O2/kg 0.221 0.108
CumulativeR 0.648
Standard error 1.19
CumulativeP 0.000005
Boldface indicates significant beta values. EDVi, end-diastolic volume index; LAVimax, left atrial maximal volume index; LV, left ventricle; MA, mitral annular; RAVimax, right atrial maximal vol- ume index; RV, right ventricle; TA, tricuspid annular; V_O2/kg, peak oxygen uptake indexed to body weight; 3-D, three-dimensional.
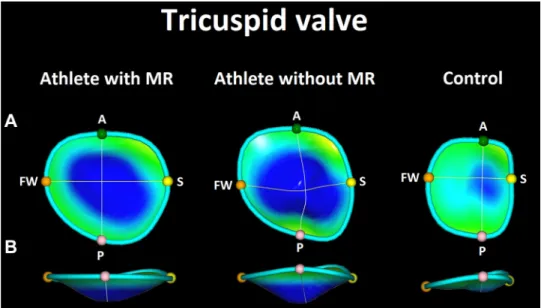
Figure 7.Three-dimensional (3-D) tricuspid annular reconstructions of athletes with and without mitral regurgitation (MR) and a healthy sedentary volunteer (control; repre- sentative cases). The impact of regular exercise training is represented by the larger dimensions of the tricuspid annulus in athletes; however, athletes presented with MR even had a larger annular size.
See details in the text.A: surgeon’s view.
B: side view of the tricuspid annulus.
More blueish hues represent more tent- ing of the tricuspid valve leaflets. A, an- terior; FW, free wall; P, posterior; S, septal reference points.
alterations of the MA (11). However, the anatomical advan- tages of this phenomenon are not completely clear. We may hypothesize that it may serve as an adaptive change to main- tain proper coaptation during the different exercise levels when chamber geometry and intracardiac pressures continu- ously change. The MA nonplanarity of athletes presented with MR did not significantly differ from sedentary controls, sug- gesting that in this population, the mild regurgitation may originate at least partially from the“insufficient”geometrical adaptation of the MA to regular, intense exercise. Interestingly, the anterior leaflet area, but not posterior leaflet area, was sig- nificantly higher in athletes with MR compared with those without. According to previous data, mechanical stretch by papillary muscle displacement can induce leaflet hyperplasia (17). However, as the enlargement of the leaflets is usually pro- portional in pathological states, the asymmetrical growth of the mitral valve leaflets may be a specific manifestation of this
“adverse”athletic adaptation accompanied by MR.
Athletes with MR showed tendentially higher LV volumes;
significantly higher LV GLS, LAVimax, and RAVimax; and sig- nificantly lower RA total emptying fraction than athletes with no MR. Although such mild MR (assessed during resting con- ditions) certainly cannot be considered a hemodynamically relevant stimulus, these observations refer to what can be seen in the case of pathological LV volume overload (18,19).
Thesefindings can originate in two ways:1) an athlete with a predisposition to a more pronounced exercise-induced cham- ber dilation may also be more prone to higher MA dimensions and a consequential MR, and2) there is an inherent anatomi- cal cause of the MR that may significantly increase during exercise, resulting in more excessive cardiac remodeling.
Nevertheless, further studies involving stress echocardiogra- phy are warranted to clarify this classical“chicken or the egg” dilemma. In accordance with our previous publication (2), we found a relatively more pronounced biatrial dilation in female athletes. Future studies with higher case numbers should also target sex differences in this regard.
MA and TA areas showed at least moderate correlations with the corresponding ventricular and atrial volumes, confirming these exercise-induced dilatative processes’ interconnected nature. A modest but significant increase in the tenting volumes of both atrioventricular valves could also be demonstrated, related to the ventricular volumes. Accordingly, a mixed type of functional MR and TR (showing the characteristics of both atrial and ventric- ular types) was established in our examined cohort of ath- letes. MA and TA 3-D areas also correlated with CPET-derived exercise performance; in the case of the MA, V_O2/kg was even found to be an independent determinant. These findings rather support that the atrioventricular annular dilation is still one of the adaptive aspects of the complex physiological car- diac response to regular, intense exercise training. Notably, however, atrial volumes were independent determinants of annular areas, whereas ventricular volumes were not. These results resonate with recent publications showing that the RA dilation is the major determinant of TA size in patients with atrialfibrillation and/or functional TR (20,21). Longitudinal studies with long-term follow-up are required to establish the (patho)physiological link between exercise-induced cardiac remodeling, functional valvular regurgitation, and, eventu- ally, occurrence of atrialfibrillation.
Limitations
Several limitations have to be acknowledged. First, the study cohort’s size is relatively limited, mainly because we aimed to investigate elite athletes with available good-quality 3-D acquisitions and presenting with MR and compare them with those without. Second, clinical relevance and therapeu- tic consequences of such quantifications would be related to athletes with primary valvular heart diseases and higher grades of regurgitation; however, athletes with such disorders were absent in our database. Nevertheless, we plan a long- term follow-up of our athletes to investigate the progression/
regression dynamics of the established alterations and the potential occurrence of clinical adverse events. 3-D echocar- diographic quantification of the mitral valve is primarily designed for transesophageal images, where spatial and tem- poral resolutions are higher. However, athletes are generally presenting with exceptionally good acoustic windows, and data have shown that results derived from transthoracic and transesophageal approaches are rather interchangeable (8).
Intraobserver and interobserver variability also confirmed the reliability of our measurements. The generalizability of our results to other sport disciplines, to amateur athletes, and to different age categories remains unknown.
Conclusions
In our retrospective cohort study of young elite athletes, we have shown that beyond the dilation of the cardiac cham- bers, atrioventricular annuli may undergo a disproportionate remodeling in response to regular, intense exercise training.
Athletic valvular adaptation is characterized by both annular enlargement and increased leaflet tenting of both the mitral and tricuspid valves. There are also specific differences in MA geometry between athletes presented with or without functional MR. Further research is warranted in athletes competing in other sport disciplines, in master athletes, and in athletes with primary valvular heart diseases.
GRANTS
This study was partly financed by the National Research, Development and Innovation Office of Hungary (NKFIA;
NVKP_16-1-2016-0017 National Heart Program). The research was partly financed by the Thematic Excellence Program (Temater€uleti Kiválosági Program, 2020-4.1.1.-TKP2020) of the Ministry for Innovation and Technology in Hungary, within the framework of the Therapeutic Development and Bioimaging programmes of the Semmelweis University. The research was also supported by the ÚNKP-20-5 and the ÚNKP-20-3-II New National Excellence Program of the Ministry for Innovation and Technology from the source of the National Research, Development and Innovation Fund. This project was also sup- ported by a grant from the National Research, Development and Innovation Office (NKFIH) of Hungary (K135076 to B.M.). A. Kovács was supported by the János Bolyai Research Scholarship of the Hungarian Academy of Sciences. A. Kovács was also supported by GE Vingmed Ultrasound (Horten, Norway) by a research grant per- mitting the use of 4D Auto TVQ software.
DISCLOSURES
No conflicts of interest,financial or otherwise, are declared by the authors.