Original article
Effect of secular trends on age-related
trajectories of cardiovascular risk factors: the Whitehall II longitudinal study 1985–2009
Adam Hulma´n,
1* Adam G Taba´k,
2,3Tibor A Nya´ri,
1Dorte Vistisen,
4Mika Kivima¨ki,
2Eric J Brunner
2and Daniel R Witte
51Department of Medical Physics and Medical Informatics, University of Szeged, Szeged, Hungary,
2Department of Epidemiology and Public Health, University College London, London, UK,3First Depart- ment of Medicine, Semmelweis University Faculty of Medicine, Budapest, Hungary,4Steno Diabetes Center, Gentofte, Denmark and5Centre de Recherche Public de la Sante´, Strassen, Luxembourg
*Corresponding author. Department of Medical Physics and Medical Informatics, University of Szeged, H-6720 Szeged, Kora´nyi fasor 9, Hungary. E-mail: hulman.adam@med.u-szeged.hu
Accepted 18 December 2013
Abstract
Background:
Secular trends in cardiovascular risk factors have been described, but few studies have examined simultaneously the effects of both ageing and secular trends within the same cohort.
Methods:
Development of cardiovascular risk factors over the past three decades was analysed using serial measurements from 10 308 participants aged from 35 to 80 years over 25 years of follow-up from five clinical examination phases of the Whitehall II study.
Changes of body mass index, waist circumference, blood pressure and total and high- density lipoprotein cholesterol distribution characteristics were analysed with quantile regression models in the 57–61 age group. Age-related trajectories of risk factors were assessed by fitting mixed-effects models with adjustment for year of birth to reveal secu- lar trends.
Results:
Average body mass index and waist circumference increased faster with age in women than in men, but the unfavourable secular trend was more marked in men.
Distributions showed a fattening of the right tail in each consecutive phase, meaning a stronger increase in higher percentiles. Despite the higher obesity levels in younger birth cohorts, total cholesterol decreased markedly in the 57–61 age group along the entire distribution rather than in higher extremes only.
Conclusion:
The past three decades brought strong and heterogeneous changes in car- diovascular risk factor distributions. Secular trends appear to modify age-related trajecto- ries of cardiovascular risk factors, which may be a source of bias in longitudinal analyses.
Key words:Obesity, blood pressure, cholesterol, secular trend, ageing, quantile regression
VCThe Author 2014. Published by Oxford University Press on behalf of the International Epidemiological Association 1 This is an Open Access article distributed under the terms of the Creative Commons Attribution License (http://creativecommons.org/licenses/by/3.0/), which permits unrestricted reuse, distribution, and reproduction in any medium, provided the original work is properly cited.
International Journal of Epidemiology, 2014, 1–12 doi: 10.1093/ije/dyt279 Original article
by guest on February 9, 2014http://ije.oxfordjournals.org/Downloaded from
Introduction
Cardiovascular disease (CVD) remains the most common cause of death in the UK. Despite the fact that CVD mor- tality in the UK has halved during the past three decades, it still accounts for approximately 30% of total mortality.1 A very similar situation is seen on a global scale,2mostly driven by the combination of ageing populations, seden- tary lifestyle and high-calorie diets. Many CVD risk factors are increasingly controlled or treated (e.g. smoking, obes- ity, hypertension, diabetes, hypercholesterolaemia) in peo- ple at the high end of the risk distribution, and in many countries population-based campaigns have been put in place to promote a healthier lifestyle.
The combined effects of societal trends that increase CVD risk factors and the individual and population-based efforts to mitigate them have been different for different risk factors. Although systolic blood pressure and choles- terol levels have decreased markedly in high-income coun- tries in the past decades,3–9the obesity ‘epidemic’ seems to continue unabated.10–17
Much of the evidence on the trends in cardiovascular risk comes from the comparison of observed average risk factor levels in sequential cross-sectional surveys, and only few of these studies have investigated trends in the most important CVD risk factors within the same population.7,8
A second aspect that has received little attention is the change in cardiovascular risk factor distributions. This issue may have important practical implications because the Rose prevention paradigm, which has strongly affected public health policy in the past decades, assumes that as populations move into higher CVD risk levels, risk factor distributions shift in their entirety to the right. Hence, pre- vention of CVD events should target the entire popula- tion.18,19 However, few studies have examined whether the shift of CVD risk factor distributions indeed follows these assumptions. The limited evidence available for BMI suggests that the distribution has become increasingly
skewed in the past decades, with little upward shift of the entire curve.20–22
To address these issues, we investigated the develop- ment of body mass index (BMI), waist circumference (WC), systolic and diastolic blood pressure (SBP and DBP), and total and high-density lipoprotein cholesterol (TC and HDL) over 25 years in a British occupational cohort, the Whitehall II study. Our aim was to determine whether (i) changes over time were similar along the full range of risk factor distributions, and whether (ii) age-related trajecto- ries were affected by secular trends.
Methods Study setting
Between 1985 and 1988, 10 308 British men and women (73% of those invited), aged 35–55 years and employed in London-based government departments, participated in the first phase of the Whitehall II study.23 Two thirds of them were men. Clinical examinations in addition to postal questionnaires were part of every second phase, i.e. phase 1 in 1985–88, phase 3 in 1991–94, phase 5 in 1997–99, phase 7 in 2002–04 and phase 9 in 2007–09. The final dataset contained up to five repeated measurements per participant.
Measurements
BMI was calculated as the ratio of weight (in kg) and height-squared (in m2). WC (smallest) was first measured at phase 3. All anthropometric measures were assessed by trained nurses according to standardized protocols. Sys- tolic and diastolic blood pressures were measured twice at each clinical phase and the average was used in the ana- lyses. After phase 5, the manual random zero sphygmo- manometer (MRZ) was switched to an automated oscillometric device (AOD). The biochemical analysis of blood samples to assess total and HDL cholesterol values Key Messages
• In recent years more people have high body mass index and waist circumference and fewer people have average val- ues, but the proportion of people with low values has not changed.
• Whereas both systolic and diastolic blood pressure levels have declined in the past decades, diastolic blood pressure has done so more markedly, leading to an increasing pulse pressure.
• In the past decades total cholesterol levels have dropped in the entire population.
• Descriptions of risk factor trends focusing only on mean levels lack detail with regard to changing distributions.
• Secular trends should be taken into account when analysing age-related trajectories of risk factors to avoid biased es- timates caused by large differences between successive birth cohorts.
by guest on February 9, 2014http://ije.oxfordjournals.org/Downloaded from
is described in details elsewhere.24 The University College London ethics committee reviewed and approved the study. Written informed consent was obtained from all participants at each study phase.
Statistical analyses
To describe secular trends, 10th, 50th and 90th percentiles of risk factors were calculated for the 57–61 age group at each of the last four phases (this age group was not repre- sented in phase 1 when the participants were at 35–55 years of age). This resulted in an 18-year long study period for this sequential cross-sectional analysis. We investigated whether trends were similar across the full range of the dis- tribution of each cardiovascular risk factor. A linear trend was estimated with quantile regression using calendar year as the explanatory variable. Non-parametric smooth ker- nel distributions were fitted to get an overall picture of how the characteristics (location and shape) changed from phase to phase.
Quadratic age-related risk factor trajectories for the mean were assessed with mixed-effects models with random intercepts. We added year of birth and its interaction terms with age and age-squared to the models to analyse secular trends. To test the robustness of our results against selective loss of follow-up and healthy survival, we fitted models to a subgroup who participated up to phase 9 (not necessarily in each phase) in a sensitivity analysis. Statistical analysis was performed using Mathematica 9 (Wolfram Research) and R version 2.15.1 (lme4, quantreg and Epi packages).
Results
Cohort characteristics
Baseline characteristics are shown inTable 1. Women were more likely to be current smokers than men. Almost half of the women had the lowest employment grade, whereas this was the case only in 1 in 10 men. The largest sex differences in cardiovascular risk factors were in WC and HDL.
The number of participants at each phase is displayed in Table 2. Relatively fewer men (31.0%) than women (41.3%) were lost (caused by either death or non-response/
withdrawal) from the study until phase 9. Attrition was largest between phase 1 and 3 (12.8%). The average num- ber of visits per participant was 4.
Sequential cross-sectional analyses (age group:
57–61 years)
Table 3 displays cardiovascular risk factor percentiles (10th, 50th, 90th) in the 57–61 age group at study phases
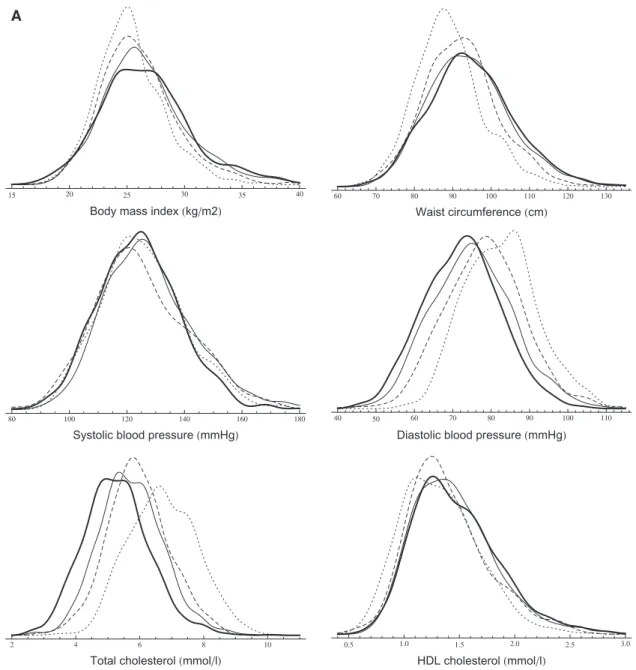
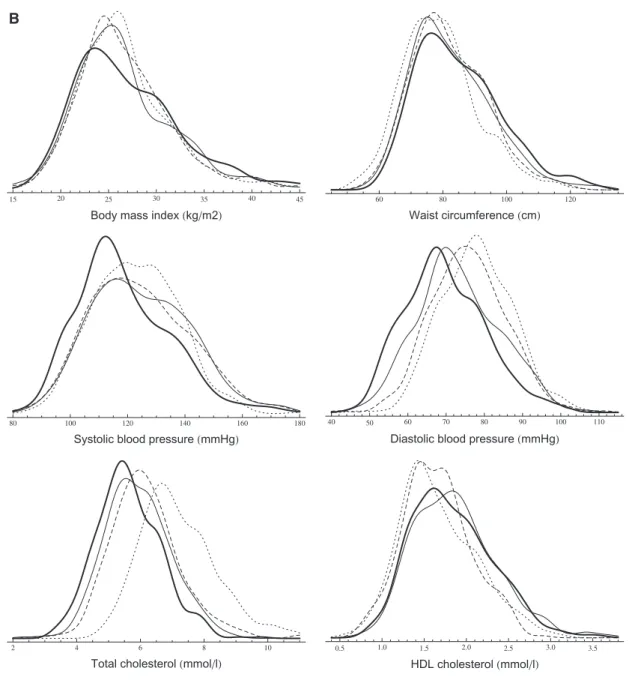
3, 5, 7 and 9. Smooth kernel distributions are shown in Figure 1.
The BMI distribution of men not only shifted to the right (except for extremely low percentiles) but also be- came more fat-tailed on the right. The increment was larger in higher percentiles (the 90th percentile increased by 2.8 kg/m2 between phases 3 and 9), which led to a higher degree of skewness. The change in women showed a slightly different pattern. A larger part of the distribution’s left end (below 23 kg/m2) remained unchanged, but a fat- tail grew on the right end (the 90th percentile increased by 2 kg/m2). Contrarily to BMI, WC increased also in the 10th percentile, but the changes were the largest in the right end of the distribution with an8-cm increment be- tween 1991 and 2009 in both men and women.
SBP measures slightly increased until phase 7, but dropped markedly at the last phase. The entire DBP distri- bution shifted to the left by 10 mmHg in men. In women, the decline was larger in the 10th percentile than in the 90th (10 mmHg vs 6 mmHg).
There was a marked distribution shift to the left in TC.
The median decreased by22% in both men and women.
This 1.5-mmol/l decline characterized the entire distri- bution, although the 90th percentile decreased even more (1.9 mmol/l) in women. The changes in the HDL distri- bution were modest compared with our observations in TC, although all calculated percentiles increased by 0.1–0.2 mmol/l.
Changes in smoking habits and medication usage are shown in Table 4. The percentage of current smokers Table 1. Baseline characteristics (1985–88). Values are me- dians (Q1; Q3) or percentages (%)
Characteristic Men (N¼6895) Women (N¼3413)
Age (year) 43 (39; 49) 45 (40; 51)
Whites (%) 91.5 84.2
Smoking (%)
Never 47.3 52.9
Ex 36.1 23.3
Current 15.8 23.3
Missing 0.8 0.5
Grade level (%)
Administrative 38.4 11.2
Prof/executive 52.3 39.1
Clerical/support 9.3 49.7
BMI (kg/m2) 24.3 (22.6; 26.2) 24.0 (21.9; 26.7) WC (cm)a 88.9 (83.0; 94.7) 76.5 (69.5; 85.4) SBP (mmHg) 123 (115; 133) 118 (109; 130)
DBP (mmHg) 77 (71; 84) 75 (68; 81)
TC (mmol/l) 5.9 (5.2; 6.7) 5.8 (5.1; 6.6) HDL (mmol/l) 1.3 (1.1; 1.6) 1.6 (1.4; 2.0)
aWC values are from phase 3, when first measured.
by guest on February 9, 2014http://ije.oxfordjournals.org/Downloaded from
remained constant at 8% in men, but decreased mark- edly in women. Usage of lipid-lowering medication increased drastically in both men and women. Whereas at phase 3 only 1–2% took medication, at phase 9 every fourth man and fifth woman did so. Around 25% of par- ticipants were on antihypertensive medication at phase 9.
Longitudinal analyses
Age-related mean risk factor trajectories for the entire study population are displayed inFigure 2. The age range of 57–61 years is highlighted to visualize the subset of par- ticipants used for the quantile regression analyses. Model coefficient estimates are displayed in eTable 1 (available as Supplementary dataatIJEonline).
Both BMI and WC increased faster in younger gener- ations and were at higher levels than in older birth cohorts at any given age {e.g. a BMI difference at age 60 between those born in 1933 and 1948 of 1.3 kg/m2 [95% confi- dence interval (CI) 1.1; 1.5] and 0.5 kg/m2[95% CI 0.1;
0.9] for men and women, respectively}. The secular trend in BMI was greater in men than in women, whereas women in all birth cohorts had steeper BMI and WC tra- jectories compared with men.
SBP increased faster with age in women than in men:
15.1 mmHg vs 8.9 mmHg, respectively, between ages 40 and 75 (12.9 % vs 7.2% relative difference). Younger gen- erations, except men in late adulthood, had lower SBP lev- els. The mean DBP trajectory (unadjusted) increased until age 50, and then decreased markedly in both men and women. The peaks of the adjusted DBP trajectories occurred at earlier ages in younger generations, who also had generally lower DBP levels: at age 60, men born in 1948 had a 8.4-mmHg (95% CI 7.8; 9.0) lower DBP than men born in 1933, whereas for women this difference was 7.8 mmHg (95% CI 7.0; 8.7).
The unadjusted TC trajectory in men increased up to age 47, peaking at 6.2 mmol/l (95% CI 6.2; 6.3) before declining. For women the corresponding peak value was
6.3 mmol/l (95% CI 6.3; 6.4) at age 52. Men born in 1948 had 1.1-mmol/l (95% CI 1.0; 1.2) lower TC level at age 60, than men born in 1933, whereas for women the differ- ence between these birth cohorts was 1.2 mmol/l (95% CI 1.1; 1.3). Women had higher HDL levels during the entire age range under examination. We also observed a modest positive trend and increment with ageing in both sexes.
In sensitivity analyses we fitted longitudinal models to a subsample of participants who attended up to the last phase, and we found associations very similar to those described above (data not shown).
Discussion
We found that middle-aged British men and women expe- rienced a marked change in cardiovascular risk over the past 25 years, which was partly attributable to ageing and partly due to secular trends. We report that at any given age younger generations were more obese, but had a more favourable lipid profile (i.e. lower total cholesterol levels and higher HDL cholesterol levels). Furthermore, the observed secular trends affected risk factor distributions.
Whereas the increase in obesity led to more right-skewed distributions, the decrease in total cholesterol was charac- terized by a left-shift of the entire distribution.
Obesity
We found evidence that changes in obesity were heteroge- neous across the population between 1985 and 2009. Our findings show that BMI increased particularly in groups already affected by obesity, but also that although BMI did not change in leaner groups, these were still developing ab- dominal obesity. It is conceivable that as people become in- creasingly sedentary, leaner people lose muscle mass and simultaneously accumulate abdominal fat mass, leaving their BMI unchanged while their WC increases. Given the particular impact of central obesity on glucose metab- olism25 and mortality26 independently of general obesity, Table 2.Summary of participation status at each study phase. Number of participants and cumulative number of deaths and non-responses/withdrawals are reported
Status Phase 1 1985–88 Phase 3 1991–94 Phase 5 1997–99 Phase 7 2002–04 Phase 9 2007–09
Men
Participated 6895 6057 5473 4893 4759
Died 81 204 389 621
Non-response / withdrawal 757 1218 1613 1515a
Women
Participated 3413 2758 2397 2074 2002
Died 44 102 195 333
Non-response / withdrawal 611 914 1144 1078a
aCumulative numbers may decrease, because we had information about the death of participants, even if they did not respond in a previous phase.
by guest on February 9, 2014http://ije.oxfordjournals.org/Downloaded from
Table 3A, B.Sequential cross-sectional analysis (age group: 57–61 years). Secular trends of cardiovascular risk factors in men (A) and women (B). Linear trends were assessed with quantile regression models
A
Men Percentile Phase 3
1991–94 N5911
Phase 5 1997–99 N5903
Phase 7 2002–04 N51222
Phase 9 2007–09 N51391
Linear trend (per year)
b(95% CI)
BMI (kg/m2)
10th 21.9 22.2 22.4 21.9 0.004 (0.014; 0.027)
50th 25.1 25.6 26.1 26.4 0.080 (0.065; 0.096)***
90th 29.1 30.4 31.8 31.9 0.192 (0.145; 0.234)***
WC (cm)
10th 78.4 80.3 81.2 80.6 0.152 (0.100; 0.210)***
50th 88.2 91.9 93.6 94.2 0.360 (0.318; 0.409)***
90th 101.4 105.2 108.4 109.6 0.508 (0.433; 0.631)***
SBP (mmHg)
10th 107 106 109 107 0.000 (0.086; 0.092)
50th 125 123 126 124 0.000 (0.031; 0.083)
90th 145 148 150 143 0.181 (0.313;0.030)*
DBP (mmHg)
10th 71 65 61 60 0.654 (0.714;0.603)***
50th 82 78 75 73 0.594 (0.653;0.517)***
90th 95 91 89 85 0.577 (0.650;0.490)***
TC (mmol/l)
10th 5.3 4.8 4.5 4.0 0.079 (0.085;0.074)***
50th 6.7 5.9 5.7 5.2 0.083 (0.088;0.077)***
90th 8.1 7.3 7.0 6.6 0.086 (0.093;0.079)***
HDL (mmol/l)
10th 0.9 1.0 1.0 1.0 0.005 (0.003; 0.008)***
50th 1.3 1.3 1.4 1.4 0.008 (0.004; 0.010)***
90th 1.8 1.9 1.9 2.0 0.011 (0.009; 0.013)***
B
Women Percentile Phase 3
1991-1994 N5520
Phase 5 1997-1999 N5383
Phase 7 2002-2004 N5492
Phase 9 2007-2009 N5514
Linear trend (per year)
b(95% CI)
BMI (kg/m2)
10th 21.3 21.2 21.2 21.1 0.007 (0.043; 0.021)
50th 26.0 25.8 25.8 26.1 0.000 (0.023; 0.025)
90th 32.8 32.5 33.8 34.8 0.120 (0.063; 0.205)**
WC (cm)
10th 64.9 68.0 68.1 69.9 0.289 (0.190; 0.351)***
50th 78.4 80.0 81.0 83.0 0.276 (0.173; 0.391)***
90th 96.0 96.3 100.2 104.0 0.482 (0.354; 0.657)***
SBP (mmHg)
10th 104 103 104 99 0.277(0.406;0.091)**
50th 122 123 123 116 0.350 (0.516;0.202)***
90th 141 148 147 141 0.094 (0.141; 0.278)
DBP (mmHg)
10th 66 64 60 56 0.634 (0.707;0.524)***
50th 78 75 72 69 0.558 (0.647;0.491)***
90th 90 89 88 84 0.359 (0.464;0.201)***
TC (mmol/l)
10th 5.8 4.9 4.7 4.4 0.084 (0.093;0.071)***
50th 7.0 6.1 5.9 5.5 0.084 (0.093;0.078)***
90th 8.8 7.6 7.3 6.9 0.115 (0.122;0.098)***
HDL (mmol/l)
10th 1.2 1.2 1.3 1.3 0.009 (0.007; 0.010)***
50th 1.6 1.6 1.8 1.8 0.012 (0.010; 0.019)***
90th 2.3 2.2 2.5 2.5 0.015 (0.011; 0.023)***
Nis the number of participants (aged 57–61 years) in each phase. Missing measures per variable do not exceed 3%, except phase 5 (BMI: 13%, WC: 20% and HDL: 13%), when timing and organization issues took place at the screening (so we can assume that values are missing at random).
*P<0.05; **P<0.01; ***P<0.001.
by guest on February 9, 2014http://ije.oxfordjournals.org/Downloaded from
our findings highlight the importance of assessing WC par- ticularly among people with BMI levels in the normal or overweight range.25
The global obesity ‘epidemic’ has been documented in several countries, based on studies reporting mean BMI levels17or the prevalence of overweight and obesity.27The BMI distribution became more right-skewed between ado- lescence and early adulthood28and in adulthood20,21in US and Canadian populations.29In addition, a Chinese popu- lation-based study showed that the WC distribution shifted to the right.22
As the marked increase in obesity in the UK seems to lag behind the developments in North America, where the
most recent results show that the epidemic is levelling off,30 it is conceivable that the right-skewing of the BMI distribution we observed is a feature of the early dynamic phase of the obesity epidemic, and that there is a point at which the divergence of percentiles stabilizes.
Our analysis of BMI and WC trajectories showed that in the past 25 years in the UK, each successive generation has reached a set level of both obesity measures at an ear- lier age. Participants born as little as 15 years apart (1948 compared with 1933) reached overweight at a 10-year ear- lier age for men and a 6-year earlier age for women. It is clear that the 1933 generation in the UK have had a very different early life experience, spending their youth in the A
Figure 1 A,B.Sequential cross-sectional analysis (age group: 57–61 years). Smooth kernel distributions of cardiovascular risk factors (probability density functions are displayed) in men (A) and women (B) (dotted line: phase 3, dashed line: phase 5, solid line: phase 7, thick line: phase 9).
(continued)
by guest on February 9, 2014http://ije.oxfordjournals.org/Downloaded from
austerity of the 1930s and the war period, whereas the 1948 generation spent these same years in the years of post-war reconstruction, increasing welfare and food se- curity. However, evidence from younger cohorts suggests that this development has not yet ceased and that even cur- rent teenagers are taller and more obese than teenagers a decade ago.31
A recent analysis from the CARDIA study32 showed that not only the attained level, but also the duration of overall and abdominal obesity, were associated with coronary artery calcification indicating that subsequent birth cohorts may be at elevated cardiovascular risk at a younger age.
We showed that increasing abdominal obesity affects both sexes similarly, and confirmed previous findings
that BMI levels in men are catching up with those in women.12,13
A previous study on BMI trajectories reported that age- related increases in BMI are underestimated using solely cross-sectional data.14 In addition to this, we argue that using longitudinal analyses without appropriate adjust- ment for secular trends might also lead to biased estimates as a consequence of large differences between different birth cohorts.
Blood pressure
Our results are in line with the current understanding that SBP rises from mid to late adulthood, whereas DBP peaks around age 50 years and then starts to decline as a result of B
Figure 1 A,B.Continued.
by guest on February 9, 2014http://ije.oxfordjournals.org/Downloaded from
Table 4A, B.Sequential cross-sectional analysis (age group: 57–61 years). Secular trends of lipid-lowering and antihypertensive medication and smoking habits in men (A) and women (B)
A
Men Phase 3 1991–94 Phase 5 1997–99 Phase 7 2002–04 Phase 9 2007–09
Current smoker (%) 8.5 8.8 8.7 7.9
Lipid treatment (%) 1.4 4.1 10.6 24.0
Antihypertensive treatment (%) 12.4 15.2 21.9 28.0
B
Women Phase 3 1991–94 Phase 5 1997–99 Phase 7 2002–04 Phase 9 2007–09
Current smoker (%) 15.9 10.6 11.3 4.7
Lipid treatment (%) 2.0 4.1 7.9 19.9
Antihypertensive treatment (%) 16.9 20.9 20.9 24.8
A
Figure 2A, B.Longitudinal trajectory analysis. Age-related trajectories (in years) of cardiovascular risk factors in men (A) and women (B) with adjust- ment for four different birth cohorts: 1933 (n), 1938 (^), 1943 (~), 1948 (
) and unadjusted (– – –).(continued)
by guest on February 9, 2014http://ije.oxfordjournals.org/Downloaded from
increasing aortic and small vessel stiffness.33,34These pre- vious reports were also based on longitudinal studies, but did not consider secular trends. By explicitly modelling tra- jectories for different birth cohorts, we were able to show that DBP levels are generally lower for younger cohorts. In contrast, the dynamics of SBP trend were not consistent.
Although the results of mean trajectory analyses showed a declining trend in women’s SBP (seeFigure 2), the quantile regression models suggest that this was mainly driven by changes between the last two phases. Both our sequential cross-sectional and trajectory analyses confirm the magni- tude of DBP drop during the past 25 years and also with ageing. This drop appears to be starting earlier in life in younger generations. As DBP decreases faster across gener- ations compared with SBP, a widening gap between SBP and DBP develops leading to a larger and faster increase of pulse pressure with age in younger compared with older
cohorts, especially among men. As pulse pressure is an independent determinant of coronary heart disease (CHD) risk35and DBP has been shown to have a negative associ- ation with CHD risk after the age of 60 years,36caution is required when interpreting secular trends in blood pressure.
Cholesterol
Previous studies have reported that TC levels are declining in high-income countries9 including the USA4 and England,37 An earlier report from the Whitehall II study,24 in line with reports from other developed coun- tries,38 found that the decline in LDL cholesterol could not be fully attributed to increasing use of lipid-lowering medication and that improvements in diet play a signifi- cant role.
B
Figure 2A, B.Continued.
by guest on February 9, 2014http://ije.oxfordjournals.org/Downloaded from
We confirm these earlier observations by reporting a progressive left-shift of the entire TC distribution.
Although the observed decline may be at least partially due to the wider use of statins in the past decades, particularly in the elderly, this could not explain a decreasing trend in the lower extremes of the distribution. This probably indi- cates that secular trends in other factors (e.g. diet, lifestyle) may have played an important role. We also have to note that medication use increased both with age and calendar year, leading to younger generations being more likely to get lipid-lowering medication earlier in their life.
The effect of secular trends on cholesterol levels was so large in the Whitehall II study that the unadjusted age- related trajectory is clearly biased and underestimates TC levels in late adulthood. This implies that an individual’s multiple measurements over a longer period should not be compared with population average trajectories without ad- justment for the birth cohort effect. The magnitude of secu- lar trends in cholesterol levels over the past three decades also makes this a particularly challenging period for the study of the isolated effects of ageing on cholesterol levels.
We observed a positive HDL cholesterol trend, but it was very modest compared with changes seen in TC levels.
In particular, it seems that younger generations of women have more favourable HDL levels throughout later middle age, reflected by higher and steeper trajectories compared with earlier birth cohorts.
Strengths
The key strength of our analysis was that we could study the effect of secular trends and ageing on several cardiovas- cular risk factors simultaneously in a relatively large popu- lation-scale sample with up to five repeated measurements over a 25-year period. Contrary to the common approach of reporting average values and standard deviations, we applied quantile regression which is well suited to highlight changes in distribution characteristics.
Limitations
Loss to follow-up is a critical question when analysing data from a longitudinal study with a long follow-up period. There is no test to determine whether data are missing at random (MAR) or missing not at random (MNAR); thus both cases should be considered. If the MAR assumption holds, likelihood-based methods give valid estimates. If the missingness pattern is MNAR, sensi- tivity analyses should be applied.39In this study, such ana- lyses replicated the main findings, suggesting that our results were robust (data not shown). Standardization of laboratory and other measurements is a recognized
problem. The changes in blood pressure measurement device is an unlikely cause of the secular trend we showed, as AOD produces slightly higher values than MRZ.40 Although all labs participated in the National External Quality Assurance Scheme for TC and HDL, we cannot en- tirely exclude standardization issues. The 57–61 age group was arbitrarily chosen, so our conclusions about risk factor distribution characteristics are not general for adulthood.
Sex differences could be biased by the uneven distribution of men and women across employment grades. Previous studies showed lower mortality rates41and systolic blood pressure trajectories,33 but similar BMI trajectories33 in our occupational cohort compared with population-based cohorts. Although it is likely that other risk factor levels may also be slightly more favourable in the Whitehall II co- hort, this does not imply that secular trends are also more favourable.
Conclusion
We showed in an occupational cohort of British civil servants that the past three decades brought strong and heterogeneous secular trends in obesity, blood pressure and lipid levels. Decreasing CVD mortality rates in the UK suggest that negative trends in obesity are counterbalanced by favourable changes in blood pressure and chol- esterol levels. The disparity of the trends indicates that the relative importance of these risk factors is likely to change over time. This observation has potential implications for the way we assess global CVD risk based on risk scores, highlighting the need to reassess the calibration of component weights on a regular basis. Our findings also suggest that more detailed models of risk factor progression may be needed to help track the development not only of average levels but also changing risk factor distributions in the population.
Not accounting for secular trends may cause biased estimates in lon- gitudinal analyses of age-related risk factor trajectories.
Supplementary Data
Supplementary materialis available atIJEonline.
Funding
The Whitehall II study is supported by grants from the Medical Research Council (K013351), British Heart Foundation (RG/13/2/
30098), National Heart Lung and Blood Institute (RO1 HL036310) and National Institute of Aging (RO1AG13196 and RO1AG034454). The authors thank the staff and participants of the Whitehall II study for their important contributions. A.H. is sup- ported by the TA´ MOP 4.2.2.A-11/1/KONV-2012-0052 Program.
A.G.T. is supported by the TA´ MOP 4.2.4.A/1-11-1-2012-0001 National Excellence Program – research fellowship co-financed by the European Union and the European Social Fund.
Conflicts of interest:Steno Diabetes Center A/S receives part of its core funding from unrestricted grants from the Novo Foundation and Novo Nordisk A/S. D.V. is employed by Steno Diabetes Center
by guest on February 9, 2014http://ije.oxfordjournals.org/Downloaded from
A/S, a research hospital working in the Danish National Health Service and owned by Novo Nordisk A/S. D.V. and D.R.W. own shares in Novo Nordisk A/S.
References
1. Townsend N, Wickramasinghe N, Bhatnagar P et al.Coronary Heart Disease Statistics. London: British Heart Foundation 2012.
2. Mathers CD, Boerma T, Ma Fat D. Global and regional causes of death.Br Med Bull2009;92:7–32.
3. Danaei G, Finucane MM, Lin JK et al. National, regional, and global trends in systolic blood pressure since 1980: systematic analysis of health examination surveys and epidemiological stud- ies with 786 country-years and 54 million participants.Lancet 2011;377:568–77.
4. Arnett DK, Jacobs DR, Luepker RV, Blackburn H, Armstrong C, Claas SA. Twenty-year trends in serum cholesterol, hyper- cholesterolemia, and cholesterol medication use: the Minnesota Heart Survey, 1980-1982 to 2000-2002. Circulation 2005;112:3884–91.
5. Carroll MD, Lacher DA, Sorlie PD et al. Trends in serum lipids and lipoproteins of adults, 1960-2002. JAMA 2005;294:
1773–81.
6. Eliasson M, Janlert U, Jansson J-H, Stegmayr B. Time trends in population cholesterol levels 1986-2004: influence of lipid-low- ering drugs, obesity, smoking and educational level. The north- ern Sweden MONICA study.J Intern Med2006;260:551–59.
7. Johansson S, Wilhelmsen L, Welin C, Eriksson H, Welin L, Rose- ngren A. Obesity, smoking and secular trends in cardiovascular risk factors in middle-aged women: data from population studies in Go¨teborg from 1980 to 2003. J Intern Med 2010;268:
594–603.
8. Vartiainen E, Laatikainen T, Peltonen M et al. Thirty-five-year trends in cardiovascular risk factors in Finland.Int J Epidemiol 2010;39:504–18.
9. Farzadfar F, Finucane MM, Danaei G et al. National, regional, and global trends in serum total cholesterol since 1980: system- atic analysis of health examination surveys and epidemiological studies with 321 country-years and 30 million participants.
Lancet2011;377:578–86.
10. Dey DK, Rothenberg E, Sundh V, Bosaeus I, Steen B. Height and body weight in elderly adults: a 21-year population study on secular trends and related factors in 70-year-olds.J Gerontol A Biol Sci Med Sci2001;56:780–84.
11. Lahti-Koski M, Jousilahti P, Pietinen P. Secular trends in body mass index by birth cohort in eastern Finland from 1972 to 1997.Int J Obes Relat Metab Disord2001;25:727–34.
12. Cabrera C, Wilhelmson K, Allebeck P, Wedel H, Steen B, Lissner L. Cohort differences in obesity-related health indicators among 70-year olds with special reference to gender and education.Eur J Epidemiol2003;18:883–90.
13. Eiben G, Dey DK, Rothenberg E et al. Obesity in 70-year-old Swedes: secular changes over 30 years.Int J Obes Relat Metab Disord2005;29:810–17.
14. Nooyens ACJ, Visscher TLS, Verschuren WMM et al. Age, period and cohort effects on body weight and body mass index in adults: The Doetinchem Cohort Study.Public Health Nutr 2009;12:862–70.
15. Diouf I, Charles MA, Ducimetie`re P, Basdevant A, Eschwege E, Heude B. Evolution of obesity prevalence in France: an age- period-cohort analysis.Epidemiology2010;21:360–65.
16. Jaacks LM, Gordon-Larsen P, Mayer-Davis EJ, Adair LS, Popkin B. Age, period and cohort effects on adult body mass index and overweight from 1991 to 2009 in China: the China Health and Nutrition Survey.Int J Epidemiol2013;42:828–37.
17. Finucane MM, Stevens GA, Cowan MJ et al. National, regional, and global trends in body-mass index since 1980: systematic ana- lysis of health examination surveys and epidemiological studies with 960 country-years and 91 million participants. Lancet 2011;377:557–67.
18. Rose G. Strategy of prevention: lessons from cardiovascular dis- ease.Br Med J1981;282:1847–51.
19. Rose G. Sick individuals and sick populations.Int J Epidemiol 1985;14:32–38.
20. Flegal KM, Troiano RP. Changes in the distribution of body mass index of adults and children in the US population.Int J Obes Relat Metab Disord2000;24:807–18.
21. Penman AD, Johnson WD. The changing shape of the body mass index distribution curve in the population: implications for pub- lic health policy to reduce the prevalence of adult obesity.Prev Chronic Dis2006;3:A74.
22. Xi B, Liang Y, He T et al. Secular trends in the prevalence of gen- eral and abdominal obesity among Chinese adults, 1993-2009.
Obes Rev2012;13:287–96.
23. Marmot M, Brunner E. Cohort Profile: the Whitehall II study.
Int J Epidemiol2005;34:251–56.
24. Bouillon K, Singh-Manoux A, Jokela M et al. Decline in low- density lipoprotein cholesterol concentration: lipid-lowering drugs, diet, or physical activity? Evidence from the Whitehall II study.Heart2011;97:923–30.
25. The InterAct Consortium. Long-term risk of incident type 2 dia- betes and measures of overall and regional obesity: the EPIC- InterAct case-cohort study.PLoS Med2012;9:e1001230.
26. Carmienke S, Freitag MH, Pischon T et al. General and abdom- inal obesity parameters and their combination in relation to mor- tality: a systematic review and meta-regression analysis.Eur J Clin Nutr2013;67:573–85.
27. Malik VS, Willett WC, Hu FB. Global obesity: trends, risk fac- tors and policy implications.Nat Rev Endocrinol2013;9:13–27.
28. Gordon-Larsen P, Adair LS, Nelson MC, Popkin BM. Five-year obesity incidence in the transition period between adolescence and adulthood: the National Longitudinal Study of Adolescent Health.Am J Clin Nutr2004;80:569–75.
29. Katzmarzyk PT. The Canadian obesity epidemic: an historical perspective.Obes Res2002;10:666–74.
30. Flegal KM, Carroll MD, Kit BK, Ogden CL. Prevalence of obes- ity and trends in the distribution of body mass index among US adults, 1999-2010.JAMA2012;307:491–97.
31. Smith SM, Craig LCA, Raja AE, McNeill G, Turner SW. Grow- ing up before growing out: secular trends in height, weight and obesity in 5–6-year-old children born between 1970 and 2006.
Arch Dis Child2013;98:269–73.
32. Reis JP, Loria CM, Lewis CE et al. Association between duration of overall and abdominal obesity beginning in young adulthood and coronary artery calcification in middle age. JAMA2013;
310:280–88.
by guest on February 9, 2014http://ije.oxfordjournals.org/Downloaded from
33. Wills AK, Lawlor DA, Matthews FE et al. Life course trajectories of systolic blood pressure using longitudinal data from eight UK cohorts.PLoS Med2011;8:e1000440.
34. Cheng S, Xanthakis V, Sullivan LM, Vasan RS. Blood pressure tracking over the adult life course: patterns and correlates in the Framingham heart study.Hypertension2012;60:1393–99.
35. Assmann G, Cullen P, Evers T, Petzinna D, Schulte H. Impor- tance of arterial pulse pressure as a predictor of coronary heart disease risk in PROCAM.Eur Heart J2005;26:2120–26.
36. Franklin SS, Larson MG, Khan SA et al. Does the relation of blood pressure to coronary heart disease risk change with aging? : The Framingham Heart Study.Circulation2001;103:1245–49.
37. Scholes S, Bajekal M, Love H et al. Persistent socioeconomic inequalities in cardiovascular risk factors in England over
1994-2008: a time-trend analysis of repeated cross-sectional data.BMC Public Health2012;12:129.
38. Capewell S, Ford ES. Why have total cholesterol levels declined in most developed countries?BMC Public Health2011;
11:641.
39. Gałecki A, Burzykowski T. Linear Mixed-Effects Models Using R: A Step-by-Step Approach. New York: Springer, 2013.
40. Stang A, Moebus S, Mo¨hlenkamp S et al. Algorithms for convert- ing random-zero to automated oscillometric blood pressure val- ues, and vice versa.Am J Epidemiol2006;164:85–94.
41. Singh-Manoux A, Gue´guen A, Ferrie J et al. Gender differences in the association between morbidity and mortality among middle-aged men and women. Am J Public Health 2008;98:
2251–57.
by guest on February 9, 2014http://ije.oxfordjournals.org/Downloaded from