Novel insights into the pathomechanism of heart failure with preserved ejection fraction (HFpEF) and the transition of hypertensive heart disease to HFpEF
PhD Doctoral Thesis
Dr. Zsuzsanna Szelényi
Semmelweis University
Doctoral School of Basic Medical Sciences
!
Tutor: Dr. András Vereckei PhD, Habil., associate professor Opponents: Dr. Zoltán Giricz PhD, research fellow
Dr. Róbert Sepp PhD, Habil., associate professor Head of Examination Commission: Dr. Péter Kempler DSc, professor Members of Examination Commission:
Dr. Krisztina Madách PhD, associate professor Dr. László Sallai PhD, consultant
Budapest 2016
Introduction
Heart failure is a significant cardiovascular disease nowadays, which affects 1-2% of the adult population in the developed countries. In contrast to heart failure with reduced ejection fraction (HFrEF) - with well known pathogenesis and decreasing morbidity and mortality due to the effective therapy and prevention - the mortality and morbidity of heart failure with preserved ejection fraction (HFpEF) is not decreasing, its prevalence is increasing, its pathogenesis is unclear and evidence based efficient therapy is lacking. Although many clinical trials were conducted or are under way with several compounds, there is still no effective therapy available proven by large randomized clinical trials for HFpEF.
Amongst the diseases leading to HFpEF, hypertension is the most common, thus it can be considered as a precursor condition of HFpEF.
The following relatonship is supposed between the development of HFpEF and the comorbidities: 1) the most common comorbidities behind HFpEF lead to systemic proinflammatory, prothrombotic state and oxidative stress; 2) as a result, coronary microvascular endothelial cells produce reactive oxygen species, thus limiting the bioavailability of nitric oxide (NO) for the surrounding cardiomyocytes; 3) the activity of soluble guanylate cyclase (sGC), the production of cyclic guanosine monophosphate (cGMP) and the activity of protein kinase G (PKG) are reduced in the cardiomyocytes; 4) low PKG activity leads to cardiomyocyte hypertrophy, concentric left ventricular remodeling and increased cardiomyocyte stiffness through hypophosphorylation of titin; 5) stiff cardiomyocytes and the increased collagen deposition by myofibroblasts cause left ventricular diastolic dysfunction.
Increased oxidative stress due to myocardial nitric oxide synthase (NOS) uncoupling plays an important role in the transition of hypertensive heart disease to HFpEF. The main cause of NOS uncoupling is the oxidative depletion of its cofactor, tetrahydrobiopterin (BH4). Myocardial NOS uncoupling might have a decisive role in the pathogenesis of HFpEF on the basis of the effect of BH4
administration in hypertensive animal models of HFpEF, as it reversed left ventricular hypertrophy, fibrosis and diastolic dysfunction in contrast to the pure antihypertensive hydralazine or the nonspecific antioxidants Tempol and tetrahydroneopterin, which have no effect on NOS uncoupling.
Mildly to moderately reduced left ventricular systolic function was reported in hypertension with normal ejection fraction, which is a precursor state of HFpEF, and in HFpEF, however, controversy exists concerning the mechanism. MacIver hypothesized, using a mathematical model of left ventricular contraction, that
preserved absolute radial wall thickening due to left ventricular hypertrophy and not increased radial systolic function compensating for the decreased longitudinal systolic left ventricular function - as previously supposed - is responsible for the normal ejection fraction in HFpEF. According to this hypothesis, left ventricular diastolic dysfunction, which is commonly present in HFpEF, might not necessarily contribute to the pathomechanism of HFpEF.
The guanosine triphosphate cyclohydrolase-1 (GCH-1) gene, encoding guanosine triphosphate cyclohydrolase-1 (GTPCH-1), the rate-limiting enzyme in BH4 synthesis; the gene encoding endothelial NOS (eNOS) and SOD2, the gene encoding manganese superoxide dismutase (MnSOD) are amongst the genes encoding enzymes working together in the defence against oxidative stress and influencing BH4 metabolism and NOS function.
Aims of the study
The aims of this project were:
1. To investigate the role of oxidative stress, inflammation, procoagulant state and neuroendocrine activation in the transition of hypertensive heart disease to HFpEF.
2. To test the validity of the MacIver-Townsend hypothesis in patients with hypertension and preserved ejection fraction.
3. To devise a routine echocardiographic left ventricular systolic function parameter suitable for the detection of subtle left ventricular systolic dysfunction in HFpEF and its precursor conditions.
4. To investigate the genetic predisposition of patients with hypertension and preserved ejection fraction to oxidative stress and its relation to left ventricular diastolic dysfunction.
Methods
The study was conducted from 2007 to 2012 at the 3rd Department of Medicine, Semmelweis University. We prospectively enrolled a total of 112 patients ≥60 years old with normal ejection fraction (>50%). 94 participants were patients with uncomplicated hypertension and 18 participants were age-matched normotensive, healthy controls. Exclusion criteria included prior or manifest heart failure,
diabetes mellitus, more than a mild degree valvular or congenital heart disease, the presence of electrical pacemakers or implantable cardioverter defibrillators, prior cardiovascular surgery, coronary heart disease, atrial tachyarrhythmias, malignant or immunological disease, anticoagulant or antioxidant treatment, acute inflammation. Presence of heart failure was established by using the Framingham criteria.
The average follow-up period was 23.3 ± 12.5 months, the planned 3 year follow-up was carried out in 44 patients, each patient was followed up for at least 1 year. Each patient underwent a physical examination, an electrocardiogram, a detailed echocardiography, a carotid ultrasound, a chest X-ray and a pulse wave velocity (PWV) measurement at the annual follow-up examinations.
1. Biochemical measurements
1) Oxidative stress parameters [protein carbonylation (PC), based on a photometric method, plazma BH4 levels, using high performance liquid chromatography]; 2) inflammatory parameters [C-reactive protein (hs-CRP) concentrations with an ultrasensitive particle-enhanced immunoturbidimetric assay, interleukin-6 (IL-6) and tumor necrosis factor-α (TNF-α) levels by high- sensitivity sandwich ELISA kits]; 3) coagulation parameters [von Willebrand factor antigen (VWF: Ag) level by an in-house sandwich ELISA assay, human tissue plasminogen activator inhibitor type I (PAI-I) concentrations with an ELISA kit, plasma fibrinogen with an ACL TOP coagulation analyzer]; and 4) neuroendocrine parameters [chromogranin A (cGA) levels by a commercially available chromogranin A assay, B-type natriuretic peptide (BNP) levels by immune fluorescence method] were measured according to the instructions of the given manufacturer.
2. Echocardiography
With echocardiography 1) traditional parameters [cardiac dimensions, wall thickness, left ventricular mass (LVM), left ventricular end-diastolic volume (EDV) and end-systolic volume (ESV), stroke volume (SV), left atrial volume (LAV), radial wall thickening, EF (Quinones), EF (biplane Simpson method), left ventricular outflow tract velocity time integral (LVOT-VTI), mitral annulus M- mode systolic excursion (MAPSE), mitral inflow E/A, deceleration time (DT), A wave duration, isovolumic relaxation time (IVRT), pulmonary venous flow
systolic, diastolic velocity, atrial reverse flow velocity and duration]; 2) myocardial velocities with online tissue Doppler imaging [peak systolic mitral annular velocity, peak early (E’) and late (A’) diastolic mitral annular velocity, isovolumic velocity (IVV), isovolumic acceleration (IVA), atrial contraction and relaxation period peak velocity]; 3) myocardial strain (S) and strain rate (SR) values with offline tissue Doppler imaging (peak systolic longitudinal S, endsystolic S, peak systolic, early diastolic and late diastolic SR, peak atrial contraction period, reservoir period and conduit period S and SR; and 4) global left ventricular longitudinal strain (GLS), circumferential and radial S with speckle tracking imaging were measured.
Left ventricular diastolic dysfunction was graded according to the modified Nishimura and Tajik classification published in Seward JB et al.: The Echo Manual 3rd Edition (2006): Grade 1, impaired relaxation pattern with normal filling pressure; Grade 1a, impaired relaxation pattern with increased filling pressure; Grade 2, pseudonormalized pattern; Grade 3, restrictive pattern.
3. Pulse wave velocity measurement
PWV was measured using the PulsePen tonometer.
4. Carotid ultrasonography
The common, internal and external carotids of both left and right sides were studied in all patients. The carotid ultrasonography findings were scored as follows: score 0: absence of plaque and intima media thickness (IMT) <1 mm;
score 1: increased (≥ 1 mm) IMT; score 2: non- stenotic plaque (<50% stenosis);
score 3: stenotic (≥ 50% stenosis) plaque.
5. Molecular biology methods
The prevalence of four single nucleotide polymorphisms (SNPs) (rs841 C>T, rs3783641 A>T, rs10483639 C>G and rs8007267 G>A) of GTPCH-1, one (rs1799983 G>T) of eNOS and one (rs4880 T>C) of MnSOD genes were determined.
Minor allele frequency (MAF) was calculated by dividing the total number of minor alleles by the total number of alleles in each group.
We devised a genetic score based on the MAFs of the investigated SNPs indicating the predisposition of patients to oxidative stress.
The inheritance of the four investigated GTPCH-1 SNPs is strongly linked, and two haplotypes represent 91% of the patients; therefore, we calculated a haplo4 score the following way: if the number of GTPCH-1 minor alleles was 0 or 1, the score was 0; if the number of GTPCH-1 minor alleles was >2, the score was 1.
In the case of rs1799983 eNOS SNP, the presence of minor allele predisposes to oxidative stress; therefore, the homozygotes of each major allele received a score 0, each minor allele heterozygotes received a score 1 and each minor allele homozygotes received a score 2.
In the case of rs4880 MnSOD SNP, as the presence of minor allele is protective against oxidative stress, an inverse score was used: major allele homozygotes received a score 2, minor allele heterozygotes received a score 1 and minor allele homozygotes received a score 0.
Thus, theoretically the total value of the genetic score could have ranged from 0 to 5. Patients were divided into two groups according to the total value of the genetic score: (1) patients with low genetic risk for oxidative stress with a total genetic score value of 0 or 1 and (2) patients with high genetic risk for oxidative stress with a total genetic score value of >2.
6. Statistical analysis
Regarding the biochemical and echocardiography data, all continuous data are expressed as mean ± SD (standard deviation) unless otherwise stated, categorical variables are expressed as proportions. Regarding the genetic results, all variables are expressed as mean ± SD.
During the statistical analyses two-tailed t test, two-tailed t test with Welch’s correction, one-way analyis of variance (ANOVA), Tukey’s multiple comparisons test, Bartlett’s test, non-parametric Kruskal–Wallis ANOVA test, two-way ANOVA for repeated measures, Bonferroni post-hoc test and Pearson correlation were applied. The level of significance was set at p < 0.05.
A receiver-operating characteristic curve (ROC) analysis was performed to determine the most predictive variable of left ventricular systolic dysfunction and the cutoff point of that variable to differentiate normal left ventricular function and left ventricular systolic dysfunction with the highest sensitivity and specificity. Multiple linear regression analyses were carried out including age, sex, body mass index (BMI), left ventricular diastolic dysfunction and left ventricular mass (LVM)/body surface area (BSA) as independent variables.
The comparisons of the allele frequencies between groups and the deviation of these allele frequencies from Hardy–Weinberg equilibrium were made using the chi-square test. The analysis of association of the calculated genetic score based on MAFs of the investigated SNPs indicating predisposition for oxidative stress with the presence of left ventricular diastolic dysfunction was based on 95%
confidence interval (CI) for the disease odds ratio (OR) calculated according to Bland and Altman.
Multivariate logistic regression analysis was carried out with adjustment for age, gender, smoking status, obesity (BMI ≥30 kg/m2), levels of high density lipoprotein (HDL) and low density lipoprotein (LDL) cholesterol, and glomerular filtration rate (GFR).
Pairwise linkage statistics were tested with the Arlequin software package. The results were compared with the latest data found in the HapMap database for general Caucasian population.
Statistical analyses were performed using GraphPad Prism5, Statistica and Statistical Package for the Social Sciences softwares.
Results
40% (38/94) of the patients with hypertension and normal EF had no left ventricular diastolic dysfunction (HTDD- group), 60% (56/94) of the patients had left ventricular diastolic dysfunction (HTDD+ group). From the latter group 54 patients had Grade 1 and 2 patients had Grade 1a diastolic dysfunction. The participants of the study were divided into three groups: 1) control group (n=18), 2) hypertensive group without diastolic dysfunction (HTDD- group) (n=38) and 3) hypertensive group with diastolic dysfunction (HTDD+ group) (n=56 ).
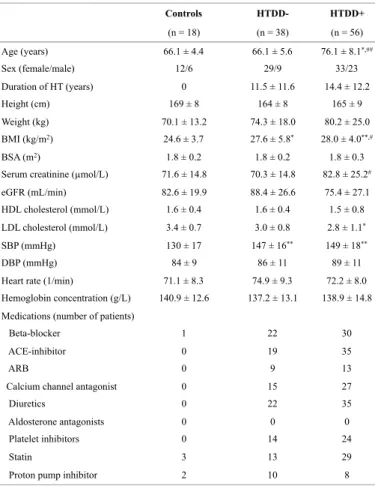
1. Patient characteristics
The control group and both patient groups had similar gender distribution, height, weight, body surface area, diastolic blood pressure, heart rate, estimated glomerular filtration rate values, HDL cholesterol levels and hemoglobin concentration. No significant difference was found between patient groups in terms of medication. There was no difference in age between the control and the whole hypertensive patient group, however, patients in the HTDD+ group were slightly older than those in the control and HTDD- groups. The BMI was higher in both patient groups than in the control group. Serum creatinine levels were
higher in the HTDD+ group than in the control group. Compared to the control group, systolic blood pressure was elevated in both patient groups. The LDL cholesterol was decreased in a borderline significant fashion in the HTDD- group and significantly in the HTDD+ group compared with controls, probably due to the fact that greater number of patients received statins in the hypertensive groups (Table 1).
Table 1. Patient characteristics
!8
Controls HTDD- HTDD+
(n = 18) (n = 38) (n = 56)
Age (years) 66.1 ± 4.4 66.1 ± 5.6 76.1 ± 8.1*,##
Sex (female/male) 12/6 29/9 33/23
Duration of HT (years) 0 11.5 ± 11.6 14.4 ± 12.2
Height (cm) 169 ± 8 164 ± 8 165 ± 9
Weight (kg) 70.1 ± 13.2 74.3 ± 18.0 80.2 ± 25.0
BMI (kg/m2) 24.6 ± 3.7 27.6 ± 5.8* 28.0 ± 4.0**,#
BSA (m2) 1.8 ± 0.2 1.8 ± 0.2 1.8 ± 0.3
Serum creatinine (µmol/L) 71.6 ± 14.8 70.3 ± 14.8 82.8 ± 25.2#
eGFR (mL/min) 82.6 ± 19.9 88.4 ± 26.6 75.4 ± 27.1
HDL cholesterol (mmol/L) 1.6 ± 0.4 1.6 ± 0.4 1.5 ± 0.8
LDL cholesterol (mmol/L) 3.4 ± 0.7 3.0 ± 0.8 2.8 ± 1.1*
SBP (mmHg) 130 ± 17 147 ± 16** 149 ± 18**
DBP (mmHg) 84 ± 9 86 ± 11 89 ± 11
Heart rate (1/min) 71.1 ± 8.3 74.9 ± 9.3 72.2 ± 8.0
Hemoglobin concentration (g/L) 140.9 ± 12.6 137.2 ± 13.1 138.9 ± 14.8 Medications (number of patients)
Beta-blocker 1 22 30
ACE-inhibitor 0 19 35
ARB 0 9 13
Calcium channel antagonist 0 15 27
Diuretics 0 22 35
Aldosterone antagonists 0 0 0
Platelet inhibitors 0 14 24
Statin 3 13 29
Proton pump inhibitor 2 10 8
* p < 0.05, **p < 0.01 vs. control group, #p < 0.05, ##p < 0.01 vs. HTDD- group. ARB: angiotensin II receptor blocker, BMI: body mass index, BSA: body surface area, DBP: diastolic blood pressure, eGFR: estimated glomerular filtration rate, HDL: high density lipoprotein, HT: hypertension, HTDD-:
hypertensive without left ventricular diastolic dysfunction, HTDD+: hypertensive with left ventricular diastolic dysfunction, LDL: low density lipoprotein, SBP: systolic blood pressure
2. Biochemical measurement results
Table 2 shows the biochemical measurement results. There was no significant difference in any of the investigated biochemical parameters between the HTDD+
and HTDD- groups, thus the results presented below are versus the control group.
From the oxidative stress parameters PC and plasma BH4 levels increased in both patient groups. Plasma total biopterin level (BH4 + BH2 + biopterin) increased in the HTDD+ group.
Regarding the inflammatory parameters, only a non-significant increase in IL-6 levels could be detected in the patient groups. While TNF-α levels were increased in both patient groups, CRP levels increased only in the HTDD+ group.
In the coagulation parameters there was no significant difference in fibrinogen and VWF: Ag levels. PAI-I levels increased in both patient groups.
Regarding the neuroendocrine activation parameters, BNP levels increased in both patient groups, cGA levels increased only in the HTDD+ group and showed a non-significant elevation in the HTDD- group.
Table 2. Biochemical results
!9
Parameter Controls HTDD- HTDD+
(n = 18) (n = 38) (n = 56)
PC (µmol/g) 0.19 ± 0.13 0.31 ± 0.21* 0.29 ± 0.25* Plasma BH4
(µmol/mL) 0.92 ± 0.35 1.98 ± 2.10** 2.04 ± 1.99**
Total biopterin
(µmol/mL) 2.01 ± 0.86 3.05 ± 2.80 2.98 ± 2.46* CRP (mg/L) 1.97 ± 1.67 2.91 ± 2.63 4.17 ± 4.21**
IL-6 (pg/mL) 1.88 ± 1.04 2.40 ± 2.91 3.00 ± 4.49 TNF-α (pg/mL) 0.85 ± 0.78 1.75 ± 2.19* 2.26 ± 4.62* Fibrinogen (g/L) 4.03 ± 0.61 4.46 ± 0.93 4.56 ± 0.95 PAI-I (ng/mL) 11.62 ± 5.44 21.11 ± 11.21** 21.23 ± 16.16**
vWF:Ag (%) 168.03 ± 57.59 148.27 ± 39.15 156.58 ± 48.93 cGA (ng/mL) 75.85 ± 17.30 136.04 ± 162.71 148.16 ± 166.34**
BNP (pg/mL) 15.89 ± 9.24 29.80 ± 32.30* 43.49 ± 69.41**
* p < 0.05, **p < 0.01, ***p < 0.001 vs. the control group. BH4: tetrahydrobiopterin, BNP: B-type natriuretic peptide, cGA: chromogranin A, CRP: C-reactive protein, HTDD-: hypertensive without left ventricular diastolic
dysfunction, HTDD+: hypertensive with left ventricular diastolic dysfunction, IL-6: interleukin-6, PAI-I: plasminogen activator inhibitor-I, PC: protein carbonylation, TNF-α: tumor necrosis factor-α , vWF:Ag: von Willebrand factor
antigen
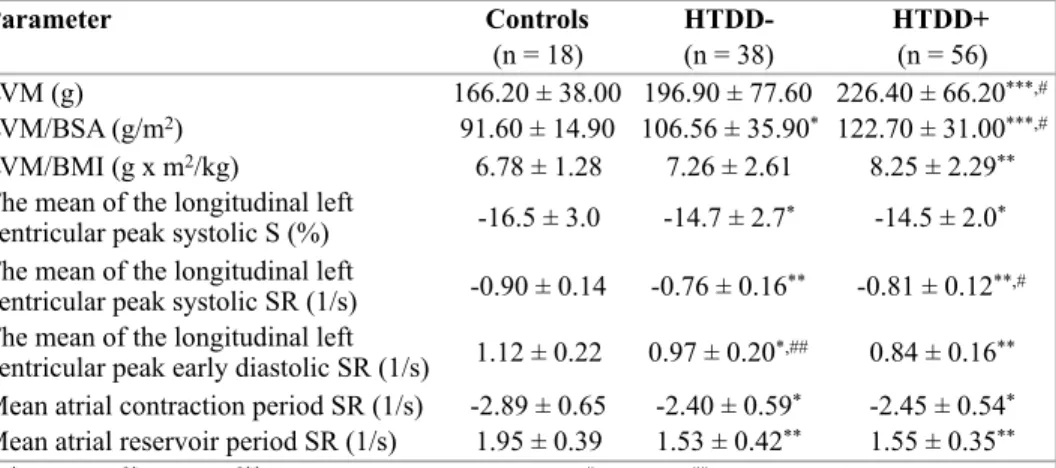
3. Echocardiographic results
No between-groups differences were found in traditional left ventricular systolic function indices [EF (Quinones), EF (Simpson), SV, LVOT-VTI, MAPSE], in left ventricular systolic function indices based on myocardial velocity measurements by tissue Doppler imaging (mitral annulus peak systolic velocity, IVV, IVA), in left ventricular volumes (ESV, EDV), in LAV, LAV/BSA or LAV/BMI.
The more sensitive myocardial deformation parameters (S, SR) however revealed left ventricular systolic dysfunction in the hypertensive patients. The absolute values of the mean of peak longitudinal left ventricular systolic S, systolic and early diastolic SR were reduced in both patient groups compared with controls. The absolute value of the mean of peak longitudinal left ventricular systolic SR was greater, the absolute value of the mean of peak longitudinal left ventricular early diastolic SR was reduced in the HTDD+ group compared with the HTDD- group.
Table 3. Echocardiographic results with myocardial deformation parameters measured by tissue Doppler imaging
LVM increased in the HTDD+ group compared to the control and HTDD−
groups. LVM/BSA increased in both patient groups versus the controls and in the HTDD+ group versus the HTDD- group. LVM/BMI increased in the HTDD+
!10
Parameter Controls HTDD- HTDD+
(n = 18) (n = 38) (n = 56)
LVM (g) 166.20 ± 38.00 196.90 ± 77.60 226.40 ± 66.20***,#
LVM/BSA (g/m2) 91.60 ± 14.90 106.56 ± 35.90* 122.70 ± 31.00***,#
LVM/BMI (g x m2/kg) 6.78 ± 1.28 7.26 ± 2.61 8.25 ± 2.29**
The mean of the longitudinal left
ventricular peak systolic S (%) -16.5 ± 3.0 -14.7 ± 2.7* -14.5 ± 2.0* The mean of the longitudinal left
ventricular peak systolic SR (1/s) -0.90 ± 0.14 -0.76 ± 0.16** -0.81 ± 0.12**,#
The mean of the longitudinal left
ventricular peak early diastolic SR (1/s) 1.12 ± 0.22 0.97 ± 0.20*,## 0.84 ± 0.16**
Mean atrial contraction period SR (1/s) -2.89 ± 0.65 -2.40 ± 0.59* -2.45 ± 0.54* Mean atrial reservoir period SR (1/s) 1.95 ± 0.39 1.53 ± 0.42** 1.55 ± 0.35**
* p < 0.05, **p < 0.01, ***p < 0.001 vs. the control group, #p < 0.05, ##p < 0.01 vs. the HTDD- group.
BMI: body mass index, BSA: body surface area, HTDD-: hypertensive without left ventricular diastolic dysfunction, HTDD+: hypertensive with left ventricular diastolic dysfunction, LVM: left ventricular
mass, S: strain, SR: strain rate
group versus the controls and in a borderline significant manner in the HTDD+
group versus the HTDD- group.
The absolute values of the mean of peak atrial contraction period and reservoir period SR were decreased in both hypertensive groups versus the control group (Table 3).
GLS measured by speckle tracking echocardiography was reduced in both patient groups compared with controls. There were no between-groups differences in circumferential and radial left ventricular peak systolic Ss. GLS indexed to BMI (GLS/BMI) decreased in both patient groups versus the controls. There were no between-groups differences in radial wall thickening (Table 4).
Table 4. Radial wall thickening and myocardial deformation parameters measured by speckle tracking echocardiography
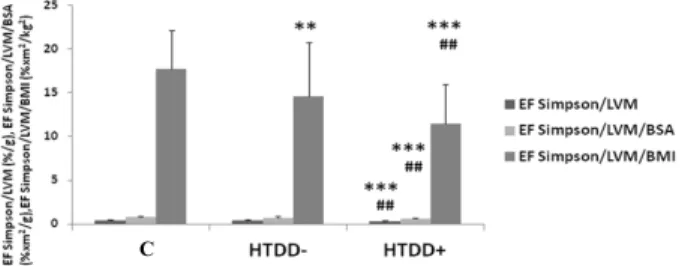
In contrast to EF(S), EF(S) indexed to LVM or LVM and BSA [EF(S)/LVM and EF(S)/LVM/BSA] decreased in the HTDD+ group compared with the control and HTDD- groups. EF(S) indexed to BMI [EF(S)/BMI] decreased in the HTDD+
group, EF(S) indexed to LVM and BMI [EF(S)/LVM/BMI] decreased in both patient groups compared with the controls, and the EF(S)/LVM/BMI further decreased in the HTDD+ group versus the HTDD- group (Figure 1).
!11
Parameter Controls HTDD- HTDD+
(n = 18) (n = 38) (n = 56)
Global longitudinal left ventricular
peak systolic S (%) -17.3 ± 2.2 -15.7 ± 1.8* -15.4 ± 1.9**
Global longitudinal left ventricular
peak systolic S/BMI (m2/kg) -0.72 ± 0.14 -0.59 ± 0.14** -0.55 ± 0.10***
The mean of the circumferential left
ventricular peak systolic S (%) -20.3 ± 3.2 -21.1 ± 4.2 -20.4 ± 4.1 The mean of the radial left ventricular
peak systolic S (%) 29.0 ± 3.3 28.5 ± 5.9 27.1 ± 5.4
Radial wall thickening (mm) 9.8 ± 1.9 10.0 ± 1.9 10.8 ± 1.9
* p < 0.05, **p < 0.01, ***p < 0.001 vs. the control group. BMI: body mass index, HTDD-: hypertensive without left ventricular diastolic dysfunction, HTDD+:
hypertensive with left ventricular diastolic dysfunction, S: strain
!
Figure 1. EF parameters indexed to different parameters describing left ventricular systolic function.
*p < 0.05,**p < 0.01, ***p < 0.001 vs. the control group, #p < 0.05, ##p < 0.01, ###p < 0.001 vs. the HTDD- group. BMI: body mass index, BSA: body surface area, EF(S): ejection fraction measured by the Simpson method, HTDD-: hypertensive without left ventricular diastolic dysfunction, HTDD+: hypertensive with left ventricular diastolic dysfunction, LVM: left ventricular mass, C:
controls
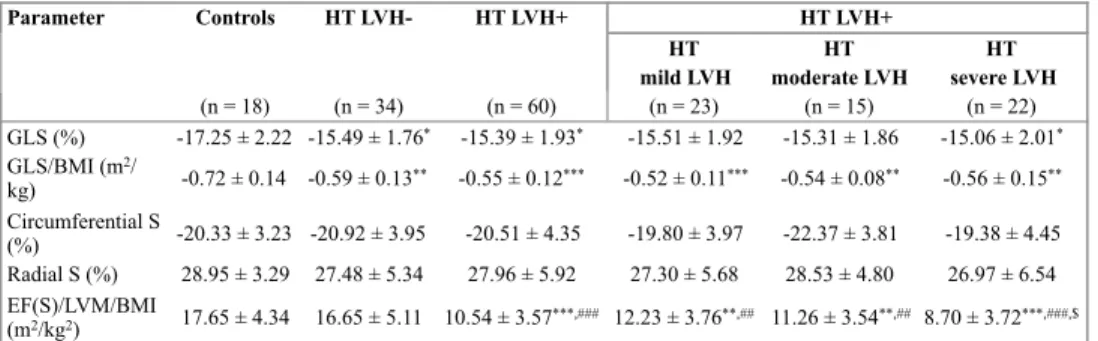
The hypertensive patient group was subdivided into subgroups without left ventricular hypertrophy (LVH) (hypertensive LVH-) and with LVH (hypertensive LVH+) according to their LVM/BSA values. LVH was diagnosed when LVM/
BSA was >96 g/m2 in women and >116 g/m2 in men. The hypertensive LVH+
group was further subdivided into subgroups with mild (96–108 and 116–131 g/
m2), moderate (109–121 and 132–148 g/m2) and severe (>122 and >149 g/m2 for female and male patients, respectively) LVH.
The absolute values of GLS and GLS/BMI and EF(S)/LVM/BMI decreased either significantly or showed a trend to decrease in line with the presence and the degree of LVH. Decreased values were measured in the hypertensive LVH- group versus the controls (Table 5).
In multiple logistic regression analysis involving age, sex and left ventricular diastolic dysfunction as independent variables, male sex and left ventricular diastolic dysfunction were independent predictors of left ventricular systolic dysfunction as expressed by EF(S)/LVM/BMI. In hypertensive patients, left ventricular diastolic dysfunction was identified as an independent predictor of left ventricular systolic dysfunction as expressed by GLS/BMI.
C
Table 5. The relationship of myocardial deformation parameters and EF(S)/LVM/BMI to left ventricular hypertrophy
4. The relation of left ventricular diastolic function to the biochemical parameters during follow-up
During follow-up, we found no change in left ventricular diastolic function in case of 89 patients, in case of 19 patients left ventricular diastolic function deteriorated and in case of 4 patients left ventricular diastolic function improved.
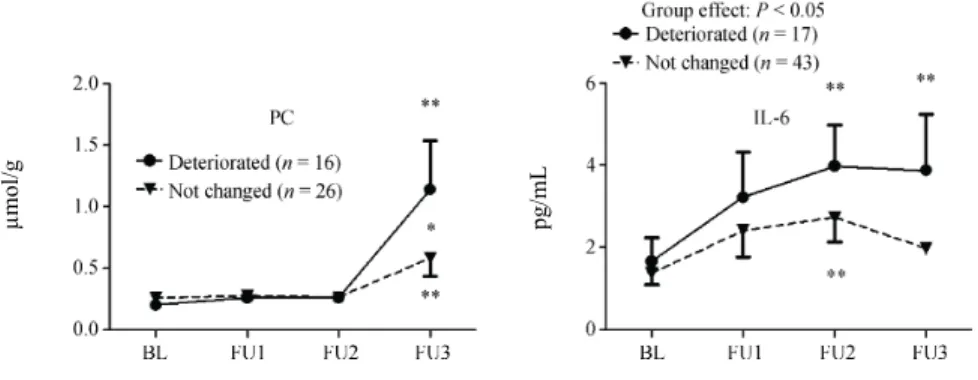
In case of patients whose left ventricular diastolic function deteriorated during the follow-up, we found increased PC and IL-6 levels compared to the patients’ own baseline values and to the respective values of those patients whose left ventricular diastolic function remained unchanged (Figure 2). During the follow- up, there was no difference in any other biochemical parameters between the two groups of patients whose left ventricular diastolic function deteriorated and remained unchanged.
!13
Parameter Controls HT LVH- HT LVH+ HT LVH+
HT HT HT
mild LVH moderate LVH severe LVH
(n = 18) (n = 34) (n = 60) (n = 23) (n = 15) (n = 22)
GLS (%) -17.25 ± 2.22 -15.49 ± 1.76* -15.39 ± 1.93* -15.51 ± 1.92 -15.31 ± 1.86 -15.06 ± 2.01* GLS/BMI (m2/
kg) -0.72 ± 0.14 -0.59 ± 0.13** -0.55 ± 0.12*** -0.52 ± 0.11*** -0.54 ± 0.08** -0.56 ± 0.15**
Circumferential S
(%) -20.33 ± 3.23 -20.92 ± 3.95 -20.51 ± 4.35 -19.80 ± 3.97 -22.37 ± 3.81 -19.38 ± 4.45 Radial S (%) 28.95 ± 3.29 27.48 ± 5.34 27.96 ± 5.92 27.30 ± 5.68 28.53 ± 4.80 26.97 ± 6.54 EF(S)/LVM/BMI
(m2/kg2) 17.65 ± 4.34 16.65 ± 5.11 10.54 ± 3.57***,### 12.23 ± 3.76**,## 11.26 ± 3.54**,## 8.70 ± 3.72***,###,$
* p < 0.05, **p < 0.01, ***p < 0.001 vs. the control group, #p < 0.05, ##p < 0.01, ###p < 0.001 vs. the HT LVH- group,
$ p < 0.05 vs. the HT mild LVH subgroup. BMI: body mass index, circumferential strain: mean of the circumferential left ventricular peak systolic strain, EF(S): ejection fraction measured by the Simpson method, GLS: global longitudinal left ventricular strain, HT: hypertension, LVH: left ventricular hypertrophy, LVM: left ventricular mass, radial strain: mean of
the radial left ventricular peak systolic strain, S: strain
Figure 2. .Comparison of protein carbonylation and IL-6 levels during follow-up in patients whose left ventricular diastolic function remained unchanged or deteriorated. *p < 0.05, **p < 0.01.BL:
baseline, IL-6: interleukin-6, FU: follow-up, PC: protein carbonylation
5. PWV and carotid score
The PWV increased in the HTDD+ group compared to the control group, indicating the presence of atherosclerosis in the great arteries. The PWV of both patient groups combined was also greater than that of the control group.
The carotid score was greater in the HTDD+ group versus both the control and the HTDD-groups (Figure 3).
!Figure 3. PWV and carotid score results in the different groups. *p < 0.05 vs. the control group, #p <
0.05 vs. the HTDD- group. HTDD-: hypertensive without left ventricular diastolic dysfunction, HTDD+: hypertensive with left ventricular diastolic dysfunction, C: controls, PWV: pulse wave velocity
!14
PWV (m/s), carotid score
Szelényi Z, et al. LV dysfunction in hypertension is due to oxidative stress 7
Figure 1. Comparison of protein carbonylation and IL-6 levels during follow-up in patients whose LV diastolic function remained unchanged or deteriorated. *P < 0.05, **P < 0.01. The table includes the results of only those patients who had at least three measurements of the investigated parameters during the follow-up. BL: baseline; IL-6: interleukin-6; FU: follow-up; LV: left ventricular; PC: protein car- bonylation.
Figure 2. Pulse wave velocity and carotid score results. *P <
0.05 versus the control group, #P < 0.05 versus the HTDD− group.
HTDD−: hypertensive patients without left ventricular diastolic dysfunction; HTDD+: hypertensive patients with left ventricular diastolic dysfunction; PWV: pulse wave velocity.
correlated inversely with the absolute values of longitudinal LV early diastolic myocardial deformation (SR).
cGA levels showed a positive correlation with the atrial conduction time estimated from the [(P wave-LA contrac- tion) − (P wave-right atrial contraction)] interval and the carotid score. Plasma BNP level showed a negative correla- tion with the absolute values of atrial myocardial deforma- tion parameters (Table 3) and with some more traditional parameters of LV systolic and diastolic function, such as mitral annulus M-mode excursion, mitral annulus peak sys- tolic velocity, mean E’. Plasma BNP level also showed a negative correlation with some recently proposed parame- ters of LV systolic dysfunction such as EF Simpson/LVM and EF Simpson/LVM/BSA.[25] Plasma BNP level showed a positive correlation with LAV, LAV/BSA, LVM/BSA and mean E/E’.
Table 4. The most relevant correlations.
Correlated parameters P r
BH4 with mean longitudinal LV peak S 0.02 0.251 With mean longitudinal LV peak systolic SR 0.002 0.329 With mean longitudinal LV peak early diastolic wave SR 0.008 −0.285 PAI-I with mean longitudinal LV peak S 0.014 0.232 With mean longitudinal LV peak early diastolic wave SR 0.009 −0.246 IL-6 with mean longitudinal LV peak S 0.008 0.249 With mean longitudinal LV peak early diastolic wave SR 0.009 −0.285 TNF-α with mean longitudinal LV peak S 0.025 0.213 cGA with (P wave-LAcontr int.) − (P wave-RAcontr int.) 0.026 0.22
With carotid score 0.018 0.254
BNP with mean atrial contraction period peak SR 0.004 0.274 With mean LA reservoir period peak S 0.016 −0.23 With mean LA reservoir period peak SR 0.004 −0.272 With mean mitral annulus M-mode peak excursion 0.036 −0.21 With mean mitral annulus peak systolic velocity < 0.001−0.352
With mean E’ 0.001 −0.301
With mean E/E’ 0.022 0.218
With LVM/BSA 0.028 0.257
With EF Simpson/LVM 0.03 −0.207
With EF Simpson/LVM/BSA 0.013 −0.243
With LAV 0.001 0.309
With LAV/BSA < 0.001 0.35
PWV with BNP 0.035 0.239
With LVM 0.041 0.23
With EF Simpson 0.009 −0.294
With ESV 0.01 0.293
With mean longitudinal LV peak S < 0.001 0.535 With mean longitudinal LV peak systolic SR < 0.001 0.51 With mean longitudinal LV peak early diastolic wave SR < 0.001−0.496 With mean atrial reservoir period peak S 0.012 −0.282 With mean atrial reservoir period peak SR < 0.001−0.389 BH4: tetrahydrobiopterin; BNP: B-type natriuretic peptide; BSA: body surface area; cGA: chromogranin A; contr: contraction; E: transmitral flow peak early diastolic filling velocity; E’: mitral annular peak early diastolic filling velocity; EF: ejection fraction; ESV: left ventricular end-systolic volume; IL-6: interleukin-6; Int.: interval; LA: left atrium; LAV: left atrial volume; LV: left ventricle; LVM: left ventricular mass; PAI-I: plasminogen activator inhibitor type I; S: strain; SR: strain rate; RA: right atrium; TNF-α:
tumor necrosis factor-α.
µmol/g pg/mL
C
Carotid score PWV
6. Relevant correlations among the investigated parameters
A great number of significant correlations were found between the biochemical and the echocardiography parameters. Typically, the increase of oxidative stress, inflammatory parameters, PAI-I and BNP correlated with the decrease of systolic and diastolic left ventricular function and the increase of BNP and PC correlated with the decrease of atrial function.
BH4 and PAI-I levels showed an inverse correlation with the absolute values of longitudinal left ventricular systolic and early diastolic myocardial deformation parameters.
TNF-α and IL-6 levels also showed an inverse correlation with the absolute values of longitudinal left ventricular systolic myocardial deformation parameters.
Similarly, IL-6 levels correlated inversely with the absolute values of longitudinal left ventricular early diastolic myocardial deformation (SR).
cGA levels showed a positive correlation with the carotid score and the atrial conduction time interval.
Plasma BNP levels showed a negative correlation with the absolute values of atrial myocardial deformation parameters and with some more traditional parameters of left ventricular systolic and diastolic function, such as MAPSE, mitral annular peak systolic velocity, mean E’. Plasma BNP level also showed a negative correlation with EF(S)/LVM and EF(S)/LVM/BSA. Plasma BNP level showed a positive correlation with LAV, LAV/BSA, LVM/BSA and mean E/E’.
PWV showed a strong inverse correlation with the absolute values of left ventricular systolic and early diastolic myocardial deformation parameters and with EF(S). PWV showed a negative correlation with the mean atrial reservoir period peak S and SR and a positive correlation with ESV, LVM and BNP.
7. The best routine echocardiography parameter for the detection of subtle left ventricular systolic dysfunction
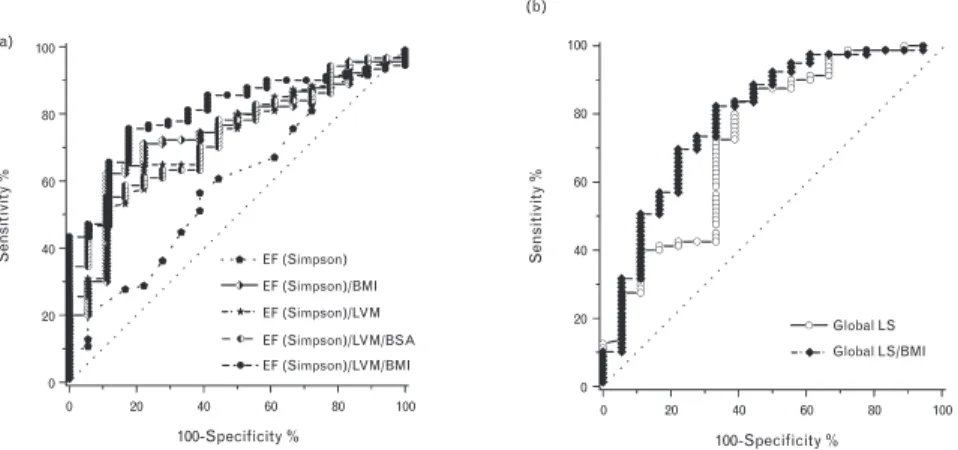
Figure 4a shows ROC curves of EF(S) indexed to LVM, BMI and/or BSA [EF(S)/LVM, EF(S)/BMI, EF(S)/LVM/BSA, EF(S)/LVM/BMI], which were decreased either in the HTDD+ group or in both patient groups compared with the controls. EF(S)/LVM/BMI was the best parameter to detect left ventricular systolic dysfunction and only EF(S)/LVM/BMI correlated (p = 0.016) with GLS.
The best cutoff point for EF(S)/LVM/BMI was <15.73 m2/kg2 (AUC: 0.804, p <
0.001, sensitivity: 75.6%, specificity: 82.4%).
The ROC analysis demonstrated that GLS/BMI was a better myocardial deformation parameter than GLS to detect left ventricular systolic dysfunction
(AUC: 0.79 vs. 0.73, p < 0.001 vs. p < 0.01, sensitivity: 73.4% vs. 72.5%, specificity: 72.2% vs. 66.7%; the best cutoff value for GLS/BMI was >-0.646 m2/ kg, the best cutoff value for GLS was >-16.4%) (Figure 4b).
The results verify that EF(S)/LVM/BMI can as accurately detect subtle left ventricular systolic dysfunction as the best left ventricular systolic myocardial deformation parameter, GLS/BMI.
Figure 4. ROC curves of EF(S) indexed to LVM, BMI and/or BSA and ROC curves of GLS and GLS indexed to BMI. (a) Among EF(S) and EF(S) indexed to different parameters, the best echocardiographic parameter to detect left ventricular systolic dysfunction was EF(S)/LVM/BMI.
(b) ROC curves of GLS and GLS/BMI demonstrating that GLS/BMI detects left ventricular systolic dysfunction better than GLS. BMI: body mass index, BSA: body surface area, EF: ejection fraction, LS: longitudinal strain, LVM: left ventricular mass
8. Association of the investigated individual gene polymorphisms with hypertension and left ventricular diastolic dysfunction
After all six SNPs were assessed, we confirmed that all alleles were in Hardy–
Weinberg equilibrium. In none of the investigated individual SNPs was a significant between-groups difference in MAFs found
Our linkage disequilibrium analysis demonstrated a strong linkage among all four tested GTPCH SNPs according to the results published by Doehring et al.
and to the data of the latest HapMap database.
As it was expected, none of the investigated individual SNPs had significantly different MAF compared with controls or was significantly associated with
!16
and circumferential S has similar excellent prognostic value to midwall fractional shortening [25].
Limitations
Our suggestion that, unlike ejection fraction, the appli- cation of ejection fraction(S)/LVM/BMI is a simple routine tool to diagnose subtle left ventricular systolic dysfunction should be tested in a greater number of patients.
Myocardial deformation parameters are load-dependent (an increased preload increases, an increased afterload decreases the absolute value of myocardial S), but we did not measure the relation of myocardial deformation to loading conditions. However, the participants were either normal controls or patients with uncomplicated hypertension without or with mild left ventricular diastolic dysfunction, and none of them had heart failure. Both increased and decreased preload are unlikely, as only two patients had grade 1a left ventricular diastolic dysfunc- tion suggesting increased left atrial filling pressure, and there were no between-groups differences in EDV and left atrial volumes and in LVOT velocities and LVOT-VTI as well. It has been consistently demonstrated that meridional (longitudinal) and circumferential end-systolic wall stresses were lower in hypertensive patients with LVH than in normal controls, indicating decreased afterload. Thus, the decreased left ventricular longitudinal and circumferential systolic function cannot be attributed to increased afterload in hypertensive patients with LVH [4,5,21]. It was also demonstrated that the systolic wall stress was either signifi- cantly decreased, or showed a trend for decrease, but was not increased in hypertensive patients without LVH [5] or in a hypertensive study population in which only 25% had LVH [21] compared with that of the control group. Long-axis fractional shortening was not closely related to meridional (longitudinal) stress [4], suggesting that factors other than afterload have a significant influence on longitudinal frac- tional shortening. In summary, although an important limitation of our study is that we did not measure myo- cardial deformation simultaneously with systolic wall stress, it seems unlikely that loading conditions significantly influ- enced the conclusions of this study.
Another limitation of the study is that patients with intra- ventricular conduction disturbances were not excluded from the study. However, only a small minority of hypertensive patients (10.5% in the HTDD-negative and 10.7% in the HTDD-positive groups) had intraventricular conduction disturbance. The STI strain results were the same after exclusion of these patients from the statistical analysis; there- fore, we could rule out that intraventricular conduction disturbance in a few patients biased the results.
The cardiovascular event rate was very low in our relatively healthy hypertensive population with uncompli- cated hypertension; therefore, this patient cohort was not suitable for the investigation of the prognostic impact of ejection fraction(S)/LVM/BMI on cardiovascular morbidity.
Slow and incomplete inclusion of participants into the study was an additional limitation.
In conclusion, our results verify the validity of MacIver–
Townsend hypothesis, which is based on a mathematical model of left ventricular contraction, in patients with hyper- tension and normal ejection fraction, namely that reduced longitudinal left ventricular systolic function and yet normal ejection fraction is not due to a compensatory increase in radial and circumferential left ventricular systolic function but to preserved absolute radial wall thickening caused by LVH. Mild to moderate impairment of left ventricular systolic function can be detected by ejection fraction(S)/LVM/BMI but not by ejection fraction measured by any method in these patients and probably in HFPEF as well.
0
Sensitivity %
0 20 40 60 80 100
Sensitivity %
0 20 40 60 80 100
20 40 60
100-Specificity %
80 100
100-Specificity % Global LS EF (Simpson) EF (Simpson)/BMI EF (Simpson)/LVM EF (Simpson)/LVM/BSA EF (Simpson)/LVM/BMI
Global LS/BMI
0 20 40 60 80 100
(a)
(b)
FIGURE 2Receiver-operator characteristic curves of ejection fraction Simpson and global longitudinal left ventricular peak systolic strain indexed to different parameters. (a) Among EF Simpson and EF Simpson indexed to different parameters, the best echocardiographic parameter to detect LV systolic dysfunction was EF Simpson/LVM/BMI with a cutoff point of<15.73 m2/kg2(AUC: 0.804,P<0.001, sensitivity: 75.6%, specificity: 82.4%). The AUCs andPvalues of other investigated parameters were the following: 0.594,P¼0.21 (EF Simpson); 0.726,P<0.01 (EF Simpson/LVM); 0.743,P<0.01 (EF Simpson/BMI); 0.738,P<0.01 (EF Simpson/LVM/
BSA), respectively. (b) ROC curves of GLS and GLS/BMI demonstrating that GLS/BMI detects better LV systolic dysfunction than GLS (AUC: 0.79 vs. 0.73,P<0.001 vs.
P<0.01, sensitivity: 73.4 vs. 72.5%, specificity: 72.2 vs. 66.7%.; the cutoff value for GLS/BMI was>-0.646 m2/kg for GLS was>-16.4%). These data show that EF Simp- son/BMI can detect LV systolic dysfunction at least as well or even slightly more accurately than the better myocardial deformation parameter GLS/BMI.
Szele´nyiet al.
Copyright © 2015 Wolters Kluwer Health, Inc. All rights reserved.
and circumferential S has similar excellent prognostic value to midwall fractional shortening [25].
Limitations
Our suggestion that, unlike ejection fraction, the appli- cation of ejection fraction(S)/LVM/BMI is a simple routine tool to diagnose subtle left ventricular systolic dysfunction should be tested in a greater number of patients.
Myocardial deformation parameters are load-dependent (an increased preload increases, an increased afterload decreases the absolute value of myocardial S), but we did not measure the relation of myocardial deformation to loading conditions. However, the participants were either normal controls or patients with uncomplicated hypertension without or with mild left ventricular diastolic dysfunction, and none of them had heart failure. Both increased and decreased preload are unlikely, as only two patients had grade 1a left ventricular diastolic dysfunc- tion suggesting increased left atrial filling pressure, and there were no between-groups differences in EDV and left atrial volumes and in LVOT velocities and LVOT-VTI as well. It has been consistently demonstrated that meridional (longitudinal) and circumferential end-systolic wall stresses were lower in hypertensive patients with LVH than in normal controls, indicating decreased afterload. Thus, the decreased left ventricular longitudinal and circumferential systolic function cannot be attributed to increased afterload in hypertensive patients with LVH [4,5,21]. It was also demonstrated that the systolic wall stress was either signifi- cantly decreased, or showed a trend for decrease, but was not increased in hypertensive patients without LVH [5] or in a hypertensive study population in which only 25% had LVH [21] compared with that of the control group. Long-axis fractional shortening was not closely related to meridional (longitudinal) stress [4], suggesting that factors other than afterload have a significant influence on longitudinal frac- tional shortening. In summary, although an important limitation of our study is that we did not measure myo- cardial deformation simultaneously with systolic wall stress, it seems unlikely that loading conditions significantly influ- enced the conclusions of this study.
Another limitation of the study is that patients with intra- ventricular conduction disturbances were not excluded from the study. However, only a small minority of hypertensive patients (10.5% in the HTDD-negative and 10.7% in the HTDD-positive groups) had intraventricular conduction disturbance. The STI strain results were the same after exclusion of these patients from the statistical analysis; there- fore, we could rule out that intraventricular conduction disturbance in a few patients biased the results.
The cardiovascular event rate was very low in our relatively healthy hypertensive population with uncompli- cated hypertension; therefore, this patient cohort was not suitable for the investigation of the prognostic impact of ejection fraction(S)/LVM/BMI on cardiovascular morbidity.
Slow and incomplete inclusion of participants into the study was an additional limitation.
In conclusion, our results verify the validity of MacIver–
Townsend hypothesis, which is based on a mathematical model of left ventricular contraction, in patients with hyper- tension and normal ejection fraction, namely that reduced longitudinal left ventricular systolic function and yet normal ejection fraction is not due to a compensatory increase in radial and circumferential left ventricular systolic function but to preserved absolute radial wall thickening caused by LVH. Mild to moderate impairment of left ventricular systolic function can be detected by ejection fraction(S)/LVM/BMI but not by ejection fraction measured by any method in these patients and probably in HFPEF as well.
0
Sensitivity %
0 20 40 60 80 100
Sensitivity %
0 20 40 60 80 100
20 40 60
100-Specificity %
80 100
100-Specificity % Global LS EF (Simpson) EF (Simpson)/BMI EF (Simpson)/LVM EF (Simpson)/LVM/BSA EF (Simpson)/LVM/BMI
Global LS/BMI
0 20 40 60 80 100
(a)
(b)
FIGURE 2Receiver-operator characteristic curves of ejection fraction Simpson and global longitudinal left ventricular peak systolic strain indexed to different parameters. (a) Among EF Simpson and EF Simpson indexed to different parameters, the best echocardiographic parameter to detect LV systolic dysfunction was EF Simpson/LVM/BMI with a cutoff point of<15.73 m2/kg2(AUC: 0.804,P<0.001, sensitivity: 75.6%, specificity: 82.4%). The AUCs andPvalues of other investigated parameters were the following: 0.594,P¼0.21 (EF Simpson); 0.726,P<0.01 (EF Simpson/LVM); 0.743,P<0.01 (EF Simpson/BMI); 0.738,P<0.01 (EF Simpson/LVM/
BSA), respectively. (b) ROC curves of GLS and GLS/BMI demonstrating that GLS/BMI detects better LV systolic dysfunction than GLS (AUC: 0.79 vs. 0.73,P<0.001 vs.
P<0.01, sensitivity: 73.4 vs. 72.5%, specificity: 72.2 vs. 66.7%.; the cutoff value for
GLS/BMI was>-0.646 m2/kg for GLS was>-16.4%). These data show that EF Simp- son/BMI can detect LV systolic dysfunction at least as well or even slightly more accurately than the better myocardial deformation parameter GLS/BMI.
Szele´nyiet al.
1968 www.jhypertension.com Volume 33"Number 9"September 2015
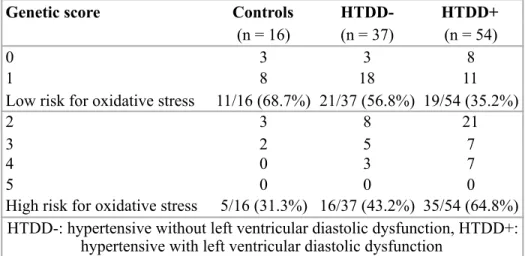
hypertension and left ventricular diastolic dysfunction. The distribution of genetic score - based on the total number of minor alleles of the investigated SNPs, characterizing predisposition to oxidative stress, devised by us - in different groups is shown in Table 6. In line with the presence of hypertension and left ventricular diastolic dysfunction the percentage of low risk patients for oxidative stress decreased and the percentage of high risk patients for oxidative stress increased.
Table 6. Genetic score distribution in the different groups
Patients with a high genetic score had a significantly increased risk for HTDD+
even after adjustment for age, gender, smoking status, obesity, levels of HDL and LDL cholesterol and GFR. Patients with a high genetic score showed only a trend for increased risk for hypertension without left ventricular diastolic dysfunction (Table 7).
!17
Genetic score Controls HTDD- HTDD+
(n = 16) (n = 37) (n = 54)
0 3 3 8
1 8 18 11
Low risk for oxidative stress 11/16 (68.7%) 21/37 (56.8%) 19/54 (35.2%)
2 3 8 21
3 2 5 7
4 0 3 7
5 0 0 0
High risk for oxidative stress 5/16 (31.3%) 16/37 (43.2%) 35/54 (64.8%) HTDD-: hypertensive without left ventricular diastolic dysfunction, HTDD+:
hypertensive with left ventricular diastolic dysfunction
Table 7. Association of genetic risk for oxidative stress with left ventricular diastolic function
Conclusions
The following new statements can be made based on the results of our study conducted in patients with hypertension and preserved ejection fraction- considered as a precursor condition of HFpEF - and normotensive controls, investigating the pathomechanism of HFpEF:
1. Increased oxidative stress - particularly myocardial oxidative stress due to myocardial NOS uncoupling - and inflammation might play a pathogenetic role in subtle left ventricular systolic dysfunction despite preserved ejection fraction and in the development of left ventricular diastolic dysfunction and its progression in hypertensive patients. Oxidative stress and inlammation might contribute to progressive atherosclerosis in the great arteries as well. Subtle left ventricular systolic dysfunction and the deterioration of left ventricular diastolic function are associated with progressive left ventricular hypertrophy, neuroendocrine activation and atrial dysfunction, and all these factors are considered to be important determinants of the transition of hypertensive heart disease to HFpEF. Oxidative stress and inflammation therefore might play an important role in the transition of hypertensive heart disease to HFpEF.
2. Although there are some published data from previous human studies explaining the possible mechanism of preserved ejection fraction in HFpEF, partly supporting certain elements of the MacIver-Townsend hypothesis, this is the first direct testing of the MacIver-Townsend hypothesis in a human study.
Our results verified the MacIver-Townsend hypothesis, based on a mathematical model of left ventricular contraction, in hypertensive patients with normal ejection fraction, stating that preserved absolute radial wall
!18
Patient group Low risk
(%) High risk
(%) OR (95% CI) p Adjusted OR
(95% CI)* p
Controls (n = 16) 11 (68.7) 5 (31.3) 1
HTDD- (n = 37) 21 (56.8) 16 (43.2) 1.68 (0.48-5.80) 0.544 1.66 (0.38-7.16) 0.498 HTDD+ (n = 54) 19 (35.2) 35 (64.8) 4.05 (1.23-13.40) 0.023 4.79 (1.12-20.54) 0.035 CI: confidence interval, HTDD-: hypertensive without left ventricular diastolic dysfunction, HTDD+:
hypertensive with left ventricular diastolic dysfunction, OR: odds ratio, p values denoted with bold numbers represent significant differences, *: after adjustment for age, gender, smoking status, obesity,
levels of HDL and LDL cholesterol and GFR
thickening due to left ventricular hypertrophy and not increased radial or circumferential systolic function is responsible for the normal ejection fraction despite mildly decreased longitudinal systolic function.
3. In contrast to ejection fraction, EF(S)/LVM/BMI, a new routine echocardiography parameter, applied in our study, could detect subtle left ventricular systolic dysfunction with the same accuracy as the more complicated and still not routinely applied myocardial deformation parameters (strain, strain rate) in hypertensive patients with preserved ejection fraction. If further studies conducted in a great number of patients, including patients with HFpEF, support our results, EF(S)/LVM/BMI might be a new, simple, routine echocardiography parameter for examining left ventricular systolic function in HFpEF and its precursor states.
4. Our studies verified that the increased oxidative stress in hypertensive patients with normal ejection fraction, a potential precursor condition of HFpEF, may be partly genetically determined. The genetic risk for oxidative stress increased with the degree of left ventricular diastolic dysfunction. The genetic score, based on the MAFs of six investigated SNPs of genes encoding enzymes related to oxidative stress, BH4 metabolism and NOS function, together with the markers of left ventricular diastolic dysfunction and atrial dysfunction and with LVM might be a useful marker of the transition of hypertensive heart disease to HFpEF.
List of publications
Publications related to the dissertation:
1. Szelényi Z*, Fazakas Á*, Szénási G, Kiss M, Tegze N, Fekete BC, Nagy E, Bodó I, Nagy B, Molvarec A, Patócs A, Pepó L, Prohászka Z, Vereckei A.
(2015) Inflammation and oxidative stress caused by nitric oxide synthase uncoupling might lead to left ventricular diastolic and systolic dysfunction in patients with hypertension. J Geriatr Cardiol, 12: 1-10. IF: 1,393 *The first two authors contributed equally to this work
2. Szelényi Z, Fazakas Á, Szénási G, Tegze N, Fekete B, Molvarec A, Hadusfalvy-Sudár S, Jánosi O, Kiss M, Karádi I, Vereckei A. (2015) The mechanism of reduced longitudinal left ventricular systolic function in
hypertensive patients with normal ejection fraction. J Hypertens, 33: 1962-9.
IF: 5,062
3. Fazakas Á*, Szelényi Z*, Szénási G, Nyírő G, Szabó PM, Patócs A, Tegze N, Fekete BC, Molvarec A, Nagy B, Jakus J, Örsi F, Karádi I, Vereckei A. (2016) Genetic predisposition in patients with hypertension and normal ejection fraction to oxidative stress. J Am Soc Hypertens, 10: 124-32. IF: 2,656 *The first two authors contributed equally to this work
Publications not related to the dissertation:
1. Apponyi Gy, Pilecky D, Szelényi Zs, Horváth A, Heltai K, Szilágyi Sz, Becker D, Gellér L, Merkely B, Zima E. (2011) Terápiás hypothermia-indukálta EKG- változások retrospektív vizsgálata – Első tapasztalatok. Cardiologia Hungarica, 41: 225-230. IF: N/A
2. Szelényi Z, Duray G, Katona G, Fritúz G, Szegő E, Kovács E, Szénási G, Vereckei A. (2013) Comparison of the "real-life" diagnostic value of two recently published electrocardiogram methods for the differential diagnosis of wide QRS complex tachycardias. Acad Emerg Med, 20: 1121-30. IF: 2,198 3. Szelényi Zs, Vereckei A. Az oxidatív stressz és gyulladás patogenetikai szerepe
a hypertoniás betegek bal kamra dysfunctiójában és a megőrzött ejectiós frakciójú szívelégtelenségben. In: Blázovics A, Mézes M, Rőth E (szerk.), Oxidatív stressz és betegségek. Szent István Egyetemi Kiadó, Gödöllő, 2015:
89-95. IF: N/A
4. Szabolcs Z, Szelényi Zs. Szívátültetés. In: Tulassay Zs (szerk), A belgyógyászat alapjai. Medicina Könyvkiadó Zrt, Budapest, 2016: 609-610.
IF: N/A
5. Vereckei A, Katona G, Szelényi Z, Szénási G, Kozman B, Karádi I. (2016) The role of electrocardiography in the elaboration of a new paradigm in cardiac resynchronization therapy for patients with nonspecific intraventricular conduction disturbance. J Geriatr Cardiol, 13: 118-25. IF: 1,393