Research Article
Measurement of the Red Blood Cell
Distribution Width Improves the Risk Prediction in Cardiac Resynchronization Therapy
András Mihály Boros,
1Péter Perge,
1Zsigmond Jenei,
2Júlia Karády,
1Endre Zima,
1Levente Molnár,
1Dávid Becker,
1László Gellér,
1Zoltán Prohászka,
2Béla Merkely,
1and Gábor Széplaki
11Heart and Vascular Center, Semmelweis University, V´arosmajor Utca 68, Budapest 1122, Hungary
2Third Department of Internal Medicine, Semmelweis University, Budapest, Hungary
Correspondence should be addressed to B´ela Merkely; merkely.bela@kardio.sote.hu Received 14 October 2015; Revised 7 December 2015; Accepted 24 December 2015 Academic Editor: Alberto Marra
Copyright © 2016 Andr´as Mih´aly Boros et al. This is an open access article distributed under the Creative Commons Attribution License, which permits unrestricted use, distribution, and reproduction in any medium, provided the original work is properly cited.
Objectives. Increases in red blood cell distribution width (RDW) and NT-proBNP (N-terminal pro-B-type natriuretic peptide) predict the mortality of chronic heart failure patients undergoing cardiac resynchronization therapy (CRT). It was hypothesized that RDW is independent of and possibly even superior to NT-proBNP from the aspect of long-term mortality prediction.Design.
The blood counts and serum NT-proBNP levels of 134 patients undergoing CRT were measured. Multivariable Cox regression models were applied and reclassification analyses were performed.Results. After separate adjustment to the basic model of left bundle branch block, beta blocker therapy, and serum creatinine, both the RDW>13.35% and NT-proBNP>1975 pg/mL predicted the 5-year mortality (𝑛 = 57). In the final model including all variables, the RDW [HR = 2.49 (1.27–4.86);𝑝 = 0.008] remained a significant predictor, whereas the NT-proBNP [HR = 1.18 (0.93–3.51);𝑝 = 0.07] lost its predictive value. On addition of the RDW measurement, a 64% net reclassification improvement and a 3% integrated discrimination improvement were achieved over the NT-proBNP-adjusted basic model.Conclusions. Increased RDW levels accurately predict the long-term mortality of CRT patients independently of NT-proBNP. Reclassification analysis revealed that the RDW improves the risk stratification and could enhance the optimal patient selection for CRT.
1. Introduction
Chronic heart failure is characterized by reduced cardiac contractility and an impaired stroke volume. These changes activate the sympathetic nervous system and cause a volume redistribution and overload. The intravascular fluid excess elevates the concentrations of circulating natriuretic peptides, such as the N-terminal pro-B-type natriuretic peptide (NT- proBNP), to compensate the hemodynamic alterations. NT- proBNP is therefore regarded as a disease-specific biomarker and is routinely used in diagnosis, therapy guidance, and prognosis estimation for chronic heart failure patients [1].
Nevertheless, NT-proBNP mirrors only the actual volume homeostasis, which is a rather simplified aspect of the multifaceted pathophysiology.
The red blood cell distribution width (RDW) is a measure of the variation of the erythrocyte size, and an increased RDW is also linked to a poor prognosis in cardiovascular diseases, such as coronary artery disease [2], acute myocardial infarction [3], stroke [4], and chronic heart failure [5–8].
Interestingly, diabetes mellitus [9], liver diseases [10], and renal dysfunctions [11] may likewise lead to RDW elevations, the available evidence therefore suggesting that an increased RDW reflects the presence and extent of a systemic injury caused by the underlying disease.
Cardiac resynchronization therapy (CRT) is widely used to treat chronic heart failure patients with electromechanical dyssynchrony and a deteriorating functional status [12]. It is well established that CRT improves the cardiac function,
Volume 2016, Article ID 7304538, 13 pages http://dx.doi.org/10.1155/2016/7304538
exerts reverse remodeling, and decreases the need for hospi- talization, though the mortality remains rather high [13].
The aim of this study was to measure the RDW and NT- proBNP levels before CRT, for we hypothesized that these biomarkers, either alone or in combination, can predict the long-term mortality following CRT. Indeed, it has recently been demonstrated that increasing RDW levels predict mor- tality before CRT, although it remained unclear whether the NT-proBNP data would affect the strength of the prediction [14–16]. Accordingly, we performed multivariable survival and reclassification analyses in order to determine the value of the NT-proBNP and the RDW in the long-term prognosis prediction.
2. Material and Methods
2.1. Study Population and Study Design. A cohort of 141 con- secutive patients referred to our Heart and Vascular Center between September 2009 and December 2010 was included in this prospective single-center observational study. We aimed to evaluate the prognostic impact of routine and novel laboratory biomarkers in chronic heart failure patients with CRT. We have shown previously the predictive role of white blood cells in CRT [17]. The present analysis focuses on the impact of the RDW in the same patient population.
CRT was indicated by medically refractory chronic heart failure in accordance with the current guidelines [18]. Briefly, the cohort comprised chronic heart failure patients on opti- mal medical treatment with an impaired New York Heart Association (NYHA) functional status (II–IV), a severely reduced (<35%) left ventricular ejection fraction (LVEF), and a wide QRS in the ECG (>120 msec). Four patients were excluded because of history of autoimmune disease, hematologic disease, an acute or chronic inflammatory disease, or a malignancy. Experienced electrophysiologists performed the CRT by insertion of a left ventricular lead into the coronary sinus and a right ventricular lead in a septal position. Routine laboratory tests, clinical examinations, and ECG and echocardiographic measurements were carried out at baseline and 6 months later. Cardiologists analyzed the echocardiographic parameters in a blinded fashion in order to calculate the LVEF with Simpson’s biplane method and the left ventricle volumes with the Teicholz method.
Prior to the enrollment, the local Ethics Committee of the Semmelweis University had approved the protocol, which was in accordance with the Helsinki Declaration, and all of the patients provided their written informed consent.
Complete laboratory and echocardiographic data on a total of 134 patients were included in the final analysis. The all-cause 5-year mortality was taken as the end-point of the study. Echocardiographic reverse remodeling was defined as an improvement of at least 15% in the left ventricular end- systolic volume 6 months after CRT implantation without death.
2.2. Laboratory Measurements. Study personnel collected ethylenediaminetetraacetic acid and citrate-treated serum samples for routine biochemical measurements before CRT and 6 months later. Red blood cell morphology parameters
were recorded with the Symex XS-1000i (Kobe, Japan) sys- tem by means of a direct current detection method and hydrodynamic focusing technology. Levels of NT-proBNP were measured with an electrochemiluminescence Cobas e 411 analyzer (Mannheim, Germany), using Roche Elecsys NT-proBNP II kits (Cat. number: 04842464190, Mannheim, Germany).
2.3. Statistical Analysis. A two-tailed𝑝value of<0.05 was considered statistically significant in all cases. The statistical analysis was carried out by using IBM SPSS 22 (Apache Soft- ware Foundation, USA), Graphpad Prism 6.03 (GraphPad Softwares Inc, USA), and PASS 2008 (NCSS, USA) the open source R software (R version 3.1.2 with PredictABEL and pROC packages).
The data were expressed as medians with interquartile ranges or as percentages with event numbers and the Mann- Whitney test or the chi squared test was applied for the comparison of two groups, as appropriate. Univariate Cox regression analysis was used to determine the 5-year mortal- ity predictors. The continuous variables were standardized by a one standard deviation (SD) increase (𝑍transformation).
Receiver operating characteristic analysis was used and the continuous variables were dichotomized in such a way as to obtain identical sensitivity values, and the Kaplan-Meier curves were then compared by using log-rank tests. In the multivariable Cox regression models, the basic model included variables with𝑝 < 0.05values of the univariate analysis, and further adjusted models were built in a forward stepwise manner [19]. A second multivariable model was performed with factors that gave𝑝 < 0.15in the univariate analysis in order to present a broader view of the prediction.
Power analysis was performed, and the validity of the results was checked and the performance of the models was char- acterized via the Brier score and Nagelkerke’s𝑅2. Finally,𝐶- statistics with the DeLong test was carried out to display the overall areas under the curves of the models and for reclassi- fication analyses, including net reclassification improvement (NRI) and integrated discrimination improvement (IDI) [20].
3. Results
3.1. Baseline Characteristics of the Study Population. The median age of the 134 patients was 67 years, 82% of them were male, 57% had ischemic heart failure, and 82% exhibited a left bundle branch block (LBBB) in the ECG, as shown in Table 1.
3.2. Changes in Echocardiographic and Laboratory Parameters.
The patients experienced echocardiographic reverse remod- eling 6 months after CRT implantation. LVEF increased [28%
(23–33) versus 37% (30–41);𝑝 < 0.0001], while LVESV [210 (153–276) versus 167 (115–242) mL;𝑝 < 0.0001] and LVEDV [303 (250–361) versus 259 (202–324) mL; 𝑝 < 0.0001]
decreased statistically significantly. The RDW, hematocrit, and creatinine remained statistically unaltered [13.6% (13.0–
14.6) versus 13.4% (13.0–14.2);𝑝 = 0.56and 42.3% (38.2–45.0) versus 41.4% (38.3–43.4);𝑝 = 0.06, and 109 (79–134) versus 96 (80–130)𝜇mol/L;𝑝 = 0.73, resp.], whereas NT-proBNP
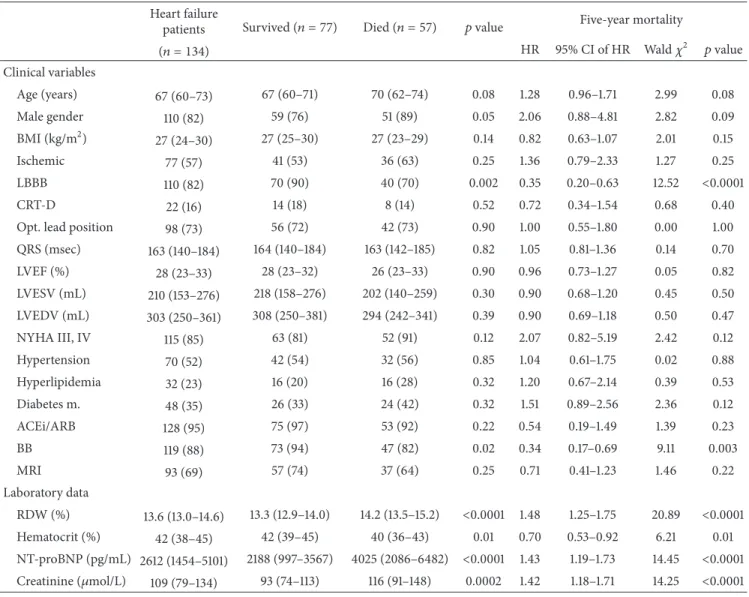
Table 1: Baseline parameters as predictors of the 5-year mortality.
Heart failure
patients Survived (𝑛 = 77) Died (𝑛 = 57) 𝑝value Five-year mortality
(𝑛 = 134) HR 95% CI of HR Wald𝜒2 𝑝value
Clinical variables
Age (years) 67 (60–73) 67 (60–71) 70 (62–74) 0.08 1.28 0.96–1.71 2.99 0.08
Male gender 110 (82) 59 (76) 51 (89) 0.05 2.06 0.88–4.81 2.82 0.09
BMI (kg/m2) 27 (24–30) 27 (25–30) 27 (23–29) 0.14 0.82 0.63–1.07 2.01 0.15
Ischemic 77 (57) 41 (53) 36 (63) 0.25 1.36 0.79–2.33 1.27 0.25
LBBB 110 (82) 70 (90) 40 (70) 0.002 0.35 0.20–0.63 12.52 <0.0001
CRT-D 22 (16) 14 (18) 8 (14) 0.52 0.72 0.34–1.54 0.68 0.40
Opt. lead position 98 (73) 56 (72) 42 (73) 0.90 1.00 0.55–1.80 0.00 1.00
QRS (msec) 163 (140–184) 164 (140–184) 163 (142–185) 0.82 1.05 0.81–1.36 0.14 0.70
LVEF (%) 28 (23–33) 28 (23–32) 26 (23–33) 0.90 0.96 0.73–1.27 0.05 0.82
LVESV (mL) 210 (153–276) 218 (158–276) 202 (140–259) 0.30 0.90 0.68–1.20 0.45 0.50
LVEDV (mL) 303 (250–361) 308 (250–381) 294 (242–341) 0.39 0.90 0.69–1.18 0.50 0.47
NYHA III, IV 115 (85) 63 (81) 52 (91) 0.12 2.07 0.82–5.19 2.42 0.12
Hypertension 70 (52) 42 (54) 32 (56) 0.85 1.04 0.61–1.75 0.02 0.88
Hyperlipidemia 32 (23) 16 (20) 16 (28) 0.32 1.20 0.67–2.14 0.39 0.53
Diabetes m. 48 (35) 26 (33) 24 (42) 0.32 1.51 0.89–2.56 2.36 0.12
ACEi/ARB 128 (95) 75 (97) 53 (92) 0.22 0.54 0.19–1.49 1.39 0.23
BB 119 (88) 73 (94) 47 (82) 0.02 0.34 0.17–0.69 9.11 0.003
MRI 93 (69) 57 (74) 37 (64) 0.25 0.71 0.41–1.23 1.46 0.22
Laboratory data
RDW (%) 13.6 (13.0–14.6) 13.3 (12.9–14.0) 14.2 (13.5–15.2) <0.0001 1.48 1.25–1.75 20.89 <0.0001
Hematocrit (%) 42 (38–45) 42 (39–45) 40 (36–43) 0.01 0.70 0.53–0.92 6.21 0.01
NT-proBNP (pg/mL) 2612 (1454–5101) 2188 (997–3567) 4025 (2086–6482) <0.0001 1.43 1.19–1.73 14.45 <0.0001 Creatinine (𝜇mol/L) 109 (79–134) 93 (74–113) 116 (91–148) 0.0002 1.42 1.18–1.71 14.25 <0.0001 Data are expressed as medians with interquartile ranges for continuous variables and as event numbers with percentages for categorical variables. For the comparison of continuous data, we used the Mann-Whitney test, whereas the chi squared test was applied for the comparison of the categorical variables. The 5-year mortality was assessed by using univariate Cox regression analysis. The hazard ratios refer to the presence versus the absence in the case of categorical variables and a 1 standard deviation increase in the case of continuous variables. HR = hazard ratio; CI = confidence interval;𝜒2= Wald chi squared; BMI = body mass index; Ischemic = ischemic etiology of the heart failure; LBBB = left bundle branch block; CRT-D = cardiac resynchronization therapy with implantable cardioverter defibrillator; Opt. lead position = lateral or posterolateral position; LVEF = left ventricular ejection fraction; LVESV = left ventricular end systolic volume; LVEDV = left ventricular end diastolic volume; NYHA III, IV = New York Heart Association classification 3-4; ACEi/ARB = angiotensin convertase inhibitor/angiotensin receptor blocker; BB = beta-blocker; MRI = mineralocorticoid receptor inhibitor; NT-proBNP = N-terminal of the prohormone brain natriuretic peptide; RDW = red blood cell distribution width.
decreased significantly [2612 (1454–5101) versus 1626 (725–
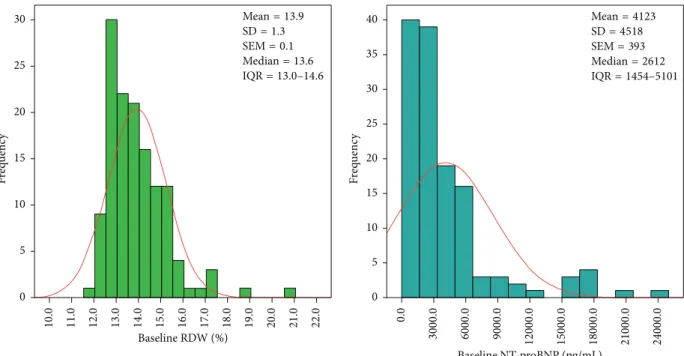
3300) pg/mL; 𝑝 < 0.0001]. Figure 1 illustrates the baseline RDW and NT-proBNP distributions.
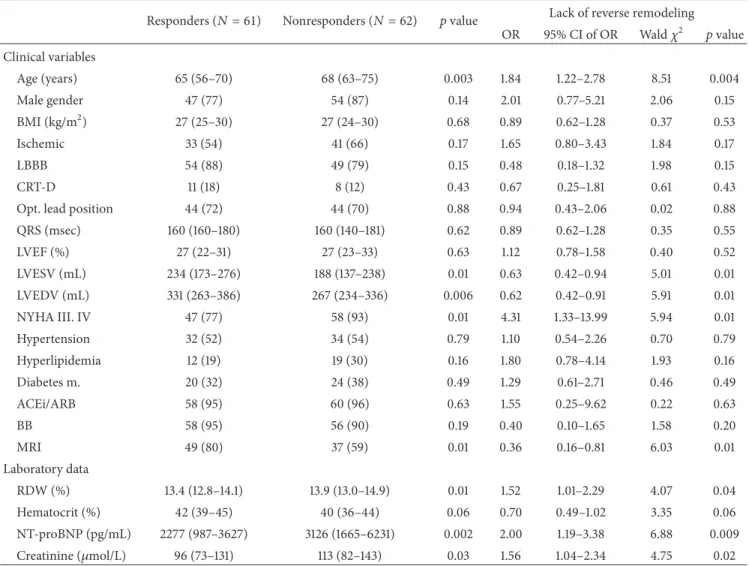
A total of 123 patients were analyzed for reverse remod- eling. The responders to CRT (𝑛 = 61, 50%) were younger and presented with higher left ventricular volumes, a better NYHA functional status, and more frequent MRI usage, as described in Table 2. Increasing baseline levels of RDW [odds ratio (OR) = 1.52 (1.01–2.29);𝑝 = 0.04, per 1 SD increase], NT- proBNP [OR = 2.00 (1.19–3.38);𝑝 = 0.009] and creatinine [OR = 1.56 (1.04–2.34);𝑝 = 0.02] predicted the lack of reverse remodeling (𝑛 = 62, 50%) in univariate logistic regression
analysis. Hematocrit concentrations were not associated with reverse remodeling [OR = 0.70 (0.49–1.02);𝑝 = 0.06]. In the multivariable analysis involving the significant factors (𝑝 < 0.05) of the univariate models, only NT-proBNP [OR = 2.67 (1.06–6.69);𝑝 = 0.03] remained statistically significant laboratory predictor of a nonresponse [creatinine OR = 1.46 (0.90–2.41);𝑝 = 0.12and RDW OR = 1.01 (0.62–0.63);𝑝 = 0.95].
3.3. Survival Analysis. Up to a median follow-up of 1799 days (maximum 2181 days), 57 (42%) patients died (Table 1). Those patients survived longer, who displayed LBBB morphology in
Table 2: Baseline parameters as predictors of the 6-month reverse remodeling.
Responders (𝑁 = 61) Nonresponders (𝑁 = 62) 𝑝value Lack of reverse remodeling OR 95% CI of OR Wald𝜒2 𝑝value Clinical variables
Age (years) 65 (56–70) 68 (63–75) 0.003 1.84 1.22–2.78 8.51 0.004
Male gender 47 (77) 54 (87) 0.14 2.01 0.77–5.21 2.06 0.15
BMI (kg/m2) 27 (25–30) 27 (24–30) 0.68 0.89 0.62–1.28 0.37 0.53
Ischemic 33 (54) 41 (66) 0.17 1.65 0.80–3.43 1.84 0.17
LBBB 54 (88) 49 (79) 0.15 0.48 0.18–1.32 1.98 0.15
CRT-D 11 (18) 8 (12) 0.43 0.67 0.25–1.81 0.61 0.43
Opt. lead position 44 (72) 44 (70) 0.88 0.94 0.43–2.06 0.02 0.88
QRS (msec) 160 (160–180) 160 (140–181) 0.62 0.89 0.62–1.28 0.35 0.55
LVEF (%) 27 (22–31) 27 (23–33) 0.63 1.12 0.78–1.58 0.40 0.52
LVESV (mL) 234 (173–276) 188 (137–238) 0.01 0.63 0.42–0.94 5.01 0.01
LVEDV (mL) 331 (263–386) 267 (234–336) 0.006 0.62 0.42–0.91 5.91 0.01
NYHA III. IV 47 (77) 58 (93) 0.01 4.31 1.33–13.99 5.94 0.01
Hypertension 32 (52) 34 (54) 0.79 1.10 0.54–2.26 0.70 0.79
Hyperlipidemia 12 (19) 19 (30) 0.16 1.80 0.78–4.14 1.93 0.16
Diabetes m. 20 (32) 24 (38) 0.49 1.29 0.61–2.71 0.46 0.49
ACEi/ARB 58 (95) 60 (96) 0.63 1.55 0.25–9.62 0.22 0.63
BB 58 (95) 56 (90) 0.19 0.40 0.10–1.65 1.58 0.20
MRI 49 (80) 37 (59) 0.01 0.36 0.16–0.81 6.03 0.01
Laboratory data
RDW (%) 13.4 (12.8–14.1) 13.9 (13.0–14.9) 0.01 1.52 1.01–2.29 4.07 0.04
Hematocrit (%) 42 (39–45) 40 (36–44) 0.06 0.70 0.49–1.02 3.35 0.06
NT-proBNP (pg/mL) 2277 (987–3627) 3126 (1665–6231) 0.002 2.00 1.19–3.38 6.88 0.009
Creatinine (𝜇mol/L) 96 (73–131) 113 (82–143) 0.03 1.56 1.04–2.34 4.75 0.02
Data are expressed as medians with interquartile ranges for continuous variables and as event numbers with percentages for categorical variables. For the comparison of continuous data, we used the Mann-Whitney test, whereas the chi squared test was applied for the comparison of the categorical variables.
Reverse remodeling was defined as a relative decrease of at least 15%in the LVESV 6 months after CRT implantation without death. The lack of reverse remodeling was tested by using univariate logistic regression analyses. The odds ratios refer to the presence versus the absence in the case of categorical variables and a 1 standard deviation increase in the case of continuous variables. OR = odds ratio; CI = confidence interval;𝜒2= Wald chi squared; BMI = body mass index; Ischemic = ischemic etiology of the heart failure; LBBB = left bundle branch block; CRT-D = cardiac resynchronization therapy with implantable cardioverter defibrillator; Opt. lead position = lateral or posterolateral position; LVEF = left ventricular ejection fraction; LVESV = left ventricular end systolic volume; LVEDV = left ventricular end diastolic volume; NYHA III, IV = New York Heart Association classification 3-4; ACEi/ARB = angiotensin convertase inhibitor/angiotensin receptor blocker; BB = beta-blocker; MRI = mineralocorticoid receptor inhibitor; NT-proBNP = N-terminal of the prohormone brain natriuretic peptide; RDW = red blood cell distribution width.
the ECG or were on beta-blocker therapy. Increasing baseline levels of RDW [hazard ratio (HR) = 1.48 (1.25–1.75), 𝑝 <
0.0001; per 1 SD increase], NT-proBNP [HR = 1.43 (1.19–
1.73);𝑝 < 0.0001], and serum creatinine [HR = 1.42 (1.18–
1.71);𝑝 < 0.0001] worsened the long-term survival chances.
Elevated hematocrit fractions improved the survival [HR = 0.70 (0.53–0.92); 𝑝 = 0.01]. Older age (𝑝 = 0.08), male gender (𝑝 = 0.09), poor NYHA class, and diabetes mellitus (𝑝 = 0.12) tended to be associated with an adverse outcome.
Receiver operating characteristic analysis was performed to obtain optimal cut-off values. Each laboratory parameter
was dichotomized so as to reach a sensitivity of 79% (66–
88) in mortality prediction, which we considered clinically meaningful. In this way, the individual specificity values were different, but the sensitivity was the same in all cases, making the cut-off selection more objective and comparable.
Patients before CRT were subject to up to a 3-fold increased 5-year mortality risk, with RDW levels>l3.35%
[HR = 3.20 (1.69–6.06),𝑝 = 0.0002; specificity = 53% (42–
65)], NT-proBNP levels>1975 pg/mL [HR = 2.71 (1.43–5.14), 𝑝 = 0.001; specificity = 48% (37–60)] and serum creatinine>
88.5𝜇mol/L [HR = 2.80 (1.45–5.42),𝑝 = 0.001; specificity =
Median=13.6 SEM=0.1 SD=1.3 Mean=13.9
IQR=13.0–14.6
0 5 10 15 20 25 30
Frequency 11.0 12.0 20.016.015.0 21.010.0 18.0 19.014.013.0 22.017.0
Baseline RDW (%)
Median=2612 SEM=393 SD=4518 Mean=4123
IQR=1454–5101
0 5 10 15 20 25 30 35 40
Frequency 0.0 6000.0 9000.03000.0 15000.0 18000.0 21000.0 24000.012000.0
Baseline NT-proBNP (pg/mL)
Figure 1: Histogram of baseline RDW and NT-proBNP. Both the RDW and NT-proBNP differ from the red line of normal distribution. RDW
= red blood cell distribution width; NT-proBNP = N-terminal pro-B-type natriuretic peptide; SD = standard deviation; SEM = standard error of the mean; IQR = interquartile range (25% percentile–75% percentile).
47% (35–59)], as shown in Figure 2. A hematocrit<44% [HR
= 1.59 (0.84–3.00),𝑝 = 0.15; specificity = 34% (24–45)] did not predict mortality statistically significantly.
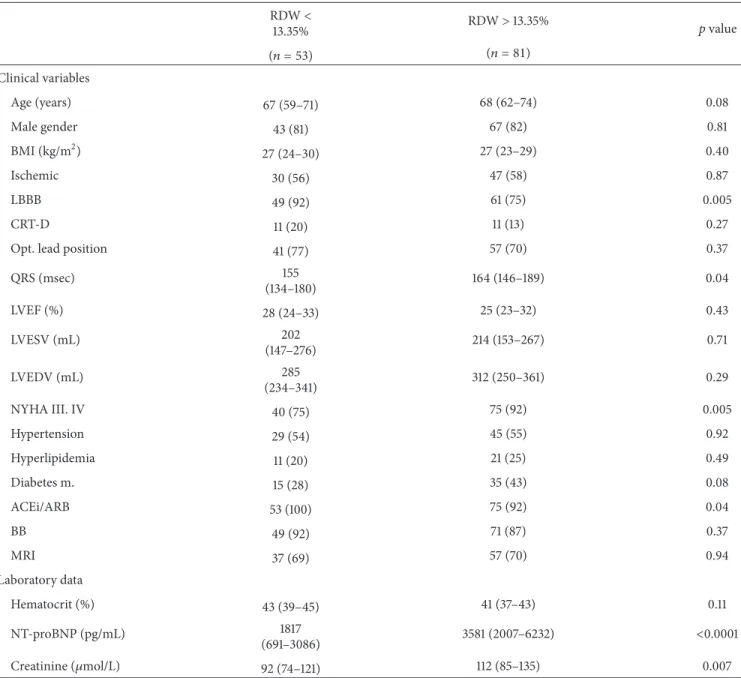
Patients with elevated RDW levels before CRT implanta- tion were in a worse NYHA functional class, had less LBBB pattern in the ECG with wider QRS, and used less angiotensin convertase inhibitor therapy, as shown in Table 3. They also tended to be older and to have diabetes more frequently.
These patients exhibited significantly elevated NT-proBNP and creatinine concentrations but statistically indifferent hematocrit levels.
We performed multivariable Cox regression analyses and set up a basic prediction model with significant (𝑝 < 0.05) clinical (LBBB and beta-blocker therapy) and laboratory parameters (serum creatinine>88.5𝜇mol/L). After separate adjustment to the basic model, both the RDW>13.35% [HR
= 2.81 (1.45–5.44);𝑝 = 0.002] and NT-proBNP>1975 pg/mL [HR = 2.19 (1.13–4.23); 𝑝 = 0.01] predicted the 5-year mortality (Table 4). In the final model including all variables, the RDW remained significant [HR = 2.49 (1.27–4.86);𝑝 = 0.008], whereas the NT-proBNP lost its predictive value [HR
= 1.18 (0.93–3.51);𝑝 = 0.07].
We additionally implemented a multivariable model 2, in which the basic model included extended clinical (age, male gender, NYHA class III/IV, LBBB, beta-blocker therapy, and diabetes mellitus) and laboratory (serum creatinine>
88.5𝜇mol/L) factors with 𝑝 < 0.15 from the univariate analysis (Table 5). Similarly, after separate adjustment to the basic model, both the RDW>13.35% [HR = 2.07 (1.38–5.29);
𝑝 = 0.004] and NT-proBNP>1975 pg/mL [HR = 2.21 (1.13–
4.33);𝑝 = 0.02] predicted the 5-year mortality. In the final model including all variables, the RDW remained significant [HR = 2.42 (1.22–4.76);𝑝 = 0.01], whereas the NT-proBNP lost its predictive value [HR = 1.88 (0.95–3.69);𝑝 = 0.06].
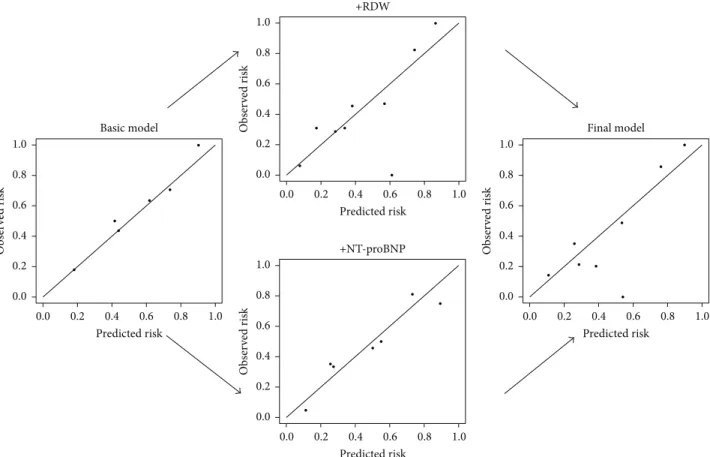
3.4. Validation, Performance, and Reclassification. The power analysis demonstrated that the RDW had a predictive power of 84% in the population of 134 patients to detect those 45 patients who died with an elevated RDW. The predicted and observed risks, assessed with the Hosmer-Lemeshow test, were similar throughout the analyses, as an indication of good calibration and confirming the validity (Figure 3, Tables 4 and 5). The Brier Score and Nagelkerke𝑅2measure the accuracy of survival predictions. The changes (a decreasing Brier score and an increasing Nagelkerke𝑅2) in these scores suggest an improved prediction (Tables 4 and 5).
The 𝐶-statistics measures the overall areas under the curve (AUC) of the prediction models. Both the RDW [AUC
= 0.71 to 0.75;𝑝 = 0.03] and NT-proBNP [AUC = 0.71 to 0.74;
𝑝 = 0.04] improved the prediction statistically significantly beyond the basic model (Figure 4 and Table 4).
By adding RDW, we reached a reclassification improve- ment of 64% [NR I = 0.64 (0.33–0.95);𝑝 < 0.0001] and a discrimination development of a 3% [IDI = 0.03 (0.00–0.07), 𝑝 = 0.01] over the NT-proBNP-adjusted basic model. Setting the NT-proBNP into the RDW-adjusted basic model did not result in such an improvement [NRI = 0.14 (−0.03–0.33);𝑝 =
Table 3: Differences in baseline characteristics in patients with increased or decreased RDW levels.
RDW<
13.35% RDW>13.35% 𝑝value
(𝑛 = 53) (𝑛 = 81)
Clinical variables
Age (years) 67 (59–71) 68 (62–74) 0.08
Male gender 43 (81) 67 (82) 0.81
BMI (kg/m2) 27 (24–30) 27 (23–29) 0.40
Ischemic 30 (56) 47 (58) 0.87
LBBB 49 (92) 61 (75) 0.005
CRT-D 11 (20) 11 (13) 0.27
Opt. lead position 41 (77) 57 (70) 0.37
QRS (msec) 155
(134–180) 164 (146–189) 0.04
LVEF (%) 28 (24–33) 25 (23–32) 0.43
LVESV (mL) 202
(147–276) 214 (153–267) 0.71
LVEDV (mL) 285
(234–341) 312 (250–361) 0.29
NYHA III. IV 40 (75) 75 (92) 0.005
Hypertension 29 (54) 45 (55) 0.92
Hyperlipidemia 11 (20) 21 (25) 0.49
Diabetes m. 15 (28) 35 (43) 0.08
ACEi/ARB 53 (100) 75 (92) 0.04
BB 49 (92) 71 (87) 0.37
MRI 37 (69) 57 (70) 0.94
Laboratory data
Hematocrit (%) 43 (39–45) 41 (37–43) 0.11
NT-proBNP (pg/mL) 1817
(691–3086) 3581 (2007–6232) <0.0001
Creatinine (𝜇mol/L) 92 (74–121) 112 (85–135) 0.007
Data are expressed as medians with interquartile ranges for continuous variables and as event numbers with percentages for categorical variables. For the comparison of continuous data, we used the Mann-Whitney test, whereas the chi squared test was applied for the comparison of the categorical variables.
BMI = body mass index; Ischemic = ischemic etiology of the heart failure; LBBB = left bundle branch block; CRT-D = cardiac resynchronization therapy with implantable cardioverter defibrillator; Opt. lead position = lateral or posterolateral position; LVEF = left ventricular ejection fraction; LVESV = left ventricular end systolic volume; LVEDV = left ventricular end diastolic volume; NYHA III, IV = New York Heart Association classification 3-4; ACEi/ARB = angiotensin convertase inhibitor/angiotensin receptor blocker; BB = beta-blocker; MRI = mineralocorticoid receptor inhibitor; NT-proBNP = N-terminal of the prohormone brain natriuretic peptide; RDW = red blood cell distribution width.
0.11and IDI = 0.01 (−0.01–0.03);𝑝 = 0.20], as demonstrated in Table 4. The multivariable model 2 suggested similar results (Table 5).
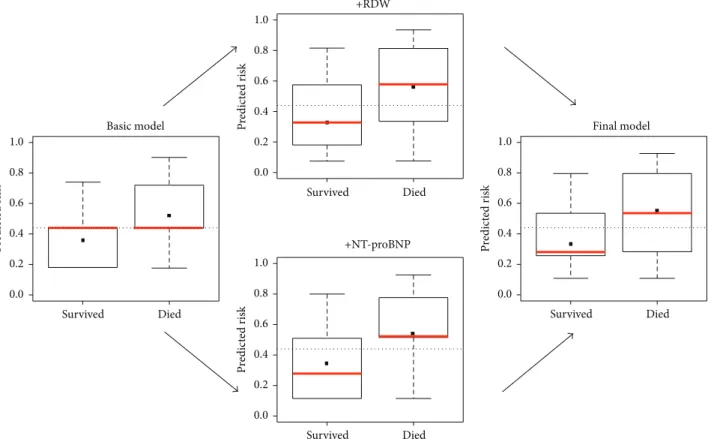
The IDI = 0.03 indicates that 3% of the patients would have been better categorized by using the RDW in the final model: 4 of the 134 patients presented with low NT-proBNP but high RDW and died 5 years later. Figure 5 displays this improved discrimination capacity; the median mortality risk [𝑝 = 0.42(57/134)] decreases in patients categorized as future
survivors (𝑝 = 0.22) and increases in patients likely to die (𝑝 = 0.55).
4. Discussion
4.1. Synopsis of Key Findings. We have shown that an increased RDW predicts the long-term mortality of chronic heart failure patients undergoing CRT, independently of the NT-proBNP level or other factors. The reclassification
RDW
Survival (%)Survival (%)
53 81
49 69
48 59
47 50
46 43
41 36 Subjects
at risk
Subjects at risk
Died Survived
45 36
12 41
NT-proBNP
49 85
48 72
47 61
42 54
40 50
37 40 0
25 50 75 100
1 2 3 4 5
0
Years
1 2 3 4 5
0
Years 0
25 50 75 100
>13.35%
<13.35% log-rankp = 0.0002
Died Survived
45 40
12 37
log-rank>1975p = 0.001pg/mL
<1975pg/mL
(a)
20 40 60 80 100
0
100 −specificity (%) 0
20 40 60 80 100
Sensitivity (%)
0 20 40 60 80 100
Sensitivity (%)
20 40 60 80 100
0
100 −specificity (%) p < 0.0001
AUC= 0.73(0.65–0.82) Sens= 79% (66–88)
Spec= 53% (42–65) NPV= 77% (64–88) PPV= 56% (44–67)
p < 0.0001
AUC= 0.70(0.62–0.79) Sens= 79% (66–88)
Spec= 48% (37–60) NPV= 76% (61–87) PPV= 53% (42–64)
(b)
Figure 2: Increased RDW and NT-proBNP levels predict the 5-year mortality of chronic heart failure patients before CRT. We performed receiver operating characteristic analysis (a) and dichotomized the continuous variables so as to obtain the same sensitivity values. The Kaplan- Meier survival curves were tested by the log-rank test (b). CRT = cardiac resynchronization therapy; RDW = red blood cell distribution width;
NT-proBNP = N-terminal pro-B-type natriuretic peptide; AUC = area under the curve; Sens = sensitivity; Spec = specificity; NPV = negative predictive value; PPV = positive predictive value.
analyses revealed that the RDW has a higher risk stratification value than that of NT-proBNP in mortality prediction.
Increased baseline RDW levels also predicted the lack of echocardiographic reverse remodeling, but NT-proBNP was superior from the aspect of CRT response prediction.
4.2. Possible Mechanisms and Explanations. Prediction mod- els with RDW in chronic heart failure patients have been
previously investigated [5–8], but the underlying mechanism remains unclear. Chronic heart failure is associated with systemic inflammation, oxidative stress, cytokine produc- tion, and neurohumoral activation, leading to enhanced catecholamine release and sympathetic activation [21]. Cat- echolamines downregulate renal erythropoietin production and cause consecutive anemia [22]. On the other hand, the sympathetic activation increases the cardiac output and
Table 4: Multivariable Cox regression analysis of the 5-year mortality with validation, calibration, and reclassification.
Basic model with RDW + NT-proBNP
Basic model
+ RDW Basic model Basic model
+ NT-proBNP
Basic model with NT-proBNP
+ RDW Cox regression
HR of RDW 2.49
(1.27–4.86)
2.81
(1.45–5.44) 2.49 (1.27–4.86)
𝑝(RDW) 0.008 0.002 0.008
HR of NT-proBNP 1.18 (0.93–3.51) 2.19 (1.13–4.23) 1.18 (0.93–3.51)
𝑝(NT-proBNP) 0.07 0.01 0.07
Validation
Overall𝜒2 42.62 40.47 29.86 35.32 42.62
𝑝(overall) <0.0001 <0.0001 <0.0001 <0.0001 <0.0001
𝑝(changes) 0.06 0.001 0.01 0.004
Calibration
HL test𝜒2 8.26 6.72 0.48 4.01 8.26
𝑝(HL test) 0.40 0.56 0.99 0.85 0.40
Performance
Brier score 0.18 0.19 0.20 0.19 0.18
Nagelkerke’s𝑅2 0.30 0.28 0.21 0.26 0.30
Reclassification
𝐶-statistics 0.76
(0.69–0.84)
0.75 (0.66–0.83)
(0.63–0.79)0.71 0.74
(0.66–0.82) 0.76 (0.69–0.84)
𝑝(𝐶-statistics) 0.80 0.03 0.04 0.39
NRI (95% CI) 0.14
(–0.03–0.33)
0.64 (0.33–0.95)
0.54
(0.23–0.84) 0.64 (0.33–0.95)
𝑝(NRI) 0.11 <0.0001 0.0005 <0.0001
IDI (95% CI) 0.01
(–0.00–0.03)
0.05 (0.01–0.09)
0.03
(0.00–0.06) 0.03 (0.00–0.07)
𝑝(IDI) 0.20 0.003 0.04 0.01
The basic multivariable Cox regression model included left bundle branch block, beta-blocker therapy, and creatinine>88.5𝜇mol/L. The RDW>13.35%and NT-proBNP>1975 pg/mL were adjusted separately to the basic model in a forward stepwise manner. The final common model included all variables. HR = hazard ratio;𝜒2= chi squared; HL test = Hosmer-Lemeshow test; 95%CI = 95%confidence interval;𝐶-statistics = overall areas under the curve, assessed by the DeLong test; NRI = net reclassification improvement; IDI = integrated discrimination improvement. NT-proBNP = N-terminal pro-B-type natriuretic peptide; RDW = red blood cell distribution width.
stroke volume resulting in a volume redistribution that reduces the renal blood flow [22]. Furthermore, the upreg- ulated plasma corticosteroids suppress the hematopoiesis in the bone marrow [23]. Development of the “cardiorenal syndrome” is characterized by anemia and a renal dysfunc- tion. We therefore adjusted the serum creatinine data in the prediction models so as to reduce the possible influence of a renal dysfunction on the RDW values.
Very intensive clinical research is ongoing for biomarkers that predict the long-term survival of CRT patients, and biostatistics has a decisive role in these investigations [12].
The most commonly used method is Cox regression analysis,
though it is of limited value in real clinical benefit assess- ments, as it overestimates the prediction if not controlled [24]. In contrast, the 𝐶-statistics, which investigates the overall AUCs of the models, is a rather conservative method and underestimates the benefit [24]. Novel reclassification approaches have therefore been developed, that is, NRI and IDI, to reveal the absolute discrimination improvement [20].
In our analysis we made use of well-calibrated prediction models, and the results of 𝐶-statistics, NRI, and IDI con- firmed the results of the Cox regression analysis.
A recent systematic meta-analysis demonstrated that increased RDW levels are associated with a poor prognosis
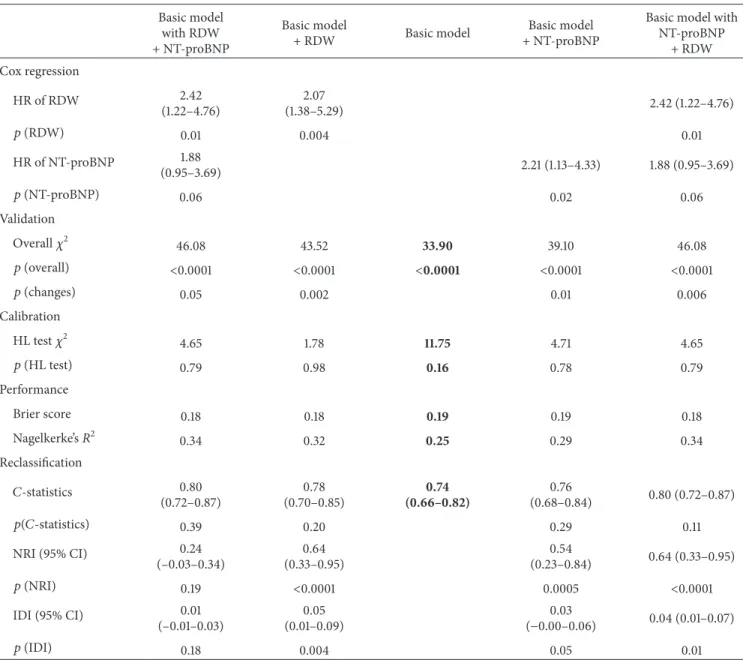
Table 5: Multivariable Cox regression analysis 2 of the 5-year survival with validation, calibration, and reclassification.
Basic model with RDW + NT-proBNP
Basic model
+ RDW Basic model Basic model
+ NT-proBNP
Basic model with NT-proBNP
+ RDW Cox regression
HR of RDW 2.42
(1.22–4.76)
2.07
(1.38–5.29) 2.42 (1.22–4.76)
𝑝(RDW) 0.01 0.004 0.01
HR of NT-proBNP 1.88
(0.95–3.69) 2.21 (1.13–4.33) 1.88 (0.95–3.69)
𝑝(NT-proBNP) 0.06 0.02 0.06
Validation
Overall𝜒2 46.08 43.52 33.90 39.10 46.08
𝑝(overall) <0.0001 <0.0001 <0.0001 <0.0001 <0.0001
𝑝(changes) 0.05 0.002 0.01 0.006
Calibration
HL test𝜒2 4.65 1.78 11.75 4.71 4.65
𝑝(HL test) 0.79 0.98 0.16 0.78 0.79
Performance
Brier score 0.18 0.18 0.19 0.19 0.18
Nagelkerke’s𝑅2 0.34 0.32 0.25 0.29 0.34
Reclassification
𝐶-statistics 0.80
(0.72–0.87)
0.78 (0.70–0.85)
(0.66–0.82)0.74 0.76
(0.68–0.84) 0.80 (0.72–0.87)
𝑝(𝐶-statistics) 0.39 0.20 0.29 0.11
NRI (95% CI) 0.24
(–0.03–0.34)
0.64 (0.33–0.95)
0.54
(0.23–0.84) 0.64 (0.33–0.95)
𝑝(NRI) 0.19 <0.0001 0.0005 <0.0001
IDI (95% CI) 0.01
(–0.01–0.03)
0.05 (0.01–0.09)
0.03
(−0.00–0.06) 0.04 (0.01–0.07)
𝑝(IDI) 0.18 0.004 0.05 0.01
The basic multivariable Cox regression model included age, male gender, NYHA class III/IV, LBBB, beta-blocker therapy, diabetes mellitus, and creatinine>
88.5𝜇mol/L. The RDW>13.35%and NT-proBNP>1975 pg/mL were adjusted separately to the basic model in a forward stepwise manner. The final common model included all variables. HR = hazard ratio;𝜒2= chi squared; HL test = Hosmer-Lemeshow test; 95%CI = 95%confidence interval;𝐶-statistics = overall areas under the curve, assessed by the DeLong test; NRI = net reclassification improvement; IDI = integrated discrimination improvement. NT-proBNP = N- terminal pro-B-type natriuretic peptide; RDW = red blood cell distribution width.
in patients with chronic heart failure [8] and also concluded that natriuretic peptides affect mortality, so that the prog- nostic value of the RDW might be overestimated without adjustment to NT-proBNP. In fact, our data reveal that the predictive value of NT-proBNP might be overestimated without adjustment to the RDW. It should be added that appropriately performed survival analyses are mandatory if a firm conclusion is to be reached.
To date, only three studies have evaluated the role of RDW in mortality prediction of CRT patients [14–16]. In a study on 217 patients, Rickard et al. demonstrated that the presence of an elevated RDW is associated with an increased
mortality risk and less reverse left ventricular remodeling in patients undergoing CRT [15]. Celikyurt et al. showed that RDW fractions were increased significantly 6 months after CRT in the nonresponders among 66 patients but remained unaltered in the responders [14]. The investigation by Topaz et al. on 156 patients indicated that increased RDW levels even 6 months and 12 months after implantation are associated with poor mortality [16]. The baseline RDW fractions proved to be strong and independent predictor factors, but these studies did not investigate the influence of NT-proBNP on the final outcome. Our study confirms and extends these previous findings. The Cox regression results
Basic model Final model +RDW
+NT-proBNP
0.0 0.2 0.4 0.6 0.8 1.0
Observed risk
0.2 0.4 0.6 0.8 1.0
0.0
Predicted risk
0.0 0.2 0.4 0.6 0.8 1.0
Observed risk
0.2 0.4 0.6 0.8 1.0
0.0
Predicted risk
0.0 0.2 0.4 0.6 0.8 1.0
Observed risk
0.2 0.4 0.6 0.8 1.0
0.0
Predicted risk 0.0
0.2 0.4 0.6 0.8 1.0
Observed risk
0.2 0.4 0.6 0.8 1.0
0.0
Predicted risk
Figure 3: Calibration plots of the prediction models. The observed and predicted risks converge to the line of perfect prediction, suggesting the good calibration of the models. RDW = red blood cell distribution width; NT-proBNP = N-terminal pro-B-type natriuretic peptide.
were validated with reclassification analyses, and the data demonstrated that the RDW outperforms NT-proBNP in long-term prediction. A possible explanation could be that while the natriuretic peptides reflect the actual filling status of the heart and determine the short-term outcome, the RDW mirrors the extent of systemic injury and consequently the long-term outcome. Further, the half-life of NT-proBNP is approximately 25 minutes, whereas the RDW is associated with the history of the previous 130 days (i.e., the lifespan of the red blood cells); the natriuretic peptides may therefore vary rapidly in response to current influences, while the RDW may remain unchanged [25, 26].
In our study patients with elevated RDW levels before CRT implantation were in worse NYHA functional class, had less LBBB pattern in the ECG with wider QRS, and used less angiotensin convertase inhibitor medications. They also tended to be older and to have diabetes more frequently. The RDW elevation is therefore most likely the consequence of the multiple comorbidities and disease progression, being a nonspecific biomarker. Nevertheless, reclassification analyses considered these confounders and RDW was still able to expand the risk prediction.
We established earlier that the ratio of the neutrophil leucocytes to the lymphocytes (the NL ratio) predicts the mortality in CRT independently of the NT-proBNP level [17].
We therefore propose that nonspecific biomarkers (such as the NL ratio or the RDW) might be considered in the clinical risk assessment scenarios. We in no way wish to underes- timate the relevance of NT-proBNP measurements, but we would like to point out that a single, simple blood parameter could provide valuable additional prognostic information.
4.3. Strengths and Limitations. The main strength of this study is that it show for the first time the additional value of the RDW, a widely available biomarker in the risk assessment for CRT patients. The results clearly demonstrate the benefit of the RDW in risk prediction in a clinical setting. The investigation is limited by the relatively small sample size, which may have resulted in lower sensitivity and specificity.
Moreover, the present results reported here derive from the analysis of an earlier published study by our group. All- cause mortality was taken as the end-point of the study and a distinction was not made between cardiovascular and noncardiovascular death due to low event numbers.
The Teicholz method was used to compute left ventricular volumes instead of Simpson’s method. Finally, the baseline characteristics of the two RDW groups differed; nevertheless the reclassification analyses considered these confounders.
The present investigation was obviously unable to include all relevant factors affecting the outcome in CRT,
Basic model
Basic model+NT-proBNP
Basic model with RDW
Basic model with RDW + NT-proBNP Basic model with NT-proBNP
Basic model with NT-proBNP + RDW
Basic model Basic model+RDW 0.0
0.2 0.4 0.6 0.8 1.0
Sensitivity
1.0
0.4 0.6 0.8
0.2 0.0
1 −specificity
0.0 0.2 0.4 0.6 0.8 1.0
Sensitivity
1.0
0.4 0.6 0.8
0.2 0.0
1 −specificity
0.0 0.2 0.4 0.6 0.8 1.0
Sensitivity
1.0
0.4 0.6 0.8
0.2 0.0
1 −specificity
0.0 0.2 0.4 0.6 0.8 1.0
Sensitivity
1.0
0.4 0.6 0.8
0.2 0.0
1 −specificity
Figure 4: Increasing predictive capacity of the models. The𝐶-statistics measures the overall AUCs of the prediction models and displays the overall predictive powers of the models in a more conservative fashion than Cox regression. AUC = area under the curve; RDW = red blood cell distribution width; NT-proBNP = N-terminal pro-B-type natriuretic peptide.
which might also bias the results. This analysis is mainly hypothesis-generating and the results should be regarded therefore as preliminary. Larger trials are needed to confirm the results.
5. Conclusions
Increased RDW levels predict the 5-year mortality of CRT patients independently of the NT-proBNP concentrations.
Reclassification analysis revealed that the RDW might result in a better risk stratification than that with NT-proBNP and could lead to a better patient selection for CRT.
Conflict of Interests
The authors declare that there is no conflict of interests regarding the publication of this paper.
Basic model Final model +RDW
+NT-proBNP
Survived Died
0.0 0.2 0.4 0.6 0.8 1.0
Predicted risk Survived Died
0.0 0.2 0.4 0.6 0.8 1.0
Predicted risk
Survived Died
0.0 0.2 0.4 0.6 0.8 1.0
Predicted risk Survived Died
0.0 0.2 0.4 0.6 0.8 1.0
Predicted risk
Figure 5: Improved discrimination of the prediction models. The improved discrimination capacity is graphically visualized by means of a box and whiskers diagram. The median (red line) of the mortality risk decreases in patients categorized as future survivors and increases in patients likely to die. The dotted line indicates the baseline risk. RDW = red blood cell distribution width; NT-proBNP = N-terminal pro-B-type natriuretic peptide.
Authors’ Contribution
B´ela Merkely and G´abor Sz´eplaki contributed equally to the work and both should be regarded as last authors of the paper.
Acknowledgments
This work was supported by the Hungarian Foundation Pro- grams “Semmelweis Egyetem H´ıd Projekt” (T ´AMOP-4.2.2- 08/1/KMR-2008-0004) and “Semmelweis Egyetem Magiszter Program” (T ´AMOP-4.2.2./B10/1.-210-0013), J´anos Bolyai Research Scholarships of the Hungarian Academy of Sciences (to G´abor Sz´eplaki and L´aszl´o Gell´er), and the Hungarian Scientific Research Fund (OTKA K 105555).
References
[1] R. R. J. van Kimmenade and J. L. Januzzi Jr., “Emerging bio- markers in heart failure,”Clinical Chemistry, vol. 58, no. 1, pp.
127–138, 2012.
[2] M. Tonelli, F. Sacks, M. Arnold, L. Moye, B. Davis, and M.
Pfeffer, “Relation between red blood cell distribution width and cardiovascular event rate in people with coronary disease,”
Circulation, vol. 117, no. 2, pp. 163–168, 2008.
[3] S. Dabbah, H. Hammerman, W. Markiewicz, and D. Aronson,
“Relation between red cell distribution width and clinical out- comes after acute myocardial infarction,”American Journal of Cardiology, vol. 105, no. 3, pp. 312–317, 2010.
[4] C. Ani and B. Ovbiagele, “Elevated red blood cell distribution width predicts mortality in persons with known stroke,”Journal of the Neurological Sciences, vol. 277, no. 1-2, pp. 103–108, 2009.
[5] G. M. Felker, L. A. Allen, S. J. Pocock et al., “Red cell distribution width as a novel prognostic marker in heart failure: data from the CHARM program and the Duke Databank,”Journal of the American College of Cardiology, vol. 50, no. 1, pp. 40–47, 2007.
[6] Y. Al-Najjar, K. M. Goode, J. Zhang, J. G. F. Cleland, and A. L. Clark, “Red cell distribution width: an inexpensive and powerful prognostic marker in heart failure,”European Journal of Heart Failure, vol. 11, no. 12, pp. 1155–1162, 2009.
[7] Z. F¨orh´ecz, T. Gombos, G. Borgulya, Z. Pozsonyi, Z. Proh´aszka, and L. J´anoskuti, “Red cell distribution width in heart failure:
prediction of clinical events and relationship with markers of ineffective erythropoiesis, inflammation, renal function, and nutritional state,”American Heart Journal, vol. 158, no. 4, pp.
659–666, 2009.
[8] Y. L. Huang, Z. D. Hu, S. J. Liu et al., “Prognostic value of red blood cell distribution width for patients with heart failure: a systematic review and meta-analysis of cohort studies,”PLoS ONE, vol. 9, no. 8, Article ID e104861, 2014.
[9] N. Malandrino, W. C. Wu, T. H. Taveira, H. B. Whitlatch, and R. J. Smith, “Association between red blood cell distribution
width and macrovascular and microvascular complications in diabetes,”Diabetologia, vol. 55, no. 1, pp. 226–235, 2012.
[10] Z. Hu, Y. Sun, Q. Wang et al., “Red blood cell distribution width is a potential prognostic index for liver disease,”Clinical Chem- istry and Laboratory Medicine, vol. 51, no. 7, pp. 1403–1408, 2013.
[11] A. Ujszaszi, M. Z. Molnar, M. E. Czira, M. Novak, and I. Mucsi,
“Renal function is independently associated with red cell dis- tribution width in kidney transplant recipients: a potential new auxiliary parameter for the clinical evaluation of patients with chronic kidney disease,”British Journal of Haematology, vol. 161, no. 5, pp. 715–725, 2013.
[12] M. Brignole, A. Auricchio, G. Baron-Esquivias et al., “2013 ESC Guidelines on cardiac pacing and cardiac resynchronization therapy,”European Heart Journal, vol. 34, no. 29, pp. 2281–2329, 2013.
[13] F. A. McAlister, J. Ezekowitz, N. Hooton et al., “Cardiac resyn- chronization therapy for patients with left ventricular systolic dysfunction: a systematic review,”The Journal of the American Medical Association, vol. 297, no. 22, pp. 2502–2514, 2007.
[14] U. Celikyurt, A. Agacdiken, T. Sahin, G. Kozdag, A. Vural, and D. Ural, “Association between red blood cell distribution width and response to cardiac resynchronization therapy,”Journal of Interventional Cardiac Electrophysiology, vol. 35, no. 2, pp. 215–
218, 2012.
[15] J. Rickard, D. J. Kumbhani, E. Z. Gorodeski et al., “Elevated red cell distribution width is associated with impaired reverse ven- tricular remodeling and increased mortality in patients under- going cardiac resynchronization therapy,” Congestive Heart Failure, vol. 18, no. 2, pp. 79–84, 2012.
[16] G. Topaz, M. Haim, J. Kusniec et al., “Association between red cell distribution width and mortality after cardiac resynchro- nization therapy,”Israel Medical Association Journal, vol. 17, no.
8, pp. 505–509, 2015.
[17] A. M. Boros, G. Szeplaki, P. Perge et al., “The ratio of the neutrophil leucocytes to the lymphocytes predicts the outcome after cardiac resynchronization therapy,”Europace, 2015.
[18] K. Dickstein, P. E. Vardas, A. Auricchio et al., “2010 Focused Update of ESC Guidelines on device therapy in heart failure: an update of the 2008 ESC guidelines for the diagnosis and treat- ment of acute and chronic heart failure and the 2007 ESC guide- lines for cardiac and resynchronization therapy. Developed with the special contribution of the Heart Failure Association and the European Heart Rhythm Association,”European Heart Journal, vol. 31, no. 21, pp. 2677–2687, 2010.
[19] F. E. Harrell Jr., K. L. Lee, and D. B. Mark, “Multivariable prognostic models: issues in developing models, evaluating assumptions and adequacy, and measuring and reducing errors,”Statistics in Medicine, vol. 15, no. 4, pp. 361–387, 1996.
[20] E. W. Steyerberg, A. J. Vickers, N. R. Cook et al., “Assessing the performance of prediction models: a framework for traditional and novel measures,”Epidemiology, vol. 21, no. 1, pp. 128–138, 2010.
[21] L. Gullestad, T. Ueland, L. E. Vinge, A. Finsen, A. Yndestad, and P. Aukrust, “Inflammatory cytokines in heart failure: mediators and markers,”Cardiology, vol. 122, no. 1, pp. 23–35, 2012.
[22] D. Silverberg, “Outcomes of anaemia management in renal insufficiency and cardiac disease,”Nephrology Dialysis Trans- plantation, vol. 18, supplement 2, pp. ii7–ii12, 2003.
[23] M. W. D¨unser and W. R. Hasibeder, “Sympathetic overstimula- tion during critical illness: adverse effects of adrenergic stress,”
Journal of Intensive Care Medicine, vol. 24, no. 5, pp. 293–316, 2009.
[24] H. Uno, L. Tian, T. Cai, I. S. Kohane, and L. J. Wei, “A unified inference procedure for a class of measures to assess improvement in risk prediction systems with survival data,”
Statistics in Medicine, vol. 32, no. 14, pp. 2430–2442, 2013.
[25] M. H. Kroll, P. J. Twomey, and P. Srisawasdi, “Using the single- compartment ratio model to calculate half-life, NT-proBNP as an example,”Clinica Chimica Acta, vol. 380, no. 1-2, pp. 197–202, 2007.
[26] D. Shemin and D. Rittenberg, “The life span of the human red blood cell,”The Journal of Biological Chemistry, vol. 166, no. 2, pp. 627–636, 1946.
Submit your manuscripts at http://www.hindawi.com
Stem Cells International
Hindawi Publishing Corporation
http://www.hindawi.com Volume 2014
Hindawi Publishing Corporation
http://www.hindawi.com Volume 2014
INFLAMMATION
Hindawi Publishing Corporation
http://www.hindawi.com Volume 2014
Behavioural Neurology
Endocrinology
International Journal ofHindawi Publishing Corporation
http://www.hindawi.com Volume 2014
Hindawi Publishing Corporation
http://www.hindawi.com Volume 2014
Disease Markers
Hindawi Publishing Corporation
http://www.hindawi.com Volume 2014
BioMed
Research International
Oncology
Journal ofHindawi Publishing Corporation
http://www.hindawi.com Volume 2014
Hindawi Publishing Corporation
http://www.hindawi.com Volume 2014
Oxidative Medicine and Cellular Longevity
Hindawi Publishing Corporation
http://www.hindawi.com Volume 2014
PPAR Research The Scientific World Journal
Hindawi Publishing Corporation
http://www.hindawi.com Volume 2014
Immunology Research
Hindawi Publishing Corporation
http://www.hindawi.com Volume 2014
Journal of
Obesity
Journal ofHindawi Publishing Corporation
http://www.hindawi.com Volume 2014
Hindawi Publishing Corporation
http://www.hindawi.com Volume 2014
Computational and Mathematical Methods in Medicine
Ophthalmology
Journal ofHindawi Publishing Corporation
http://www.hindawi.com Volume 2014
Diabetes Research
Journal ofHindawi Publishing Corporation
http://www.hindawi.com Volume 2014
Hindawi Publishing Corporation
http://www.hindawi.com Volume 2014
Research and Treatment
AIDS
Hindawi Publishing Corporation
http://www.hindawi.com Volume 2014
Gastroenterology Research and Practice
Hindawi Publishing Corporation
http://www.hindawi.com Volume 2014
Parkinson’s Disease
Evidence-Based Complementary and Alternative Medicine
Volume 2014 Hindawi Publishing Corporation
http://www.hindawi.com