Left atrial volume changes during exercise stress echocardiography in heart failure and hypertrophic cardiomyopathy
Karina Wierzbowska-Drabik, MD, PhD, Jarosław D. Kasprzak, MD, PhD, Maciej Haberka, MD, PhD, Jesus Peteiro, MD, PhD, Federica Re, MD, PhD, Maria Grazia D’Alfonso, MD, PhD, Fabio Mori, MD, PhD, Eszter D. Palinkas, MD, PhD, Gergely Agoston, MD, PhD, Albert Varga, MD, PhD, Ana Djordjevic-Dikic, MD, PhD, Milorad Tesic, MD, PhD, Angela Zagatina, MD, PhD, Hugo Rodriguez-Zanella, MD, PhD, Iana Simova, MD, PhD, Elisa Merli, MD, PhD, Doralisa Morrone, MD, PhD, Antonello D’Andrea, MD, PhD, Ana C. Camarozano, MD, PhD, Barbara Reisenhofer, MD, PhD, Costantina Prota, MD, PhD, Rodolfo Citro, MD, PhD, Jelena Celutkiene, MD, PhD, Alla Boshchenko, MD, PhD, Quirino Ciampi, MD, PhD, Eugenio Picano, MD, PhD
PII: S1109-9666(22)00018-5
DOI: https://doi.org/10.1016/j.hjc.2022.01.003 Reference: HJC 670
To appear in: Hellenic Journal of Cardiology Received Date: 15 August 2021
Revised Date: 25 January 2022 Accepted Date: 26 January 2022
Please cite this article as: Wierzbowska-Drabik K, Kasprzak JD, Haberka M, Peteiro J, Re F, D’Alfonso MG, Mori F, Palinkas ED, Agoston G, Varga A, Djordjevic-Dikic A, Tesic M, Zagatina A, Rodriguez- Zanella H, Simova I, Merli E, Morrone D, D’Andrea A, Camarozano AC, Reisenhofer B, Prota C, Citro R, Celutkiene J, Boshchenko A, Ciampi Q, Picano E, Left atrial volume changes during exercise stress echocardiography in heart failure and hypertrophic cardiomyopathy, Hellenic Journal of Cardiology, https://doi.org/10.1016/j.hjc.2022.01.003.
This is a PDF file of an article that has undergone enhancements after acceptance, such as the addition of a cover page and metadata, and formatting for readability, but it is not yet the definitive version of record. This version will undergo additional copyediting, typesetting and review before it is published in its final form, but we are providing this version to give early visibility of the article. Please note that,
© 2022 Hellenic Society of Cardiology. Publishing services by Elsevier B.V. All rights reserved.
echocardiography in heart failure and hypertrophic cardiomyopathy
Exercise echocardiography and left atrial changes
Karina Wierzbowska-Drabik MD, PhD1, Jarosław D. Kasprzak MD, PhD2, Maciej Haberka MD, PhD
3, Jesus Peteiro MD, PhD 4, Federica Re MD, PhD 5, Maria Grazia D’Alfonso MD, PhD 6, Fabio Mori MD,PhD 7, Eszter D. Palinkas, MD, PhD 6,7,8, Gergely Agoston MD, PhD 9, Albert Varga MD, PhD
10, Ana Djordjevic-Dikic MD, PhD 10,11, Milorad Tesic MD, PhD 10,11, Angela Zagatina MD, PhD 12, Hugo Rodriguez-Zanella MD, PhD 13, Iana Simova MD, PhD 14, Elisa Merli MD, PhD 15, Doralisa Morrone MD, PhD 16, Antonello D’Andrea MD, PhD 17, Ana C. Camarozano MD, PhD 18, Barbara Reisenhofer MD, PhD 19, Costantina Prota MD, PhD 20, Rodolfo Citro MD, PhD 20, Jelena Celutkiene MD, PhD 21,22, Alla Boshchenko MD, PhD 23, Quirino Ciampi MD, PhD 24, Eugenio Picano MD, PhD
25
Affiliations:
1 Department of Internal Diseases and Clinical Pharmacology, Medical University of Lodz, Poland, 2 Chair and Department of Cardiology, Medical University of Lodz, Poland,
3 Department of Cardiology, SHS, Medical University of Silesia, Katowice, Poland,
4Department of Cardiology a Coruna, Spain, 5San Camillo Hospital, Roma, Italy, 6Careggi University Hospital, Florence, Italy, 7Doctoral School of Clinical Medicine, University of Szeged, Szeged, Hungary, 8 Division of Non-Invasive Cardiology, Department of Internal Medicine, Albert Szent-Gyorgyi Clinical Center, University of Szeged, Szeged, Hungary, 9 University of Szeged, Department of Family Medicine, Szeged, Hungary, 10Clinic for Cardiology, University Clinical Center of Serbia, Belgrade, Serbia, 11School of Medicine, University of Belgrade, Belgrade, Serbia 12Cardiology Department, Saint Petersburg State University Hospital, Saint Petersburg, Russian Federation, 13Instituto Nacional de
Journal Pre-proof
Hospital, Pleven, Bulgaria, 15Department of Cardiology, Faenza, Italy, 16University of Pisa, Pisa, Italy, 17Cardiology Department, Nocera Inferiore, Salerno, Italy 18 Hospital de Clinicas UFPR, Medicine Department, Federal University of Paranà, Curitiba, Brazil, 19Cardiology Division, Pontedera-Volterra Hospital, Florence, Italy20 University Hospital "San Giovanni di Dio e Ruggi D’Aragona”, Salerno, Italy, 21Centre of Cardiac and Vascular Diseases, Institute of Clinical Medicine, Faculty of Medicine, Vilnius University Hospital, Vilnius, Lithuania,
22State Research Institute Centre For Innovative Medicine, Vilnius, Lithuania, 23Cardiology Research Institute, Tomsk National Research Medical Centre of the Russian Academy of Sciences, Tomsk, Russian Federation,24Fatebenefratelli Hospital of Benevento, Italy,
25Institute of Clinical Physiology, CNR, Pisa, Italy.
Address for correspondence (of first and senior author)
Karina Wierzbowska-Drabik MD, PhD, Department of Internal Diseases and Clinical Pharmacology, Medical University of Lodz; Kniaziewicza 1/5, 91-347 Lodz, Poland; e-mail:
wierzbowska@ptkardio.pl
Eugenio Picano MD, PhD, Institute of Clinical Physiology, National Council Research, Via Giuseppe Moruzzi 1, Pisa 56124, Italy; picano@ifc.cnr.it
Relationships with industry and Other Entities: none (for any author)
Wordcount of the whole manuscript (with abstract): 5 226 words.
Journal Pre-proof
Journal Pre-proof
Structured Abstract Background
We assessed feasibility and functional correlates of LAVI (left atrial volume index) changes during exercise stress echocardiography (ESE).
Methods
ESE on bike or treadmill was performed in 363 patients with heart failure with preserved ejection fraction (HFpEF, n = 173), reduced ejection fraction (HFrEF, n = 59) or
hypertrophic cardiomyopathy (HCM, n=131). LAVI stress-rest increase ≥ 6.8 ml/m2 was defined as dilation.
Results
LAVI measurements were feasible in 100%. LAVI did not change in HFrEF being at rest 32 (25-45) vs. at stress 36 (24 – 54) ml/m2, P = NS and in HCM at rest 35 (26 – 48) vs. at stress 38 (28 – 48) ml/m2, P = NS whereas it decreased in HFpEF from 30 (24 -40) to 29 (21 – 37) ml/m2 at stress, P = 0.007. LA dilation occurred in 107 (30%) patients (27% with treadmill vs. 33% with bike ESE, P = NS): 26 with HFpEF (15%), 26 with HFrEF (44%) and 55 with HCM (42%) with P < 0.001 for HFrEF and HCM vs. HFpEF.
Multivariate analysis revealed as the predictors for LAVI dilation E/e’ > 14 at rest with OR 4.4, LVEF < 50% with OR 2.9, and LAVI at rest < 35 ml/m2 with OR 2.7.
Conclusion
Journal Pre-proof
LAVI assessment during ESE was highly feasible and dilation equally frequent with
treadmill or bike. LA dilation was threefold more frequent in HCM and HFrEF and could be predicted by increased resting E/e’ and impaired EF as well as smaller baseline LAVI.
Key words: E/e’ ratio, exercise stress echocardiography, left atrial volume index, left ventricular ejection fraction, mitral regurgitation.
Abbreviations List
ESE - exercise stress echocardiography HCM - hypertrophic cardiomyopathy
HFpEF - heart failure with preserved ejection fraction HFrEF - heart failure with reduced ejection fraction LA- left atrium
LAP- left atrial pressure
LAVI - left atrial volume index
LVCR- left ventricular contractile reserve MR- mitral regurgitation
SPAP - systolic pulmonary artery pressure
Journal Pre-proof
INTRODUCTION
Left atrial volume index (LAVI) is a well-recognized parameter, used not only for left atrium (LA) quantification but strongly recommended over LA diameter for left ventricular diastolic function stratification and used as a potent prognostic marker in a wide range of clinical conditions.1,2,3,4 Its acute changes during stress echocardiography have been so far described in sparse studies with more focus given on long-term remodeling.5,6,7 LAVI in the absence of significant mitral valve stenosis or regurgitation, atrial fibrillation and frequent arrhythmia, especially related to atrio-ventricular dissociation, reflects in the proportional manner the chronically increased filling pressure of the left ventricle, the advancement of diastolic impairment and the myocardial hypertrophy acting as a “barometer of the heart”.
In the previous study from our stress echo 2020 network, Morrone et al. showed 8 that a subset of patients with suspected or diagnosed coronary artery disease undergoing pharmacological or exercise stress echocardiography (ESE) presents LAVI dilation. The pattern of stress-induced LAVI dilation correlated with abnormal left ventricle contractile reserve (LVCR) as well as with the increase of B-lines, a direct sign of pulmonary congestion correlated with an increase in pulmonary capillary wedge pressure.
However, LAVI plays also an important role outside chronic coronary syndromes and ESE is the recommended test modality for applications beyond coronary artery disease.
Our aim was to assess the feasibility and functional correlations of LAVI changes during ESE performed with treadmill or semi-supine bike in patients with heart failure with reduced ejection fraction (HFrEF), heart failure with preserved ejection fraction (HFpEF) and hypertrophic cardiomyopathy (HCM).
Journal Pre-proof
METHODS
The study was approved by the Ethical Committee as a part of the SE 2020 study (148-Comitato Etico Lazio-1, July 16,2016; Clinical trials.Gov Identifier NCT 030.49995).
All patients gave their informed consent to enter the study.
Study group
We included 363 consecutive subjects undergoing clinically-indicated ESE in 17 centers of 10 countries from Europa, Russian Federation and America participating in SE 2020 study described in earlier papers.9,10
Three subgroups were analysed: HFpEF, n=173, HFrEF, n=59, and HCM, n=131.
Detailed inclusion/exclusion criteria were formulated in SE 2020 protocol in respective subprojects of the SE 2020 study. For the present study, the following inclusion/exclusion criteria were accepted:
For all three groups:
- patients aged > 18 years
- good visualization for at least 14 LV segments as the condition for qualification to stress echocardiography
- both sinus rhythm and atrial fibrillation at the baseline assessment were allowed As exclusion criteria served for all groups:
- presence of prognosis-limiting comorbidities, such as advanced cancer, reducing life expectancy to < 1 year
- pregnancy/lactation
- unwillingness to give informed consent and to enter a regular follow-up program.
Specifically, to HFrEF group were included:
- patients with reported diminished exercise tolerance and proved or suspected heart failure with symptoms ranging from I to III NYHA class
- LV ejection fraction < 50% as assessed at baseline echocardiography (etiology of CAD and DCM of heart failure were allowed, significant mitral and aortic valve stenosis and severe primary valve regurgitation excluded)
To HFpEF group:
Journal Pre-proof
- patients with known and suspected heart failure from I to III NYHA class
- LV ejection fraction ≥ 50% at baseline echocardiography, significant mitral and aortic stenosis as well as severe primary valve regurgitation (organic) excluded
- patients with no alternative causes of dyspnea such as anemia and/or chronic obstructive lung disease
To HCM group:
- patients with LV myocardial thickness ≥ 15 mm in any segment in the absence of another cause of LV hypertrophy and resting (or after Valsalva maneuver) left ventricular outflow tract gradient < 50 mmHg
- specific exclusion criteria for this group included phenocopies of HCM such as infiltrative/storage disease (eg, Fabry disease), ejection fraction <45% and history of coronary artery disease.
Echocardiographic rest and stress assessment
Transthoracic echocardiography at rest and ESE was performed with high-end echocardiographic systems. An electrocardiogram (ECG) tracing was displayed on the monitor during the examination. The echocardiographic measurements were acquired following the recommendations.11,12 All echocardiographers in Stress Echo 2020 had passed quality control of reading examinations with interobserver reproducibility exceeding 90%.13 ESE modality was semi-supine bike in 178 and treadmill in 185 patients. Criteria for interrupting the test were chest pain, induced wall motion abnormalities, significant rhythm disturbances, excessive blood pressure increase or hypotonia, limiting dyspnoea and fatigue, legs pain or predicted heart rate.
The definition of LAVI dilation was based on a well validated statistic called reference change value, taking into account biological, analytical and observer variability with LAVI change of ≥ 6.8 ml/m2 between rest and stress considered as a change above background variation and used as a cut-off to identify a LAVI – dilator cohort. 14,5,15
Journal Pre-proof
Statistical analysis
The distribution of variables was assessed with the D’Agostino–Pearson test and adequate parametric or non-parametric tests were used. Accordingly to distribution data was expressed as mean ± standard deviation or median and interquartile range or frequency for categorical data. Multiple-samples comparison was performed with analysis of variance and Newmann–Keuls test or Kruskal-Wallis test respectively. Frequency of categorical data was compared with ch2 test. One-sample comparisons were performed with paired t-test or Wilcoxon test. For correlation Pearson’s or Spearman coefficients were calculated.
Statistical significance was set at P < 0.05. Multivariate stepwise logistic regression analysis was conducted on the variables significant in univariate analysis with P value set at < 0.05 for entering and > 0.1 for removing variable. Analyses were conducted with MedCalc V.
12.1.4. (Frank Schoonjans, Belgium).
RESULTS
Rest and stress characteristic of patients
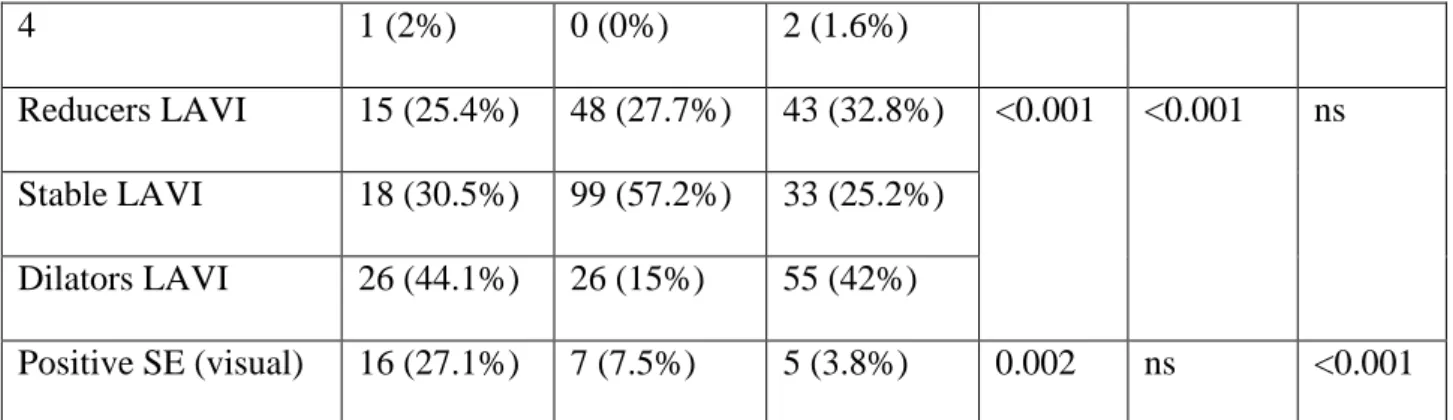
Main characteristics of the study patients at rest and stress are summarized in Table 1 and Table 2. LAVI reducers prevalence was around 30% and similar in all groups, whereas LAVI dilators were 3-times more frequent in HFrEF (44%) and HCM (42%) as compared to HFpEF patients (15%), Table 2.
As far as the comparison between type of ESE is concerned in group examined with ergometer LAVI profiles prevalence was as follow: 26% reducers, 41% with stable LAVI and 33% dilators, whereas in group examined with treadmill there were 32% reducers, 41%
with stable parameter and 27% dilators and this proportions did not differ statistically.
Journal Pre-proof
Predictors of dilated LAVI during ESE
We analyzed patients with reduced (LAVI diminished during stress by > 6.8 ml/m2), stable (stress-rest changes ± 6.8 ml/m2) and dilated LAVI (rest-stress increase > 6.8 ml/m2).
LAVI-reducers displayed higher resting LAVI and less frequent advanced mitral regurgitation (Table 3). At peak ESE dilators showed more frequent MR, lowest LVCR and higher E/e’, Table 4.
Abnormal (>34 ml/m2) LAVI values measured at the peak of ESE better then resting LAVI separated patients with abnormal LVCR, increased E/e’, greater then mild mitral regurgitation and similarly with increased SPAP (Figure 1).
At individual patient analysis based on rest LAVI values 209 patients showed normal (<35 ml/m2), 103 moderately abnormal (35-50 ml/m2) and 51 severely abnormal (>50 ml/m2) LAVI. During stress 170 patients (47%) were reclassified with 88 (24%) increasing their LAVI of at least one grade (Figure 2). Figure 3 displays an example of patient with small reduction of LAVI during ESE.
Predictors of LAVI changes during ESE
Predictors of LAVI dilation detected in univariate and multivariate logistic regression analysis are shown in Table 5. Multivariate stepwise analysis revealed as the predictors for LAVI exercise-related dilation 3 parameters: E/E’ >14 at rest with OR 4.4, 95% CI (1.9- 9.9), rest LVEF < 50% with OR 2.9, 95% CI (1.2 – 6.9) and LAVI at rest < 35 ml/m2 with OR 2.7, 95% CI (1.2 - 6.2).
Finally, we analyzed exercise-related LAVI changes while going from normal filling pressure with E/e’ < 12 at both rest and stress trough mild stage of diastolic dysfunction with E/e’ normal at rest but elevated at stress, towards E/e’ elevation ≥ 12 at both rest and stress and the most advanced stage with E/e’ > 15 at rest and stress. We found that “LAVI volumetric behavior during ESE” reflected consistently LAP pressure burden (revealed as
Journal Pre-proof
noninvasive proxy E/e’ ratio) showing transition from reduction through stabilization towards dilation pattern, see Table 6 and Figure 4.
DISCUSSION
LAVI is a highly dynamic variable and may change substantially during ESE in HFrEF, HFpEF and HCM. In all these conditions, LAVI assessment is feasible with high success rate showing a heterogeneous response at individual patient analysis. LAVI-dilator pattern is threefold more frequent in HFrEF and HCM compared to HFpEF patients. Some functional variables are associated with LAVI-dilator pattern. These variables are the increase in E/e’ (a widely-accepted proxy of increased left ventricular filling pressure), the reduction of LVEF and more frequent and advanced mitral regurgitation. All these variables potentially concur in determining of the increased left atrial pressure through abnormalities of LV diastolic, systolic or mitral valve function. Although to some extent the LAVI dilatation during exercise may act as physiological increasing of atrial reservoir function at a later stage a decompensation occurs with signs of backward failure with possible B-lines appearance, as observed in HFpEF subgroup.
Dilators showed the highest value of E/e’ at rest as well as the higher percentage of moderate and severe MR as compared to reducers. Moreover, at peak stage of ESE, higher E/e’ with more frequent MR (especially advanced grades) as well as lower LVCR and LVEF were observed consistently in dilators group, see Figure 5 (central figure).
One of the most important finding is the relationship between E/e’ values (at rest and peak ESE) and LAVI at rest and peak as well as its dynamics. Achieved results are displayed in Figure 4 and reveal reduction of LAVI in subjects with normal E/e’ (and the lowest LAP pressure) stable LAVI behaviour at early stages of diastolic dysfunction, followed by small and large dilation of median LA (by circa 10 ml/m2) in patients with moderately and severely elevated left atrial pressure.
On the other hand, the pathologic dilation may be limited in most advanced stage by the increasing stiffness of severely remodelled LA. This seems to be supported by the relationship between basal LAVI and LAVI values at peak exercise in our group. According
Journal Pre-proof
to Figure 2 the typical reaction for exercise was in the smallest LA group the stabilisation or increase of volume whereas in the patients with the most enlarged atria more often the reduction of LAVI.
Finally, in multivariable analysis to the predictors of significant increase of LAVI during ESE belonged E/E’ ratio >14 and LVEF lowered < 50%, as well as LAVI < 35 ml/m2 at rest offering still greater potential or reserve for dilation, whereas atria with LAVI > 50 ml/m2 at rest tended to diminished at peak stage.
Comparison with previous studies
Our findings confirm and expand previous, limited experiences showing the high success rate of LAVI imaging during ESE already documented in chronic coronary syndromes, hypertrophic cardiomyopathy, valvular heart disease and heart failure.16
Atrial volume and function during exercise were examined by Schnell F et al. in group of 45 subjects including normal individuals, endurance athletes and patients with chronic thromboembolic pulmonary hypertension (CTEPH).17 The authors observed larger LAVI at rest in athletes (56 ml/m2) then in controls (40 ml/m2) and CTEPH (31 ml/m2) which decreased consistently during exercise.
Contrary, right atrial volume index (RAVI) increased during stress in patients with CTEPH (from 64 to 79 ml/m2) while decreasing in controls and athletes. The authors hypothesised that increase of reservoir function of both atria provides adequate filling for ventricles and maintenance of cardiac output. In their group reservoir function of left atrium was enhanced mainly by diminishing of minimal LAVI (end-diastolic volume) without significant increasing of maximal LAVI (reflecting maximal LA volume during ventricular end systole), nevertheless in more pathological states this may require also the increase of maximal LAVI, what probably took place in our small and large dilators. Pathologic character of significant atrial dilation is suggested by Schnell observation concerning RAVI enlargement in CTEPH patients.
Valuable observation of mechanism of exercise-related lung congestion in patients with HFpEF has been recently published by Reddy et al.18 The authors noticed that patients with HFpEF who developed lung congestion during exercise test, confirmed with B-lines appearance, were
Journal Pre-proof
characterised not only by increased pulmonary capillary wedge pressure but also by increased pulmonary artery and right atrial pressure as well as by indices of deranged right ventricle - pulmonary artery coupling i.e. lower ratios of TAPSE, FAC (fractional area change) and RV S’ to mean pulmonary artery pressure. Nevertheless, in our group only a small subgroup developed pulmonary congestion during ESE and we did not observe significant and consistent impairment of pulmonary pressure and RV function in the LAVI dilators.
We pooled data from semi-supine and treadmill ESE which have different hemodynamic effect and could have influence on volume changes and stress LAV changes to some extent. According to the literature bicycle increases the blood pressure significantly but not so much the heart rate comparing to the treadmill. The final double product is however similar.19 Semi-supine exercise increases pulmonary capillary wedge pressure more than upright exercise, and treadmill increases end-diastolic volume of left ventricle more than semi-supine exercise in healthy subjects.20,21 The observational study design did not interfere with the individual choice of the referring physician, which is a matter of personal experience, awareness of the individual patient indications and local practice. However, the prevalence of LAV dilation, reduction and stabilization was similar with the both tests used in our population, suggesting their comparable impact on left atrium.
Study limitations
Each group had a moderate sample size limiting the statistical strength of subgroup analyses. However, the findings were consistent suggesting that observed functional correlations act similarly across various cardiovascular conditions.
Concentration on volumetric data limited to LA in its reservoir phase neglected more comprehensive analysis of LA function, which however is especially challenging in time- limited settings of ESE.
Journal Pre-proof
We used different exercise modalities, such as treadmill and supine bike with some difference in type of hemodynamic stress induced, which are however both widely accepted for ESE beyond coronary artery diseases.
Despite observed in our study similar prevalence of reduced, stable and dilated LAVI pattern in both bicycle and treadmill tests, more detailed, quantitative comparisons of LAVI reaction to various types of exercise loading in various groups of patients, as well as the dependence from the achieved workload is needed in the future.
Finally, the analysis of clinical outcomes should be advocated in an longitudinal study to understand better the prognostic significance of LAVI changes during ESE.
Conclusions:
LAVI is a relatively simple parameter which can be obtained with high success rate in various cardiovascular conditions from HFrEF to HFpEF and HCM and measured at peak stress reflects the functional status more closely than rest values.
The LAVI dilator pattern is associated with more frequent and severe mitral regurgitation, diastolic dysfunction and pulmonary congestion all known as adverse predictors of outcome. With only minimal increase on analysis time LAVI can be a further useful adjunct to comprehensive SE also beyond coronary artery disease.
Competency in medical knowledge
The echocardiographic assessment of LAVI exercise changes and their classification to proposed patterns of reducers, stable LAVI and dilators provides a novel and integral tool reflecting status and function of both circulations. High feasibility, simplicity, time
Journal Pre-proof
efficiency and non-invasiveness of LAVI assessment supports its wider use in the settings of various ESE and clinical entities.
Translational outlook
Although widely appreciated in resting assessment of left ventricular function LAVI still requires further detailed diagnostic and prognostic evaluation as far as its dynamic changes are concerned. Presented study may be seen as the preliminary confirmation of high feasibility in both kinds of ESE, bike and treadmill based, wide diagnostic potential of LAVI changes assessment in patients with different types of heart failure as well as the indicator of the underestimation of this patient and operator friendly parameter in present clinical practice.
Tables and Figures:
Figure legend:
Figure 1. Functional correlates of LAVI at rest and peak ESE. The comparison of global systolic left ventricular function parameter LVCR (left upper panel), frequency of mitral regurgitation (left lower panel), E/e’ (right upper panel) and SPAP values (right lower panel) between groups with normal/mildly enlarged (white bars) and significantly enlarged LAVI (red bars) assessed at rest (left columns in each panel) and at peak stress (right columns).
The patients with larger LAVI at stress displayed lower LVCR, higher E/e’, SPAP and MR frequency. Stress LAVI was more closely related to impaired hemodynamics.
E/e’ – the ratio of maximal velocity of early wave of mitral inflow (E) to maximal velocity of mitral annulus motion early phase (e’), LAVI- left atrial volume index, LVCR- left ventricular contractility reserve, MR- mitral regurgitation, SPAP- systolic pulmonary artery pressure
Journal Pre-proof
Figure 2. Changes of LAVI during ESE as a function of LAVI at rest.
Central panel displays the numbers of patients transferred between categories of normal or mildly (<35 ml/m2), moderately (35-50 ml/m2) and severely enlarged (>50 ml/m2) LAVI.
During stress 170 patients (47%) were reclassified with 88 (24%) increasing their LAVI of at least one grade. 138 patients from normal resting LAVI group (66%) did not dilate significantly during ESE.
In the group comparison median of normal LAVI increased significantly from 25.8 to 28.9 ml/m2, P < 0.001, whereas the largest LAVI decreased from 60.5 to 38.4 ml/m2, P < 0.0001, and intermediate from 40.2 to 36.4 ml/m2, P = 0.002.
Figure 3. The examples of LAVI measured in 4 chamber and 2 chamber views in patient showing LAVI reduction during ESE.
Patient with BSA 2.2 m2 and slight reduction of LAVI (Δ 5 ml/m2, which is < 6.8 ml/m2 cut- off value) during ESE: from 27 ml/m2 to 22 ml/m2 as calculated for biplane LAVI (given in the Figure) .
Figure 4. Evolution of LAVI ESE - induced changes in relations to E/e’ values at rest and at stress. LAVI seems to compensate the short intervals of elevated E/e’ related to exercise only, but dilates significantly in more advanced stages, while E/e’ is elevated also at rest.
E/e’ – the ratio of maximal velocity of early wave of mitral inflow (E) to maximal velocity of mitral annulus motion early phase (E’), LAVI- left atrial volume index,
Journal Pre-proof
Figure 5. (Graphical abstract) Graphic presentation of pathophysiologic changes of LV function and circulation’s hemodynamics as typical for LAVI reductors or non-dilators (upper panel) and dilators (lower panel).
The upper panel displays normal function of left ventricle (good contractility represented by preserved LVEF or LVCR expressed as triple inward arrows inside the box) as well as not- elevated LV pressure (or its proxy E/e’, illustrated with outward single arrow), normal or elevated only at stress E/e’ ratio (regular circle) and absent B-lines in lungs and MR (clear lungs and mitral valve icons) in the presence of small LA at stress (green LAVI). The opposite situation related to LAVI dilator pattern (red, increased LAVI) is rendered in the lower panel.
E/e’- ratio of early mitral inflow velocity to early mitral annulus motion velocity, LAVI- left atrial volume index, LUNGS- withe icon represents absence of B-lines, partially blue-filled represents water congestion with present B-lines, LV- left ventricle, arrows directed
inwardly represent LVCR (left ventricular contractile reserve) or LVEF (left ventricular ejection fraction) - MV- mitral valve, white circle represent absend or mild MR, red one – the presence of MR above second grade, MR- mitral regurgitation.
Journal Pre-proof
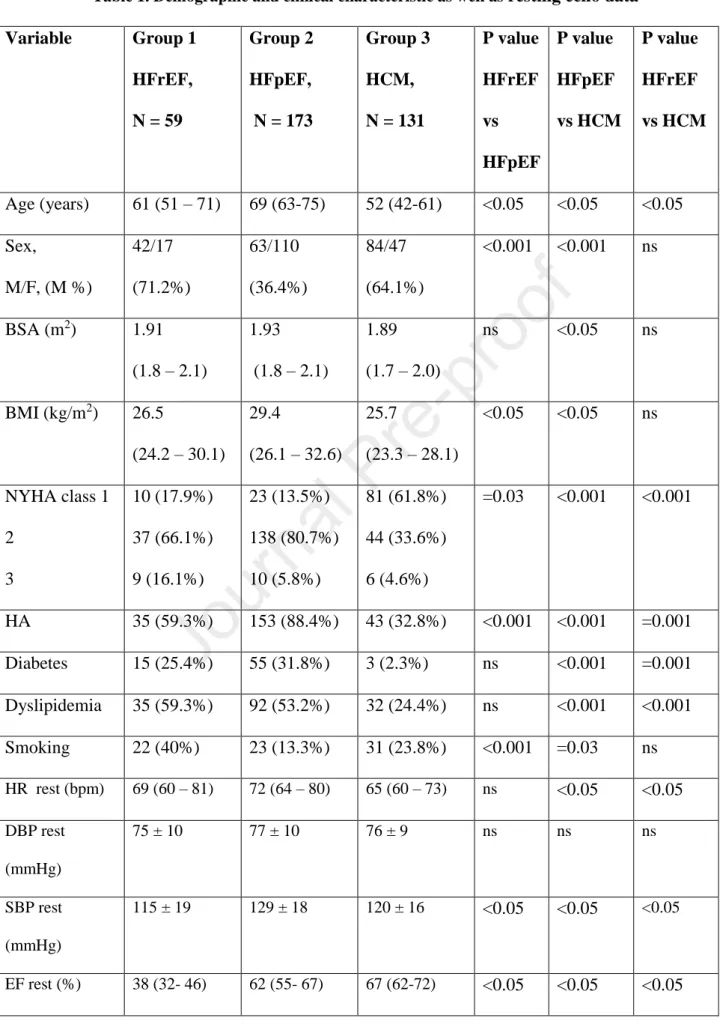
Table 1. Demographic and clinical characteristic as well as resting echo data Variable Group 1
HFrEF, N = 59
Group 2 HFpEF, N = 173
Group 3 HCM, N = 131
P value HFrEF vs HFpEF
P value HFpEF vs HCM
P value HFrEF vs HCM
Age (years) 61 (51 – 71) 69 (63-75) 52 (42-61) <0.05 <0.05 <0.05 Sex,
M/F, (M %)
42/17 (71.2%)
63/110 (36.4%)
84/47 (64.1%)
<0.001 <0.001 ns
BSA (m2) 1.91 (1.8 – 2.1)
1.93
(1.8 – 2.1)
1.89 (1.7 – 2.0)
ns <0.05 ns
BMI (kg/m2) 26.5
(24.2 – 30.1)
29.4
(26.1 – 32.6)
25.7
(23.3 – 28.1)
<0.05 <0.05 ns
NYHA class 1 2
3
10 (17.9%) 37 (66.1%) 9 (16.1%)
23 (13.5%) 138 (80.7%) 10 (5.8%)
81 (61.8%) 44 (33.6%) 6 (4.6%)
=0.03 <0.001 <0.001
HA 35 (59.3%) 153 (88.4%) 43 (32.8%) <0.001 <0.001 =0.001 Diabetes 15 (25.4%) 55 (31.8%) 3 (2.3%) ns <0.001 =0.001 Dyslipidemia 35 (59.3%) 92 (53.2%) 32 (24.4%) ns <0.001 <0.001 Smoking 22 (40%) 23 (13.3%) 31 (23.8%) <0.001 =0.03 ns HR rest (bpm) 69 (60 – 81) 72 (64 – 80) 65 (60 – 73) ns <0.05 <0.05 DBP rest
(mmHg)
75 ± 10 77 ± 10 76 ± 9 ns ns ns
SBP rest (mmHg)
115 ± 19 129 ± 18 120 ± 16 <0.05 <0.05 <0.05
EF rest (%) 38 (32- 46) 62 (55- 67) 67 (62-72) <0.05 <0.05 <0.05
Journal Pre-proof
WMSI rest 2.0 (1.4-2.3) 1.0 (1.0-1.0) 1.0 (1.0-1.0) <0.05 <0.05 <0.05 E/e’ rest 12.9
(9.7 – 16.3)
10.2 (8.3 – 12.6)
9.9
(7.6 – 12.9)
<0.05 ns <0.05
SPAP rest 29 (21-39) 27 (23-36) 28 (25-33) ns ns ns
TAPSE rest 20 (16-24) 24 (21-28) 24 (21-26) <0.05 ns <0.05 B lines rest (n) 0 (0-4) 1 (0-3) 0 (0-0) ns <0.05 <0.05 LAVI rest
(ml/m2)
32 (25 - 45) 30 (24 – 40) 35 (26 – 48) ns <0.05 ns
MR rest 0 1
2 3
17 (28.8%) 25 (42.2%) 12 (20.3%) 5 (8.5%)
115 (66.9%) 49 (28.5%) 6 (3.5%) 2 (1.2%)
61 (47.3%) 51 (39.5%) 16 (12.4%) 1 (0.8%)
<0.001 =0.001 =0.006
HR- heart rate, DPB- diastolic blood pressure, SBP- systolic blood pressure, EF- ejection fraction, WMSI- wall motion score index, LAD- left anterior descending coronary artery, LAVI- left atrial volume index
Journal Pre-proof
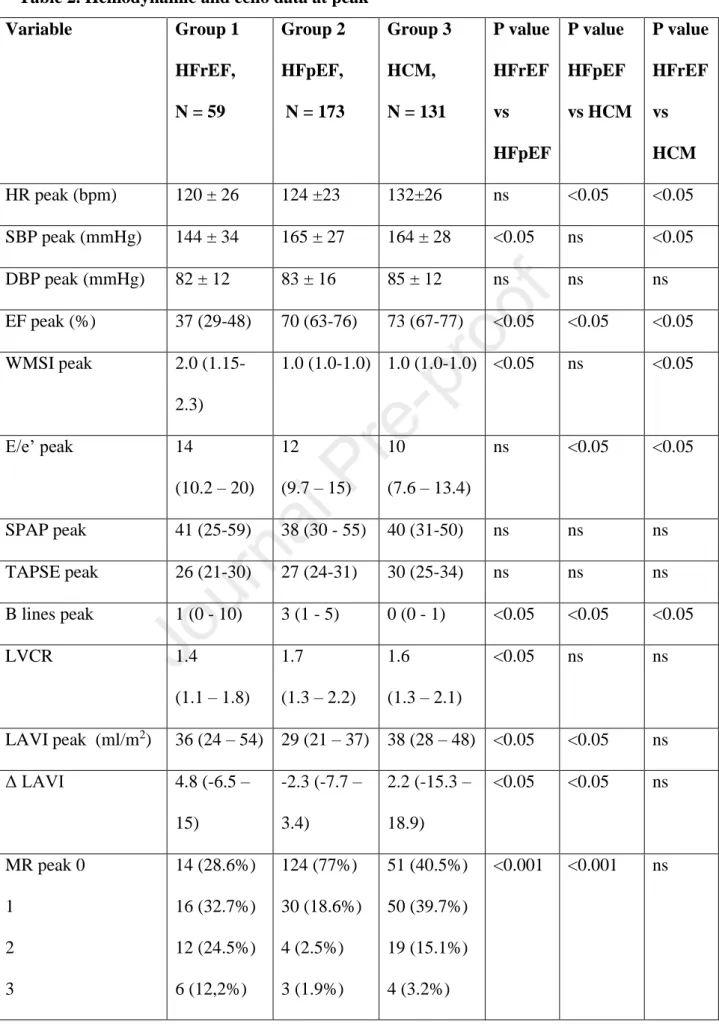
Table 2. Hemodynamic and echo data at peak
Variable Group 1
HFrEF, N = 59
Group 2 HFpEF, N = 173
Group 3 HCM, N = 131
P value HFrEF vs HFpEF
P value HFpEF vs HCM
P value HFrEF vs HCM HR peak (bpm) 120 ± 26 124 ±23 132±26 ns <0.05 <0.05 SBP peak (mmHg) 144 ± 34 165 ± 27 164 ± 28 <0.05 ns <0.05
DBP peak (mmHg) 82 ± 12 83 ± 16 85 ± 12 ns ns ns
EF peak (%) 37 (29-48) 70 (63-76) 73 (67-77) <0.05 <0.05 <0.05 WMSI peak 2.0 (1.15-
2.3)
1.0 (1.0-1.0) 1.0 (1.0-1.0) <0.05 ns <0.05
E/e’ peak 14
(10.2 – 20) 12 (9.7 – 15)
10
(7.6 – 13.4)
ns <0.05 <0.05
SPAP peak 41 (25-59) 38 (30 - 55) 40 (31-50) ns ns ns
TAPSE peak 26 (21-30) 27 (24-31) 30 (25-34) ns ns ns
B lines peak 1 (0 - 10) 3 (1 - 5) 0 (0 - 1) <0.05 <0.05 <0.05
LVCR 1.4
(1.1 – 1.8)
1.7 (1.3 – 2.2)
1.6 (1.3 – 2.1)
<0.05 ns ns
LAVI peak (ml/m2) 36 (24 – 54) 29 (21 – 37) 38 (28 – 48) <0.05 <0.05 ns
Δ LAVI 4.8 (-6.5 –
15)
-2.3 (-7.7 – 3.4)
2.2 (-15.3 – 18.9)
<0.05 <0.05 ns
MR peak 0 1
2 3
14 (28.6%) 16 (32.7%) 12 (24.5%) 6 (12,2%)
124 (77%) 30 (18.6%) 4 (2.5%) 3 (1.9%)
51 (40.5%) 50 (39.7%) 19 (15.1%) 4 (3.2%)
<0.001 <0.001 ns
Journal Pre-proof
4 1 (2%) 0 (0%) 2 (1.6%)
Reducers LAVI 15 (25.4%) 48 (27.7%) 43 (32.8%) <0.001 <0.001 ns Stable LAVI 18 (30.5%) 99 (57.2%) 33 (25.2%)
Dilators LAVI 26 (44.1%) 26 (15%) 55 (42%)
Positive SE (visual) 16 (27.1%) 7 (7.5%) 5 (3.8%) 0.002 ns <0.001 HR- heart rate, DPB- diastolic blood pressure, SBP- systolic blood pressure, EF- ejection fraction, WMSI- wall motion score index, LVCR- left ventricular contractile reserve (Force at peak/Force rest ratio; Force = SBP/LVESV, LVESV
Table 3. Resting characteristic of groups with reduced, stable and dilated LAVI.
Variable Group 1 Reduced LAVI N = 106
Group 2 Stable LAVI, N = 150
Group 3 Dilated LAVI N = 107
P value reduced vs stable
P value stable vs dilated
P value reduced vs dilated
Age 62 ( 44 – 71) 66 (55 – 71) 61 (49 – 70) ns ns ns
Sex M (%) 54 (50.9%) 70 (46.7%) 65 (60.7%) ns =0.04 ns
BMI 26.9
(24.2 – 30.9)
28.1
( 25.1 – 30.8) 26.8
(24.4 – 30.4)
ns ns ns
BSA 1.9 (1.72 – 2.05) 1.9
(1.78 – 2.06) 1.92
(1.76 – 2.08)
ns ns ns
NYHA class 1
2 3
38 (36.5%) 61 (58.7%) 5 (4.8%)
39 (26.5%) 100 (68%) 8 (5.4%)
37 (34.6%) 58 (54.2%) 12 (11.2%)
ns ns ns
Hypertension 58 (54.7%) 113 (75.3%) 60 (56.1%) =0.0009 =0.002 ns
Diabetes 19 (17.9%) 36 (24.0%) 18 (16.8%) ns ns ns
Dyslipidemia 42 (39.6%) 72 (48%) 45 (42.1%) ns ns ns
Smoking 14 (13.2%) 32 (21.6%) 30 (28.8%) ns ns =0.009
Journal Pre-proof
HR rest (bpm) 71 ( 63 – 80) 70 (62 – 77) 69 (60 – 78) ns ns ns SBP rest
(mmHg)
124 ± 18 127 ± 19 119 ± 18 ns <0.05 ns
DBP rest (mmHg)
80 (70-80) 80 (70-80) 74 (70-80) ns ns ns
EF rest (%) 64 ( 57 – 69) 62 (54- 68) 60 (45 – 69) ns ns ns WMSI rest 1.0 ( 1.0-1.0) 1.0 ( 1.0-1.0) 1.0 ( 1.0-1.39) ns ns ns E/e’ rest 10 (8- 13.2) 10 (8 – 12) 11.3 (8 – 15.4) ns <0.05 <0.05
SPAP rest 26 (23-30) 28 (22-36) 30 (25-35) ns ns ns
TAPSE rest 24 (20 – 26) 23 (21 – 27) 23 (20 - 26) ns ns ns
B lines rest (n) 0 (0-1.0) 0 (0-2.5) 0 (0-2.0) ns ns ns
LAVI rest (ml/m2)
44 (36 – 55) 29 (22- 38) 27 (23 – 34) <0.05 ns <0.05
MR rest 0 1 2 3
75 (70.8%) 28 (26.4%) 3 (2.8%) 0 (0)
69 (46.6%) 61 (41.2%) 17 (11.5%) 1 (0.7%)
49 (46.2%) 36 (34%) 14 (13.2%) 7 (6.6%)
<0.001 0.048 <0.001
Journal Pre-proof
Table 4. Peak stress characteristic of reduced, stable and dilated LAVI during ESE
Variable Group 1
Reduced LAVI N = 106
Group 2 Stable LAVI, N = 150
Group 3 Dilated LAVI N = 107
P value reduced vs stable
P value stable vs dilated
P value reduced vs dilated HR peak (bpm) 130 (116 – 150) 121 (107 – 137) 125 (106 – 140) <0.05 ns <0.05 SBP peak (mmHg) 167 (150 – 180) 160 (145 – 180) 150 (135 – 171) ns <0.05 <0.05
DBP peak (mmHg) 80 (80-90) 80 (79 - 94) 80 (70-90) ns ns ns
EF peak 71 (62 - 77) 68 (60 - 75) 67 (52 - 75) ns ns <0.05
WMSI peak 1.0 (1.0-1.0) 1.0 (1.0-1.0) 1.0 (1.0-1.13) ns ns ns
E/e’ peak 10.8 (8.1 – 14.2) 11.1 (8.5 - 14) 13 (9.9-16.6) ns <0.05 <0.05
SPAP peak * 37 (25 - 51) 39 (30 - 53) 42 (35 - 55) ns ns ns
TAPSE peak 29 (25 - 33) 27 (23 - 31) 27 (22 - 31) ns ns ns
B lines peak 0.5 (0 - 2.0) 3.0 (0 - 5.8) 1.0 (0 - 4.0) ns ns ns
LVCR 1.71 (1.4 – 2.47) 1.63 (1.3 – 2.09) 1.4 (1.06 – 1.9) ns <0.05 <0.05 LAVI peak
(ml/m2)
27 (20 - 34) 29 (23 - 37) 47 (37 - 60) <0.05 <0.05 <0.05
Δ LAVI -14.6 (-25.05 - -9.07)
0.0 (-3.05 – 3.11) 16.6 (10.4 – 29.7)
<0.05 <0.05 <0.05
MR peak 0
1 2 3 4
70 (68.6%) 25 (24.5%) 6 (5.9%) 1 (1.0%) 0 (0%)
76 (58%) 38 (29%) 12 (9.2%) 4 (3.1%) 1 (0.8%)
43 (41.7%) 33 (32%) 17 (16.5%) 8 (7.8%) 2 (1.9%)
ns ns <0.001
SPAP peak feasibile Reduced n= 40, stable n = 68, dilated n = 58
Journal Pre-proof
Table 5. Univariate and multivariate analysis of predictors for ESE related LAVI dilation.
Univariate analysis in whole group
Multivariate analysis in whole group
Parameter OR 95% CI P OR 95% CI P
E/e rest >14 3.0 1.8 – 5.1 <0.001 4.4 1.9 – 9.9 <0.001 E/e stress >14 2.1 1.3 – 3.5 0.003
MR rest >
2nd grade
17.9 2.2 – 147.3 0.007
MR stress >
2nd grade
4.1 1.4 – 11.5 0.008
LVEF < 50% 2.0 1.2 – 3.4 0.01 2.9 1.2 – 6.9 0.01 LVCR < 2 2.1 1.2 – 3.6 0.01
B-lines rest
>10
15.4 1.8 - 131 0.012 B-lines stress
>10
3.8 1.3 – 11.1 0.016 LAVI rest <
35 ml/m2
3.1 1.9 – 5.2 <0.001 2.7 1.2 – 6.2 0.02 Multivariate analysis
in HFpEF
Multivariate analysis in HFrEF
Multivariate analysis in HCM Parameter OR 95% CI P OR 95% CI P OR 95% CI P E/e rest
>14
na na na na na na 5.0 1.5 – 16.3 0.007
E/e stress
>14
na na na 9.0 2.1- 37.5 0.003 na na na
LAVI rest
< 35 ml/m2
5.2 1.5 – 18.2 0.01 na na na 9.6 3.9 – 23.2 <0.001
Journal Pre-proof
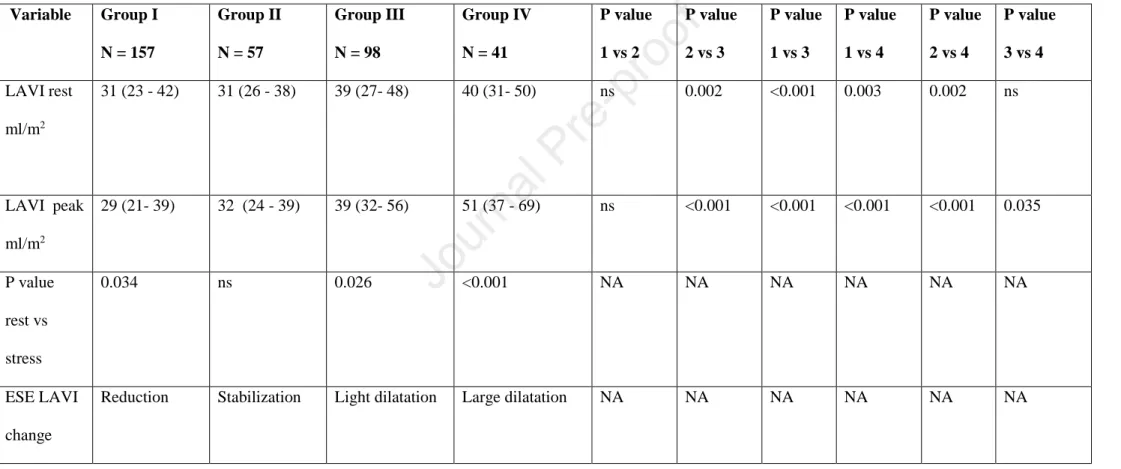
Table 6. Natural history of LA dysfunction. Comparison between LAVI in group I: normal or mildly increased E/e’ both at rest and stress (<12), group II with substantial increase of E/e’ during stress only (<12 at rest and ≥12 at peak EXE) and group III with E/e’
elevated in rest and stress ≥12. Additionally group IV with very high E/e’ at rest and stress (>15 at both stages) was analyzed showing extreme dilation of left atrium during stress.
Variable Group I N = 157
Group II N = 57
Group III N = 98
Group IV N = 41
P value 1 vs 2
P value 2 vs 3
P value 1 vs 3
P value 1 vs 4
P value 2 vs 4
P value 3 vs 4 LAVI rest
ml/m2
31 (23 - 42) 31 (26 - 38) 39 (27- 48) 40 (31- 50) ns 0.002 <0.001 0.003 0.002 ns
LAVI peak ml/m2
29 (21- 39) 32 (24 - 39) 39 (32- 56) 51 (37 - 69) ns <0.001 <0.001 <0.001 <0.001 0.035
P value rest vs stress
0.034 ns 0.026 <0.001 NA NA NA NA NA NA
ESE LAVI change
Reduction Stabilization Light dilatation Large dilatation NA NA NA NA NA NA
Journal Pre-proof
References
1 Nagueh SF, Smiseth OA, Appleton CP, et al. Recommendations for the Evaluation of Left Ventricular Diastolic Function by Echocardiography: An Update from the American Society of Echocardiography and the European Association of Cardiovascular Imaging J Am Soc Echocardiogr 2016;29:277-314.
2 Pieske B, Tschöpe C, de Boer RA, et al. How to diagnose heart failure with preserved ejection fraction: the HFA-PEFF diagnostic algorithm: a consensus recommendation from the Heart Failure Association (HFA) of the European Society of Cardiology (ESC). Eur Heart J. 2019;40:3297-3317.
3 Wierzbowska-Drabik K, Krzemińska-Pakula M, Drozdz J, et al. Enlarged left atrium is a simple and strong predictor of poor prognosis in patients after myocardial infarction.
Echocardiography. 2008;25:27-35.
4 Thomas L, Marwick TH, Popescu BA, Donal E, Badano LP. Left atrial structure and function, and left ventricular diastolic dysfunction: JACC state-of-the-art. Review. J Am Coll Cardiol 2019;73:1961-77.
5 Wożakowska-Kaplon B. Changes in left atrial size in patients with persistent atrial fibrillation: a prospective echocardiographic study with a 5-year follow-up period.
International Journal of Cardiology 2005:47-52.
6 Kanar B, Ozben B, Kanar AS, Arsan A, Tigen K. Left atrial volume changes are an early marker of end-organ damage in essential hypertension: A multidisciplinary approach to an old problem. Echocardiography 2017;34:1895-1902.
7 D’Andrea, Bossone E, Radmilovic J, et al. Exercise-Induced Atrial Remodeling: The Forgotten Chamber. Cardiol Clin 2016; 34: 557-65.
Journal Pre-proof
8 Morrone D, Arbucci R, Wierzbowska-Drabik K, et al. Feasibility and functional correlates of left atrial volume changes during stress echocardiography in chronić coronary syndromes.
Int J Cardiovasc Imag 2021;37:953-64.
9 Picano E, Ciampi Q, Citro R, et al. on behalf of Stress Echo 2020 study group of the Italian Society of Cardiovascular Echography. Stress echo 2020: The international Stress Echo study in ischemic and non-ischemic heart disease. Cardiovasc Ultrasound. 2017;18;:3.
10 Picano E, Ciampi Q, Wierzbowska-Drabik K, Urluescu ML, Morrone D, Carpeggiani C.
The new clinical standard of integrated quadruple stress echocardiography with ABCD protocol. Cardiovasc Ultrasound 2018;16:22
11 Lang RM, Badano LP, Mor-Avi V, et al. Recommendations for cardiac chamber quantification by echocardiography in adults: an update from the American Society of Echocardiography and the European Association of Cardiovascular Imaging. Eur Heart J Cardiovasc Imaging. 2015;16:233–70.
12 Lancellotti P, Pellikka PA, Budts W, et al. The clinical use of stress echocardiography in non-ischaemic heart disease: recommendations from the European Association of Cardiovascular Imaging and the American Society of Echocardiography. Eur Heart J Cardiovasc Imaging 2016;17:1191–229.
13 Ciampi Q, Picano E, Paterni M, et al.; on behalf of Stress Echo 2020. Quality control of regional wall motion analysis in Stress Echo 2020. Int J Cardiol 2017;249:479–85.
14 Collier P, Watson CJ, Waterhouse DF, et al. Progression of left atrial volume index in a population at risk for heart failure: a substudy of the STOP-HF (St Vincent’s Screening TO Prevent Heart Failure) trial. Eur J Heart Fail 2012;14:957–964.
15 Aune E, Baekkevar M, Roislien J, Rodevand O, Otterstad JE. Normal reference ranges for left and right atrial volume indexes and ejection fractions obtained with real-time three- dimensional echocardiography. European Journal of Echocardiography 2009;10:738-44.
Journal Pre-proof
16 Sugimoto T, Bandera F, Generati G, et al. Left atrial dynamics during exercise in mitral regurgitation of primary and secondary origin: pathophysiological insights by exercise echocardiography combined with gas exchange analysis. J Am Coll Cardiol Img 2020;
13:25-40.
17 Schnell F, Claessen G, La Gerche A, et al. Atrial volume and function during exercise in health and disease. Journal of Cardiovascular Magnetic Resonance 2017;19:104.
18 Reddy YNV, Obokata M, Wiley B, et al. The haemodynamic basis of lung congestion during exercise in heart failure with preserved ejection fraction. European Heart Journal 2019;40:3721-30.
19 Badruddin SM, Ahmad A, Mickelson J, Abukhalil J, Winters WL, Nagueh SF, Zoghbi WA. Supine bicycle versus post-treadmill exercise echocardiography in the detection of myocardial ischemia: a randomized single-blind crossover trial. J Am Coll Cardiol.
1999;33:1485-90.
20 Mizumi S, Goda A, Takeuchi K, Kikuchi H, Inami T, Soejima K, Satoh T. Effects of body position during cardiopulmonary exercise testing with right heart catheterization. Physiol Rep. 2018;6(23):e13945.
21 Pellikka PA, Arruda-Olson A, Chaudhry FA, Chen MH, Marshall JE, Porter TR, Sawada SG. Guidelines for Performance, Interpretation, and Application of Stress Echocardiography in Ischemic Heart Disease: From the American Society of Echocardiography. J Am Soc Echocardiogr. 2020;33(1):1-41.e8.