Assessment of global tissue perfusion and oxygenation in neonates and infants after open-heart surgery
†Mihály Gergely
a, László Ablonczy
b, Edgár A. Székely
a, Erzsébet Sápi
a, János Gál
c, András Szatmári
band Andrea Székely
a,c,*
a Department of Anesthesiology and Intensive Therapy, Gottsegen György Hungarian Institute of Cardiology, Budapest, Hungary
b Department of Pediatric Cardiology, Gottsegen György Hungarian Institute of Cardiology, Budapest, Hungary
c Department of Anesthesiology and Intensive Therapy, Semmelweis University, Budapest, Hungary
* Corresponding author. Haller Street 29, 1096 Budapest, Hungary. Tel: +36-1-2151220; fax: +36-1-2157096; e-mail: andi_szekely@yahoo.com (Andrea Székely).
Received 1 September 2013; received in revised form 26 November 2013; accepted 3 December 2013
Abstract
OBJECTIVES: Monitoring and preserving adequate perfusion and oxygen balance is a primary objective of critical care. This prospective observational study aimed to assess the relationship between global haemodynamic parameters and variables reflecting tissue oxygen- ation during the early period following corrective cardiac surgery in neonates and infants. The postoperative time course of oxygen deliv- ery and consumption was evaluated. As surrogate markers of oxygen balance, the central venous oxygen saturation (ScvO2) and venoarterial PCO2difference (PvaCO2) were thoroughly investigated.
METHODS: Thirteen children <1 year of age who underwent open-heart surgery were prospectively enrolled. In addition to conventional postoperative monitoring, transpulmonary thermodilution (TPTD) was used to monitor cardiac output and calculate oxygen delivery and consumption. In parallel with each TPTD measurement, arterial and central venous blood gas values were recorded. Global haemodynamic parameters and oxygenation measurements were compared with weighted linear regression statistics and Pearson’s correlation coefficient.
RESULTS: Data from 145 TPTD measurements and 304 blood gas samples were recorded. The early postoperative period was characterized by a supply-dependent oxygen consumption, as demonstrated by the direct correlation between the change in oxygen delivery and con- sumption (r= 0.62,P< 0.001). Regarding haemodynamic parameters, none of the heart rate, mean arterial pressure or cardiac index corre- lated with the measured ScvO2. However, the ScvO2and PvaCO2were found to correlate significantly (r=−0.49,P< 0.001), and both strongly related to oxygen extraction.
CONCLUSIONS: Both the ScvO2and PvaCO2are reliable and comparable parameters in following tissue oxygen balance during the early postoperative course after open-heart surgery in neonates and infants. As part of multiparameter monitoring, our data highlight the import- ance of regular ScvO2measurements and PvaCO2calculations in paediatric intensive care.
Keywords:Haemodynamics•Thermodilution•Oxygen consumption•Critical care
INTRODUCTION
Maintaining adequate tissue oxygenation has particular priority in critical care. The basic concept of closely controlling the ap- propriate balance between systemic oxygen delivery (DO2) and consumption (VO2) evolved early from animal studies [1, 2].
Later, when investigating high-risk surgical patients postopera- tively, improved survival was found when higher oxygen delivery and cardiac index (CI) values were targeted [3]. However, the benefit of maintaining supranormal DO2values has been ques- tioned in many studies [4]. The goals of haemodynamic opti- mization in critically ill patients are still an ongoing matter of discussion [5,6].
In conventional monitoring, pressure-based haemodynamic parameters and heart rate (HR) are influenced by many factors that are not specific and sensitive variables to follow tissue oxy- genation [7]. Volumetric parameters give a more complex picture of haemodynamics, but cardiac output (CO) in small children varies over a wide range depending on the actual needs, and normal values can be difficult to define. Concerning the adequacy of a measured CO, many factors should be considered. Global blood flow should always be interpreted in conjunction with oxygen balance.
The central venous oxygen saturation (ScvO2) has become an important and widely accepted indicator of the balance between oxygen supply and demand. Targeting ScvO2> 70% is recom- mended in both adult and paediatric sepsis guidelines as a thera- peutic goal [8, 9]. In paediatric patients, the global oxygen consumption is influenced by the higher basal metabolic rate, and different haemodynamic compensatory mechanisms are applied.
†Presented at the 2011 annual meeting of the European Association of Cardiothoracic Anesthesiologists (EACTA) in Vienna, Austria, 1-4 June 2011.
© The Author 2014. Published by Oxford University Press on behalf of the European Association for Cardio-Thoracic Surgery. All rights reserved.
Interactive CardioVascular and Thoracic Surgery 18 (2014) 426–431
ORIGINAL ARTICLE – CONGENITAL
doi:10.1093/icvts/ivt537 Advance Access publication 12 January 2014
necessary adaptations for substantially decreased oxygen supply should also be considered.
Data regarding the relationship between ScvO2and global cir- culatory parameters in paediatric patients, particularly in small children, are scarce. The aim of this prospective observational study was to evaluate the global indices of tissue perfusion and oxygenation in the early postoperative period following open- heart surgery in neonates and infants. In particular, the ScvO2and venoarterial PCO2 difference (PvaCO2) was tested as a surrogate marker of oxygen balance.
MATERIALS AND METHODS
Thirteen children undergoing complete surgical correction of congenital heart defects with cardiopulmonary bypass were en- rolled consecutively in this prospective observational study. Each patient was under 1 year of age and weighed <10 kg. The study was approved by the Ethics Committee of Gottsegen György Hungarian Institute of Cardiology, and parental informed consent was obtained for each patient.
After anaesthetic induction, a right internal jugular vein catheter (4–5 Fr) and a 3-Fr thermistor-tippedfibreoptic femoral arterial catheter (PVPK2013L07-N, Pulsion Medical Systems, Munich, Germany) were inserted according to anatomic landmark orienta- tion. CO and complex volumetric monitoring was carried out using transpulmonary thermodilution (TPTD) with PiCCO-plus bedside haemodynamic monitor (V4.12, Pulsion Medical Systems, Munich, Germany). Intraoperative data were collected from the overview of the surgical and anaesthesia reports.
After admission to the postoperative paediatric intensive care unit, conventional haemodynamic parameters were continuously monitored (two-channel electrocardiogram, HR, mean arterial pressure [MAP], central venous pressure [CVP], pulse oximetry [SpO2] [Philips Medical Systems, Andover, MA, USA]).
TPTD measurements were performed at least once in every 6 h.
For TPTD, the mean of three consecutively repeated tests with bolus injections of 3 ml of cold (T < 8°C) saline was calculated and registered. We recorded the CI, stroke volume index, global end- diastolic volume index, extravascular lung water index, systemic vascular resistance index (SVRI) and core temperature (T).
In parallel with each TPTD measurement, arterial and central venous blood gas samples were drawn and analysed (Cobas b 221, Roche Ltd, Basel, Switzerland). The arterial and venous oxygen partial pressure (PaO2, PvO2), carbon dioxide partial pressure (PaCO2, PvCO2), oxygen saturation (SaO2, ScvO2), pH, base excess and haemoglobin concentration (Hgb) were recorded. According to standard formulae, the following derived variables were calcu- lated:
(i) CaO2(arterial oxygen content) = 1.34 × Hgb × SaO2+ 0.0031 × PaO2,
(ii) CvO2(venous oxygen content) = 1.34 × Hgb × ScvO2+ 0.0031 × PvO2,
(iii) CavO2 (arterio-venous oxygen content difference) = CaO2− CvO2,
(iv) DO2i (oxygen delivery indexed for body surface area) = CO × CaO2/BSA,
(v) VO2i (oxygen consumption indexed for body surface area) = CO × (CaO2−CvO2)/BSA and
(vi) Oxygen extraction (OER) = 100 × VO2i/DO2i.
of a cumulative inotrope index previously proposed by Wernovskyet al. [10]: dopamine (µg/kg/min) + dobutamine (µg/
kg/min) + 100 × epinephrine (µg/kg/min) + 100 × norepinephrine (µg/kg/min) + 20 × milrinone (µg/kg/min).
During the investigated postoperative period, assisted conven- tional ventilation was applied with positive end-expiratory pres- sure of 4–6 cmH2O; FiO2 40–75%; tidal volume 8 ml/kg and targeted PaCO2 35–40 mmHg. None of the enrolled children required invasive mechanical ventilation due to pulmonary com- plications. The main ventilation parameters (inspired fraction of oxygen [FiO2], positive end-expiratory pressure and peak inspira- tory pressure) were recorded. Derived indices assessing oxygen uptake in the lungs, including the PaO2/FiO2and alveolar-arterial oxygen difference, were also calculated. An institutional protocol was used for weaning. Pulmonary hypertension requiring therapy did not occur. Children presenting with relevant postoperative intracardiac shunt or significant valve dysfunction were excluded using intra- and postoperative echocardiography.
STATISTICS
The results are reported as the means ± standard deviations (SDs).
For multiple comparisons of repeated measurements, the para- meters were compared using repeated measures analysis of vari- ance (ANOVA) withpost hocBonferroni correction. In parallel with each TPTD measurements, a single measure of conventional haemodynamic variables (MAP, CVP and HR) and blood gas para- meters were collected and correlated. The pair-wise relationships between the parameters were evaluated using Pearson’s correl- ation coefficient. To avoid violating the test assumption for inde- pendent measurements, a weighted linear regression analysis was also applied after the means of the parameters for each subject had been calculated. Delta values (Δ) referring to the percentage change between two consecutive measurements of each param- eter were also calculated. Statistical significance was defined at a P-value of <0.05. For statistical evaluation, SPSS for Windows 11.5.0 (SPSS, Inc., Chicago, IL, USA) was used.
RESULTS
The major demographic and perioperative characteristics of the 13 enrolled children are presented in Table1.The patients under- went surgical correction at a mean age of 128 (SD: 126) days and weighing 4.6 ± 1.3 kg. The mean postoperative paediatric intensive care unit observation time was 8 (SD: 4.4) days. During the study period, data from 145 TPTD measurements and 304 blood gas samples were recorded. The average time of weaning from venti- lation was 127 h (SD: 81), and none of the children required rein- tubation.
The summary of the first postoperative 48-h basic haemo- dynamic parameters, volumetric measurements, blood gas values, derived tissue oxygenation indices and cumulative inotropic score are presented in a 6-h time frame in Table2. Concerning the haemodynamic parameters, the MAP, CVP, CI and stroke volume index showed a tendency towards a significant increase during this early period. In the investigated group of patients, a mildly decreased overall DO2i was calculated, but the VO2i was found to be relatively stable. Oxygen delivery rose without changes in oxygen consumption and extraction. In parallel with these changes, the PvaCO2 tended to decrease significantly, and the
ORIGINALARTICLE
base excess was also found to improve considerably. A significant increase in the Hgb level was found between T1 and T2.
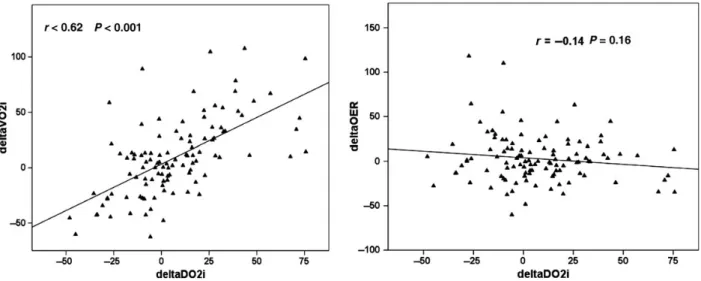
According to the relationship between theΔDO2i, ΔVO2i and ΔOER, the early postoperative period was characterized by oxygen supply dependency (Figs1A and B).
We investigated the relationship between conventional haemo- dynamic parameters, TPTD-derived values and parameters reflect- ing global tissue oxygenation. None of the HR, MAP, CVP or
volumetric parameters proved to correlate with the tissue oxygen- ation variables (Table3). Similar results were found when examining the relationships between the percentage changes between two consecutive measurements of these parameters. Accordingly, the ΔCI andΔScvO2(r= 0.09,P= 0.33) showed no significant association.
The calculated inotropic index did not prove to have relevant, direct impact on the VO2i (r= 0.02, P= 0.96), OER (r= 0.21, P= 0.49), ScvO2(r= 0.19,P= 0.51) and PvaCO2(r= 0.43,P= 0.14). Table 1: Basic characteristics and perioperative data of patients
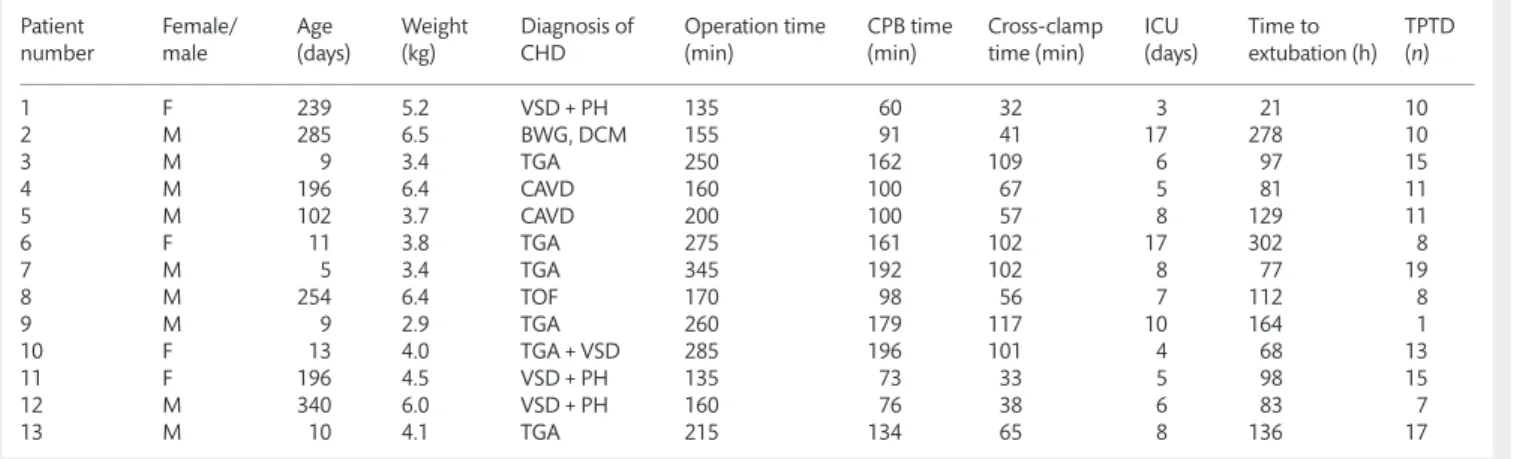
Patient number
Female/
male
Age (days)
Weight (kg)
Diagnosis of CHD
Operation time (min)
CPB time (min)
Cross-clamp time (min)
ICU (days)
Time to extubation (h)
TPTD (n)
1 F 239 5.2 VSD + PH 135 60 32 3 21 10
2 M 285 6.5 BWG, DCM 155 91 41 17 278 10
3 M 9 3.4 TGA 250 162 109 6 97 15
4 M 196 6.4 CAVD 160 100 67 5 81 11
5 M 102 3.7 CAVD 200 100 57 8 129 11
6 F 11 3.8 TGA 275 161 102 17 302 8
7 M 5 3.4 TGA 345 192 102 8 77 19
8 M 254 6.4 TOF 170 98 56 7 112 8
9 M 9 2.9 TGA 260 179 117 10 164 1
10 F 13 4.0 TGA + VSD 285 196 101 4 68 13
11 F 196 4.5 VSD + PH 135 73 33 5 98 15
12 M 340 6.0 VSD + PH 160 76 38 6 83 7
13 M 10 4.1 TGA 215 134 65 8 136 17
CHD: congenital heart disease; VSD: ventricular septal defect; PH: pulmonary hypertension; BWG: Bland–White–Garland syndrome; DCM: dilated cardiomyopathy; TGA: transposition of great arteries; CAVD: complete atrioventricular septal defect; TOF: tetralogy of Fallot; CPB time: cardiopulmonary bypass time; TPTD: transpulmonary thermodilution.
Table 2: Results of haemodynamic parameters, TPTD-derived indices, blood gas data, calculated oxygenation variables and cumulative inotropic index in a 6-h time frame following admission to the paediatric intensive care unit
Postoperative time T1 (0–6 h) T2 (6–12 h) T3 (12–18 h) T4 (18–24 h) T5 (24–30 h) T6 (30–36 h) T7 (36–42 h) T8 (42–48 h) ANOVA (P-value)
MAP (mmHg) 57 ± 4 60 ± 4 58 ± 5 56 ± 4 66 ± 13 67 ± 13 68 ± 13 73 ± 9a 0.001
HR (bpm) 151 ± 18 145 ± 12 148 ± 21 143 ± 17 144 ± 10 145 ± 9 139 ± 14 138 ± 11 0.54
CVP (mmHg) 7.6 ± 3.3 9.1 ± 2.7 9.6 ± 2.2 9.0 ± 2.3 10.7 ± 2.7 11.3 ± 2.2 10.7 ± 1.9a 11.7 ± 3.0 0.039 CI (l/min/m2) 3.17 ± 0.6 3.24 ± 0.9 3.07 ± 0.9 3.12 ± 0.9 3.78 ± 1.3 3.96 ± 1.3 4.17 ± 1.2a 4.08 ± 1.1a 0.009 SVI (ml/m2) 20.2 ± 3.8 22.3 ± 8.2 22.0 ± 9.3 24.9 ± 12.4 25.8 ± 9.1 27.3 ± 9.6 29.4 ± 9.2 30.0 ± 7.4a 0.037 GEDVI (ml/m2) 311 ± 112 307 ± 104 338 ± 180 329 ± 161 359 ± 152 346 ± 141 384 ± 146 350 ± 118 0.09 ELWI (ml/kg) 24.1 ± 9.0 21.6 ± 10.2 21.1 ± 7.1 22.8 ± 9.6 21.6 ± 8.5 20.8 ± 8.3 24.3 ± 10.4 22.8 ± 10.5 0.62 ScvO2(%) 73.3 ± 8.6 69.2 ± 3.5 68.7 ± 3.5 67.3 ± 5.2 70.7 ± 6.0 74.8 ± 5.5 70.4 ± 6.8 76.1 ± 4.8 0.23 PvaCO2(mmHg) 10.1 ± 4.6 11.3 ± 3.3 11.3 ± 1.6 11.1 ± 2.5 10.0 ± 1.7 9.3 ± 2.3 9.5 ± 2.7 6.8 ± 2.5a a 0.047 pH 7.35 ± 0.09 7.38 ± 0.06 7.34 ± 0.06 7.37 ± 0.08 7.37 ± 0.05 7.38 ± 0.03 7.39 ± 0.04 7.39 ± 0.03 0.37 BE (mmol/l) −4.0 ± 3.2 −3.5 ± 2.8 −4.6 ± 2.8 −3.3 ± 3.1 −3.2 ± 2.4 −2.8 ± 2.7 −0.6 ± 3.2a −0.5 ± 2.0a 0.012
Hgb (g/l) 98 ± 16 123 ± 18a 120 ± 9 114 ± 14 121 ± 11 119 ± 10 118 ± 15 117 ± 6 0.037
CavO2(ml/100ml) 42 ± 17 50 ± 10 45 ± 12 44 ± 13 47 ± 17 40 ± 11 40 ± 7 34 ± 9 0.13
DO2i (ml/min/m2) 400 ± 41 488 ± 170 496 ± 137 477 ± 117 551 ± 166 606 ± 211a 654 ± 198a 628 ± 191a 0.004 VO2i (ml/min/m2) 95 ± 25 144 ± 35 141 ± 21 142 ± 46 156 ± 79 133 ± 60 172 ± 51 136 ± 65 0.73
OER (%) 25% ± 8% 30% ± 4% 30% ± 3% 29% ± 5% 28% ± 7% 22% ± 5% 28% ± 8% 21% ± 5% 0.25
Inotropic index 23.3 ± 15 20.1 ± 12 18.9 ± 10 18.7 ± 9 20.5 ± 9 19.4 ± 8 18.2 ± 7 17.6 ± 7 0.93 Data are expressed as the mean ± SD. Repeated measures ANOVA withpost hocBonferroni correction was applied to compare the consecutive data.
aSignificant differences compared with the baseline (T1) measurement.
MAP: mean arterial pressure; HR: heart rate; CVP: central venous pressure; CI: cardiac index; SVI: stroke volume index; GEDVI: global end-diastolic volume index; ELWI: extravascular lung water index; ScvO2: central venous saturation; PvaCO2: venoarterial PCO2difference; BE: base excess; Hgb: haemoglobin level;
CavO2: arterio-venous oxygen content difference; DO2i: oxygen delivery indexed for body surface area; VO2i: oxygen consumption indexed for body surface area; OER: oxygen extraction.
However, ScvO2 and PvaCO2 were found to correlate signifi- cantly and to change in parallel (Fig.2). Both parameters showed strong correlations with OER (Table4).
In the investigated group, the haemoglobin values proved to have a remarkable impact on the ScvO2(r= 0.74,P= 0.004) and OER (r= 0.69,P= 0.008). The core temperature was not related to the ScvO2, PvaCO2, VO2i or OER.
Concerning the relationship between arterial and venous oxygenation, neither the SaO2 (r= 0.32, P= 0.29) nor the PaO2
(r= 0.17, P= 0.11) showed any significant association with the ScvO2.
The measured extravascular lung water index (ELWI) values were considerably higher compared with the normal adult range.
The change in ELWI did not correlate with the functional para- meters of the lung: the alveolar-arterial oxygen difference (r= 0.03,P= 0.71) or PaO2/FiO2(r=−0.04,P= 0.65).
DISCUSSION
Proper balance of oxygen supply and demand is determined by respiratory, haemodynamic and local metabolic variables. An additional important factor is the oxygen-carrying capacity of the blood, which is influenced mostly by the haemoglobin concentra- tion [11]. In our study, various global haemodynamic parameters Figure 1:(AandB) Relationship between the percentage change in oxygen delivery index (ΔDO2i) and consumption index (ΔVO2i), oxygen extraction (ΔOER).
Table 3: Relationship between haemodynamic parameters and variables reflecting oxygen balance
ScvO2 PvaCO2 BE CavO2 OER
r P-value r P-value r P-value r P-value r P-value
MAP 0.48 0.10 0.23 0.45 0.33 0.27 0.54 0.06 0.36 0.23
HR 0.48 0.09 0.03 0.92 0.14 0.64 0.43 0.14 0.43 0.15
CVP 0.31 0.31 0.30 0.33 0.11 0.72 0.35 0.24 0.33 0.28
CI 0.24 0.43 0.18 0.55 0.52 0.07 0.18 0.55 0.22 0.48
GEDVI 0.06 0.85 0.07 0.81 0.48 0.10 0.01 0.97 0.01 0.97
SVRI 0.52 0.07 0.36 0.23 0.44 0.14 0.50 0.08 0.51 0.08
Data are expressed as regression coefficients (r) andP-values.
MAP: mean arterial pressure; HR: heart rate; CVP: central venous pressure; CI: cardiac index; GEDVI: global end-diastolic volume index; SVRI: systemic vascular resistance index; ScvO2: central venous saturation; PvaCO2: venoarterial PCO2difference; BE: base excess; CavO2: arterio-venous oxygen content difference;
OER: oxygen extraction.
Figure 2:Relationship between ScvO2and PvaCO2.
ORIGINALARTICLE
were tested to follow the oxygen balance in neonates and infants following open-heart surgery. PiCCO provides complex haemo- dynamic assessment, including volumetric cardiac performance, preload and afterload monitoring. The reliability of CO measured by TPTD in a paediatric population has been successfully validated with the direct Fick method [12], pulmonary artery catheter [13]
and indicator dilution [14]. However, tissue perfusion and oxygen balance can be sufficient despite low CO, and vice versa.
Echocardiography is an essential non-invasive tool in peri- operative haemodynamic monitoring, but it cannot be applied for continuous measurements. In paediatric cardiac intensive care practice, echocardiography provides a lot of information about malformations, valve function and global cardiac performance, but it is less informative and specific regarding the changes in global tissue perfusion.
In paediatric clinical practice, there is often a lack of strict and valuable target values for haemodynamic and oxygenation vari- ables. The VO2i is considered an important index of adequate cardiac performance that can be directly measured by respiratory mass spectrometry or calculated from the CO and CavO2 [15].
Both methods require considerable technical background. Thus, in practice the VO2is usually estimated according to the LaFarge equation [16]. Recent paediatric data have shown that the estima- tion of oxygen consumption generates significant errors, particu- larly in children <3 years of age with congenital heart disease [17].
In the investigated group of neonates and infants, during the early postoperative period, oxygen consumption was found to depend on oxygen delivery, which indicated partial oxygen supply insufficiency. Accordingly, OER changed in parallel with the VO2i, but the DO2i showed no correlation with OER. At the same time, the overall VO2i was not seriously depressed in our study. Both the ScvO2and PvaCO2proved to be reliable clinical variables to follow OER. However, in these haemodynamically compromised children, neither CI nor conventional pressure- based circulatory variables were directly associated with the ScvO2and OER. It can be hypothesized that there is a non-linear relationship between the CI and ScvO2, and during the periopera- tive period, many confounding factors are present. Most of the children enrolled to our study were preoperatively cyanotic or had significant left-to-right shunt fraction and required anticon- gestive therapy due to heart failure. Presumably, their preopera- tive oxygen delivery was significantly impaired and they were preconditioned for hypoxia. It should always be remembered that children, particularly neonates and infants, have enhanced toler- ance towards hypoxic states and are able to considerably increase oxygen extraction. When evaluating the ScvO2 as a recognized variable of global oxygen balance in this patient population, these factors need to be considered.
In our results, the PvaCO2proved to be an easy-to-measure and comparable parameter with the ScvO2in assessing tissue perfu- sion [18]. PvaCO2 of >6 mmHg has been proposed in previous studies as an independent risk factor for impaired systemic blood flow [19]. Furthermore, during anaerobic metabolism, it is assumed that the VO2decreases more than the CO2production (VCO2) [20,21]. In the case of hypoxic conditions, the PvaCO2is most likely more sensitive to changes in perfusion than the ScvO2 [22]. Therefore, in children with cyanotic heart defects in whom the impact of the SaO2on the ScvO2should be more pronounced, measuring the PvaCO2 can add to the adequate monitoring of tissue perfusion [23,24].
A further possible advantage of the PvaCO2is that the ScvO2is likely to be more dependent on the actual haemoglobin level. The PvaCO2is likely influenced more independently by perfusion, al- though this hypothesis needs further investigation.
We tested whether the ELWI values reflect respiratory function- al and ventilation parameters, but no significant correlations were found. The relatively high measured ELWI values are most likely age-related characteristics.
STUDY LIMITATIONS
Our results are limited by the relatively small number of enrolled patients, but the study group was reasonably homogeneous. The intensive care physicians were not blinded to the results of the TPTD measurements or the ScvO2data. Obviously, this knowledge might have influenced therapy compared with routine treatment.
The validity of the ScvO2in assessing the mixed venous oxygen saturation is a matter of debate, but with some limitations the ScvO2 has been found to be a reliable surrogate marker [25]. In small children, the proportion of the upper body is relatively higher, and thus blood samples from the superior vena cava cor- relate more closely with the mixed venous blood. To obtain valid measurements, central venous catheters were inserted through the right internal jugular vein, ending close to the cavoatrial junc- tion. Blood samples were consistently taken from the distal line of the catheters.
Measuring serum lactate levels could have added more infor- mation to ourfindings, but it was not technically feasible during our study.
CONCLUSIONS
In conclusion, we have found that both the ScvO2and PvaCO2are reliable and comparable parameters in following tissue oxygen Table 4: Relationship between ScvO2, PvaCO2and other parameters influencing or related to tissue oxygenation
DO2i VO2i OER pH BE T
r P-value r P-value r P-value R P-value r P-value r P-value
ScvO2 0.55 0.05 0.38 0.19 0.96 <0.001 0.04 0.88 0.22 0.47 0.10 0.76
PvaCO2 0.40 0.18 0.33 0.27 0.81 0.001 0.41 0.15 0.52 0.07 0.16 0.58
Data are expressed as regression coefficients (r) andP-values. DO2i: oxygen delivery indexed for body surface area; VO2i: oxygen consumption indexed for body surface area; OER: oxygen extraction; BE: base excess; T: core temperature.
surgery in neonates and infants. However, the correlations between conventional or volumetric haemodynamic parameters and tissue oxygenation were poor. According to our results, oxygen consumption in these paediatric patients is characterized by substrate dependency but maintained on a reasonable level. As part of multiparameter monitoring, our data highlight the import- ance of regular ScvO2measurements and PvaCO2calculations in paediatric intensive care. The advantage of the PvaCO2over the ScvO2 in hypoxic patients, particularly in children with cyanosis, requires further investigation.
Conflict of interest: none declared.
REFERENCES
[1] Cain SM. Oxygen delivery and uptake in dogs during anemic and hypoxic hypoxia. J Appl Physiol 1977;42:228–34.
[2] Schumacker PT, Cain SM. The concept of a critical oxygen delivery.
Intensive Care Med 1987;13:223–9.
[3] Shoemaker WC, Appel PL, Kram HB, Waxman K, Lee TS. Prospective trial of supranormal values of survivors as therapeutic goals in high-risk surgical patients. Chest 1988;94:1176–86.
[4] Hayes MA, Timmins AC, Yau EH, Palazzo M, Hinds CJ, Watson D. Elevation of systemic oxygen delivery in the treatment of critically ill patients. N Engl J Med 1994;330:1717–22.
[5] Rampal T, Jhanji S, Pearse RM. Using oxygen delivery targets to optimize resuscitation in critically ill patients. Curr Opin Crit Care 2010;16:244–9.
[6] Vincent JL, De Backer D. Oxygen transport-the oxygen delivery contro- versy. Intensive Care Med 2004;30:1990–6.
[7] Kissack CM, Weindling AM. Peripheral bloodflow and oxygen extraction in the sick, newborn very low birth weight infant shortly after birth.
Pediatr Res 2009;65:462–7.
[8] Dellinger RP, Levy MM, Rhodes A, Annane D, Gerlach H, Opal SMet al. Surviving Sepsis Campaign Guidelines Committee including the Pediatric Subgroup. Surviving sepsis campaign: international guidelines for man- agement of severe sepsis and septic shock: 2012. Crit Care Med 2013;41:
580–637.
[9] Brierley J, Carcillo JA, Choong K, Cornell T, Decaen A, Deymann Aet al.
Clinical practice parameters for hemodynamic support of pediatric and neonatal septic shock: 2007 update from the American College of Critical Care Medicine. Crit Care Med 2009;37:666–88.
Postoperative course and hemodynamic profile after the arterial switch operation in neonates. A comparison of low-flow cardiopulmonary bypass and circulatory arrest. Circulation 1995;92:2226–35.
[11] Caille V, Squara P. Oxygen uptake-to-delivery relationship: a way to assess adequateflow. Crit Care 2006;10(Suppl 3):S4.
[12] Pauli C, Fakler U, Genz T, Hennig M, Lorenz HP, Hess J. Cardiac output de- termination in children: equivalence of the transpulmonary thermodilu- tion method to the direct Fick principle. Intensive Care Med 2002;28:
947–52.
[13] McLuckie A, Murdoch IA, Marsh MJ, Anderson D. A comparison of pul- monary and femoral artery thermodilution cardiac indices in paediatric intensive care patients. Acta Paediatr 1996;85:336–8.
[14] Linton RA, Jonas MM, Tibby SM, Murdoch IA, O’Brien TK, Linton NWet al. Cardiac output measured by lithium dilution and transpulmonary ther- modilution in patients in a paediatric intensive care unit. Intensive Care Med 2000;26:1507–11.
[15] Li J, Schulze-Neick I, Lincoln C, Shore D, Scallan M, Bush Aet al. Oxygen consumption after cardiopulmonary bypass surgery in children: determi- nants and implications. J Thorac Cardiovasc Surg 2000;119:525–33.
[16] LaFarge CG, Miettinen OS. The estimation of oxygen consumption.
Cardiovasc Res 1970;4:23–30.
[17] Rutledge J, Bush A, Shekerdemian L, Schulze-Neick I, Penny D, Cai Set al.
Validity of the LaFarge equation for estimation of oxygen consumption in ventilated children with congenital heart disease younger than 3 years—a revisit. Am Heart J 2010;160:109–14.
[18] Cuschieri J, Rivers EP, Donnino MW, Katilius M, Jacobsen G, Nguyen HB et al. Central venous-arterial carbon dioxide difference as an indicator of cardiac index. Intensive Care Med 2005;31:818–22.
[19] Vallée F, Vallet B, Mathe O, Parraguette J, Mari A, Silva Set al. Central venous-to-arterial carbon dioxide difference: an additional target for goal-directed therapy in septic shock? Intensive Care Med 2008;34:
2218–25.
[20] Cohen IL, Sheikh FM, Perkins RJ, Feustel PJ, Foster ED. Effect of hemor- rhagic shock and reperfusion on the respiratory quotient in swine. Crit Care Med 1995;23:545–52.
[21] Lamia B, Monnet X, Teboul JL. Meaning of arterio-venous PCO2difference in circulatory shock. Minerva Anestesiol 2006;72:597–604.
[22] Vallet B, Teboul JL, Cain S, Curtis S. Venoarterial CO(2) difference during regional ischemic or hypoxic hypoxia. J Appl Physiol 2000;89:1317–21.
[23] Martin J, Shekerdemian LS. The monitoring of venous saturations of oxygen in children with congenitally malformed hearts. Cardiol Young 2009;19:34–9.
[24] Ho KM, Harding R, Chamberlain J. The impact of arterial oxygen tension on venous oxygen saturation in circulatory failure. Shock 2008;29:3–6.
[25] Walley KR. Use of central venous oxygen saturation to guide therapy. Am J Respir Crit Care Med 2011;184:514–20.
ORIGINALARTICLE