Myocardial work index: a marker of left ventricular contractility in pressure- or volume overload-induced heart failure
Bálint Károly Lakatos*†, Mihály Ruppert†, Márton Tokodi, Attila Oláh, Szilveszter Braun, Christian Karime, Zsuzsanna Ladányi, Alex Ali Sayour, Bálint András Barta, Béla Merkely, Tamás Radovits†and Attila Kovács†
Heart and Vascular Center, Semmelweis University, Városmajor St.68, Budapest, H-1122, Hungary
Abstract
Aims While global longitudinal strain (GLS) is considered to be a sensitive marker of left ventricular (LV) function, it is sig- nificantly influenced by loading conditions. We hypothesized that global myocardial work index (GMWI), a novel marker of LV function, may show better correlation with load-independent markers of LV contractility in rat models of pressure-induced or volume overload-induced heart failure.
Methods and results Male Wistar rats underwent either transverse aortic constriction (TAC;n= 12) or aortocavalfistula cre- ation (ACF;n= 12), inducing LV pressure or volume overload, respectively. Sham procedures were performed to establish con- trol groups (n= 12/12). Echocardiographic loops were obtained to determine GLS and GMWI. Pressure-volume analysis with transient occlusion of the inferior caval vein was carried out to calculate preload recruitable stroke work (PRSW), a load-independent‘gold-standard’parameter of LV contractility. Myocardial samples were collected to assess interstitial and perivascular fibrosis area and also myocardial atrial-type natriuretic peptide (ANP) and brain-type natriuretic peptide (BNP) relative mRNA expression. Compared with controls, GLS was substantially lower in the TAC group ( 7.0 ± 2.8 vs.
14.5 ± 2.5%;P<0.001) and was only mildly reduced in the ACF group ( 13.2 ± 2.4 vs. 15.4 ± 2.0%,P<0.05). In contrast with thesefindings, PRSW and GMWI were comparable with sham in TAC (110 ± 26 vs. 116 ± 68 mmHg; 1687 ± 275 mmHg%
vs. 1537 ± 662 mmHg%; bothP= NS), while it was found to be significantly reduced in ACF (58 ± 14 vs. 111 ± 40 mmHg;
1328 ± 411 vs. 1934 ± 308 mmHg%, bothP <0.01). In the pooled population, GMWI (r= 0.70;P <0.001) but not GLS (r= 0.23;P = 0.12) showed a strong correlation with PRSW. GLS correlated with interstitial (r = 0.61; P < 0.001) and perivascularfibrosis area (r= 0.54;P<0.001), and also with myocardial ANP (r= 0.85;P<0.001) and BNP relative mRNA expression (r= 0.75;P<0.001), while GMWI demonstrated no or only marginal correlation with these parameters.
Conclusions Being significantly influenced by loading conditions, GLS may not be a reliable marker of LV contractility in heart failure induced by pressure or volume overload. GMWI better reflects contractility in haemodynamic overload states, making it a more robust marker of systolic function, while GLS should be considered as an integrative marker, incorporating systolic function, haemodynamic loading state, and adverse tissue remodelling of the LV.
Keywords Heart failure; Volume overload; Pressure overload; Echocardiography; Myocardial work
Received:6 January 2021; Revised: 15 February 2021; Accepted: 2 March 2021
*Correspondence to: Bálint Károly Lakatos, Semmelweis University, Heart and Vascular Center, Városmajor St.68, H-1122 Budapest, Hungary. Tel: +36206663540;
Fax: +3614586842. Email: lakatos.balint@med.semmelweis-univ.hu
†Thefirst two and the last two authors contributed equally to this work.
Introduction
Despite constantly improving diagnostic modalities, adequate characterization of left ventricular (LV) function still remains a
challenging issue in the clinical practice. Undoubtedly, ejec- tion fraction (EF) is still the mainstay parameter of LV systolic function with well-established diagnostic and prognostic value. Nevertheless, evidence suggests that preserved EF
© 2021 The Authors. ESC Heart Failure published by John Wiley & Sons Ltd on behalf of European Society of Cardiology.
ESC Heart Failure2021;8: 2220–2231
Published online 23 March 2021 in Wiley Online Library (wileyonlinelibrary.com)DOI:10.1002/ehf2.13314
does not always indicate maintained LV contractility, and con- versely, markedly reduced EF may be associated with unal- tered contractile state.1
Novel measures of LV function, such as speckle-tracking echocardiography (STE)-derived deformation parameters, have emerged as sensitive markers of myocardial dysfunction.2,3 Measurement of myocardial deformation, particularly global longitudinal strain (GLS), effectively de- tects subclinical stages of LV dysfunction in a wide variety of cardiovascular diseases.2 Therefore, assessment of LV GLS was also emphasized in the current clinical guidelines.4
According to previous studies, strain and strain rate values show a relationship with load-independent indices of LV con- tractility in various experimental settings, such as rat models of athlete’s heart or diabetic cardiomyopathy.5,6 However, several studies have demonstrated that STE-derived strain parameters are significantly influenced by loading conditions.7,8In a recent study by our research group using rat models of pressure (PO)-induced and volume overload (VO)-induced heart failure (HF), GLS did not show a relation- ship with LV contractility, rather reflecting ventriculo-arterial coupling (VAC).9These observations substantially affect the interpretation of deformation parameters in haemodynamic overload states of the LV. Considering that the loading conditions dynamically change in the vast majority of cardiac disorders (e.g. progression of valvular diseases and changes in blood pressure), strain values may not be perceived as re- liable markers of LV contractility in a large subset of patients.
The non-invasive assessment of myocardial work was proposed as a promising new tool to overcome the afore- mentioned limitations of STE-based mere strain by adjusting ventricular deformation to afterload.10 Global myocardial work index (GMWI), measured as the area enclosed by the pressure-strain loop, showed close correlation with positron emission tomography-derived myocardial glucose metabolism.10However, data are lacking regarding its associ- ation with the gold-standard markers of LV contractility.
Accordingly, we hypothesized that compared with GLS, GMWI shows better correlation with load-independent markers of LV contractility assessed by pressure-volume anal- ysis in rat models of PO-induced and VO-induced HF.
Methods
Animals
The investigation conformed to the EU Directive 2010/63/EU and the Guide for the Care and Use of Laboratory Animals used by the US National Institutes of Health (NIH Publication No. 85–23, revised 1996). The experiments were approved by the Ethical Committee of Hungary for Animal Experimenta- tion. The study is interpreted in accordance with the ARRIVE
(Animals in Research: Reporting in Vivo Experiments) guidelines.11 The animals were kept under standard condi- tions (22 ± 2°C with 12 h light/dark cycles) and were allowed access to laboratory rat diet and water ad libitum during the entire experimental period.
Experimental groups
The following four groups were studied in the current investigation:
Transverse aortic constriction (TAC) group (n = 12): rats underwent TAC surgery, with a median follow-up period of 15 weeks;
Shamtgroup (n= 12): rats underwent sham surgery (same procedure as TAC surgery without constriction of the aorta), with a median follow-up period of 15 weeks;
Aortocavalfistula (ACF) group (n= 12): rats underwent ACF surgery, with a median follow-up period of 24 weeks;
Shamagroup (n= 12): rats underwent sham surgery (same procedure as ACF operation without creation of the aortocaval fistula), with a median follow-up period of 24 weeks.
Surgical models of pressure and volume overload-induced heart failure
Transverse aortic constriction operation was performed to establish PO-induced HF, as described previously.9 In brief, male Wistar rats (2–3 weeks old, 50–75 g) were anaesthetised by isoflurane. Subsequently, a left anterolat- eral thoracotomy was performed, and the aortic arch be- tween the brachiocephalic trunk and the left common carotid artery was prepared. This segment of the aorta was subsequently constricted to the size of a 21-gauge needle (outer diameter of 0.8 mm). Age-matched sham-operated an- imals underwent the same surgical procedure but without the completion of the aortic constriction (Shamt). In line with previous literature data, a median follow-up period of 15 weeks was utilized after TAC/Shamtsurgery to achieve characteristic features of PO-induced HF.
Aortocaval fistula operation was carried out to establish VO-induced HF according to the previously published protocol.9Briefly, under isoflurane anaesthesia male Wistar rats (5–6 weeks old, 175–200 g) underwent midline laparot- omy. The abdominal aorta and the inferior vena cava were subsequently isolated from the surrounding connective tissue and temporarily clipped between the left renal artery and the aortic bifurcation. After exclusion, the anterior surface of the aorta was punctured with an 18-gauge needle (outer diame- ter of 1.3 mm), which was thereafter advanced through the adjacent venous wall, successfully creating an ACF. The punc- ture of the anterior aortic surface was sealed by applying a
drop of a cyanoacrylate glue (Loctite, Dusseldorf, Germany).
Sham-operated animals were subjected to the same surgical procedure but with no ACF creation (Shama). Based on previ- ous publications, a mean follow-up period of 24 weeks was applied after ACF/Shamato evoke characteristic features of VO-induced HF.
Conventional and speckle-tracking echocardiography
Echocardiographic acquisitions were performed with an echocardiographic imaging unit (Vivid i, GE Healthcare) equipped with a 13 MHz linear transducer (GE 12L-RS, GE Healthcare, Waukesha, WI, USA) according to our previously described internal protocol with minor modifications.12 Briefly, following anaesthesia using 5% isoflurane, the rats were placed on an automatic heating pad in a supine position in order to maintain a body temperature of 37°C measured via rectal temperature probe. The thorax of the animals was shaved to improve the acoustic window. Time-gated loops in two-dimensional parasternal long-axis and short-axis views as well as M-mode acquisitions at the mid-papillary level were recorded by a single operator blinded to the experimen- tal groups. By using an insonation depth of 2.5 cm, a constant frame rate of 218 frame/s was achieved. Digital images were analysed by a single operator in a blinded fashion using an image analysis software (EchoPac, GE Healthcare). All values were calculated as an average of three consecutive cardiac cycles. LV end-diastolic diameter (LVEDD), LV end-systolic di- ameter (LVESD), anterior wall thicknesses (AWT), and poste- rior wall thicknesses (PWT) in diastole (d) were measured on M-mode recordings. Using these aforementioned parame- ters, fractional shortening (FS as [LVEDD-LVESD]/LVEDD), LV mass, and relative wall thickness (RWT as [AWTd + PWTd]/
LVEDD) were quantified. LV end-diastolic volume (LVEDV), LV end-systolic volume (LVESV) and ejection fraction (EF) were also calculated according to the biplane ellipsoid model.
Speckle tracking echocardiography analysis was performed in accordance with our internal protocol as described in detail previously.5Briefly, 2D loops optimized for STE were obtained from the parasternal long-axis view. Using dedicated software (EchoPac v113, GE Healthcare), a blinded operator analysed three different parasternal long-axis acquisitions, with three cardiac cycles used from each acquisition. After manual contouring of the endocardial border, the software automat- ically separated the myocardial region of interest into six seg- ments and tracked their longitudinal deformation frame-by- frame, determining GLS. In case of low trackingfidelity, the contour was further corrected manually, and the analysis was repeated. The acceptance of a segment for inclusion in further analysis was guided by the recommendation of the software. Ideally, for each parameter (3 × 3 × 6), 54
segmental values were available. Animals with <36 values were not included in statistical analysis (none).
Pressure-volume analysis
Left ventricular pressure-volume (P-V) analysis was per- formed according to the previously described protocol, with slight modifications.13In brief, immediately after the comple- tion of the echocardiographic acquisitions, the rats were tracheotomized, intubated, and artificially ventilated with 1–1.5% isoflurane gas in 100% O2. Rocuronium bromide in the dose of 2 mg/kg was administered intraperitoneally to in- duce muscle relaxation. A polyethylene catheter was inserted into the left external jugular vein forfluid administration. A 2F microtip pressure-conductance catheter (SPR-838, Millar Instruments, Houston, Texas, USA) was inserted into the right carotid artery and subsequently advanced into the ascending aorta. Following stabilization, arterial blood pressure was recorded. The catheter was then guided into the LV under pressure control. With the use of a dedicated P-V analysis program (PVAN, Millar Instruments, Houston, TX, USA), the following were calculated/determined: LV end-systolic pres- sure (LVESP), LV end-diastolic pressure (LVEDP), LVEDV, LVESV, EF, stroke volume (SV), and cardiac output (CO).
Stroke work (SW) was estimated as the area of the resting pressure-volume loop. In order to calculate load-independent contractility parameters, P-V loops were registered at transiently decreasing preload. This was achieved by transient occlusion of the inferior caval vein. Pre- load recruitable stroke work (PRSW) was calculated as a load-independent reliable index of LV contractility. Further- more, to characterize myocardial compliance, the slope of the end-diastolic P-V relationship (EDPVR) was derived from P-V analysis. Parallel conductance and volume calibration of the conductance system were performed as previously described.14
Interstitial and perivascular fi brosis
Transverse transmural 5-μm thick slices of the ventricles were cut and placed on adhesive slides. The extent of myocardial fibrosis was assessed on picrosirius-stained sec- tions, as also described earlier.15ImageJ software (National Institutes of Health) was used to identify the picrosirius-red positive area. Six images (magnification 50×) were randomly taken from the free LV wall on each section. After back- ground subtraction, eye-controlled auto-threshold was deter- mined to detect positive areas. The collagen area (picrosirius red positive area-to-total area ratio) was determined on each image, and the mean value of six images was used to repre- sent each animal. The perivascular fibrosis was assessed by the percentage of perivascular collagen area to total vascular
area.15The extent of perivascularfibrosis was also assessed by using ImageJ software. The evaluation of the histological sections was performed by an independent observer who was blinded to the experimental design.
Myocardial gene expression
Deep-frozen samples of LV myocardium (n= 7–8 per group) were homogenized (Precellys Evolution tissue homogenizer, Bertin Instruments, Montigny-le-Bretonneux, France) in a ly- sis buffer (RLT buffer; Qiagen, Hilden, Germany). During tis- sue homogenization, the temperature of the samples was maintained at 0°C by using the Cryolis Evolution cooling sys- tem (Bertin Instruments). RNA was isolated using the RNeasy Fibrous Tissue Mini Kit (Qiagen), according to the manufac- turer’s instructions. The quality and concentration of isolated RNA were assessed by the NanoDrop 2000 Spectrophotometer (Thermo ScientificTM, Waltham, MA, USA). Accordingly, optical density at 230, 260, and 280 nm was measured. The ratios of 230/260 and 230/280 nm were defined for quality control. Reverse transcription reaction (1 μg total RNA of each sample) was completed using the QuantiTect Reverse Transcription Kit (Qiagen). Quantitative real-time PCR was performed with the StepOnePlus Real-Time PCR System (Applied Biosystems, Foster City, CA, USA) in triplicates of each sample in a volume of 10 μL in each well containing cDNA (1 μL), TaqMan Universal PCR MasterMix (5 μL), and a TaqMan Gene Expression Assay (0.5 μL) (Applied Biosystems) for the following pathological hypertrophy marker genes: atrial natriuretic peptide (ANP;
assay ID: Rn00664637_g1) and brain-type natriuretic peptide (BNP; assay ID: Rn00580641_m1). Gene expression data were normalized to glyceraldehyde 3-phosphate dehydrogenase (GAPDH; assay ID: Rn01775763_g1), and expression levels were calculated using the CT comparative method (2-ΔCT).
All results are expressed as values normalized to a positive calibrator (a pool of cDNA from all samples of the Shamt
group [2-ΔΔCT).
Assessment of myocardial work
To assess myocardial work, longitudinal strain and invasive LV pressure recordings were exported and analysed using our
custom-made software (implemented in C#). First, the open- ing and closure timepoints of the mitral and aortic valves were identified on the analysed echocardiographic loops by visual assessment. These timestamps were defined automat- ically on the LV pressure curves during the P-V analysis. Next, using these temporal reference points, both curves were dis- sected into four sections (isovolumetric contraction, ejection, isovolumetric relaxation, and diastolicfilling), with each sec- tion of the strain curve being matched with the correspond- ing section of the pressure tracing. Due to the different temporal resolution of the datasets (strain tracing: 218/s, LV pressure: 1000/s), the timestamps of the pressure and strain tracings were normalized in each section. The strain values were then interpolated for the timestamps based on the LV pressure recording. The four sections of the recordings were subsequently concatenated, and pressure-strain loops were plotted. The instantaneous power was calculated by multiplying the strain rate (obtained by differentiating the strain curve) and the instantaneous LV pressure. Finally, GMWI was computed by integrating the power from mitral valve closure until mitral valve opening.10
Statistical analysis
All values are expressed as mean ± standard error of the mean. The distribution of the datasets was tested by the Sha- piro–Wilk normality test. An unpaired two-sided Student’s t-test, in case of normal distribution, or a Mann–WhitneyU test, in case of non-normal distribution, was used to compare means of two independent groups (TAC vs. Shamtand ACF vs.
Shama) and the HF models (TAC vs. ACF).
Based on the normal or non-normal distribution of datasets, Pearson or Spearman test was used for correla- tional analysis.
APvalue of<0.05 was used as criterion for statistical sig- nificance. Furthermore, two additional categories (P<0.01 and P<0.001) were introduced to indicate the strength of the observed statistical difference.
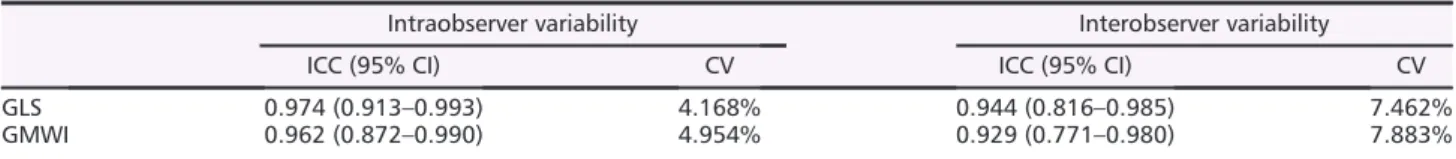
Intraobserver and interobserver variability of the most rel- evant deformation parameters was also assessed using coef- ficient of variation and Lin’s concordance correlation coefficient (Table1).
Table 1 Intra- and interobserver variability of the key LV deformation parameters
Intraobserver variability Interobserver variability
ICC (95% CI) CV ICC (95% CI) CV
GLS 0.974 (0.913–0.993) 4.168% 0.944 (0.816–0.985) 7.462%
GMWI 0.962 (0.872–0.990) 4.954% 0.929 (0.771–0.980) 7.883%
ICC, intraclass correlation coefficient; CV, coefficient of variation; CI, confidence interval; GLS, global longitudinal strain; GMWI, global myocardial work index
Results
The TAC and ACF groups showed the characteristic features of PO-induced and VO-induced HF (Table2). As a marker of severe PO, LVESP was found to be markedly elevated in TAC, while mildly lowered in ACF compared with their corre- sponding Sham group. LVEDP was significantly increased in both HF models. LVESV was found to be increased in both TAC and ACF; however, ACF chamber enlargement was more pronounced. PV analysis-derived LVEF was found to be lower in both TAC and ACF; however, the extent of reduction was markedly higher in TAC. SW was comparable between the study groups, while CO was significantly lower in both HF models compared with their corresponding Sham group.
EDPVR showed marked increase in the TAC group compared with its corresponding control group. In contrast, EDPVR did not differ in the ACF group from its Sham group (Table2).
Echocardiographic measurements showed significantly in- creased LVEDD and LVESD in both HF groups, with an evi- dently higher increment of LV dimensions in the ACF group.
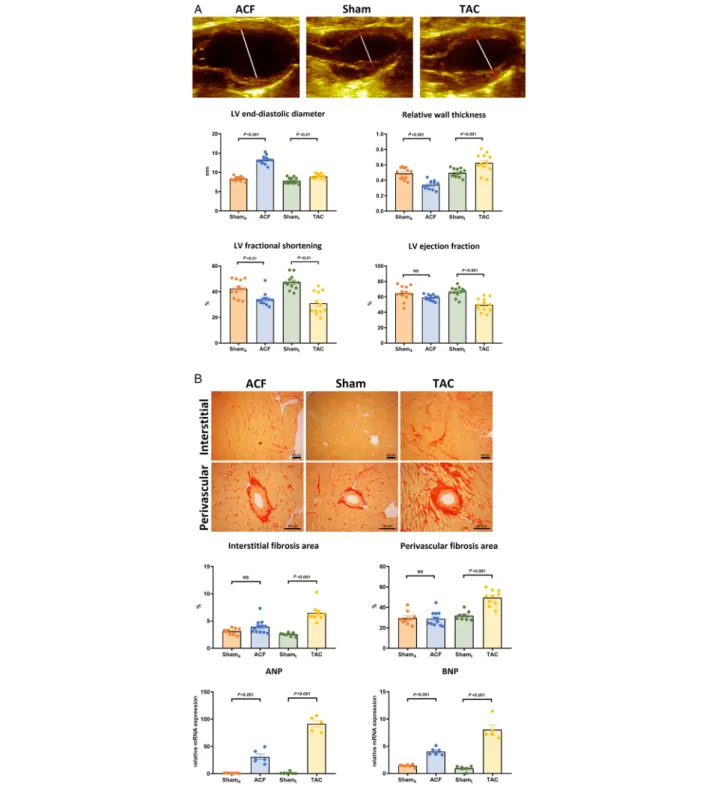
RWT was markedly increased in TAC (concentric hypertrophy) and decreased in ACF (eccentric hypertrophy) compared with their corresponding Sham group. LVM and LVMi were ele- vated in both TAC and ACF to a comparable extent. Func- tional parameters, such as LVEF and FS, demonstrated markedly lower systolic function in TAC. FS was significantly lower in ACF, while EF showed only a tendency toward lower values when compared with Shama(Figure1A,Table3).
Both interstitial and perivascularfibrosis were markedly in- creased in TAC, while remaining unaltered in ACF compared with their corresponding Sham group. On the other hand, both HF groups demonstrated significantly higher ANP and BNP expression. Nevertheless, the relative increase in the na- triuretic gene expression was more pronounced in TAC (P<0.001;Figure1B).
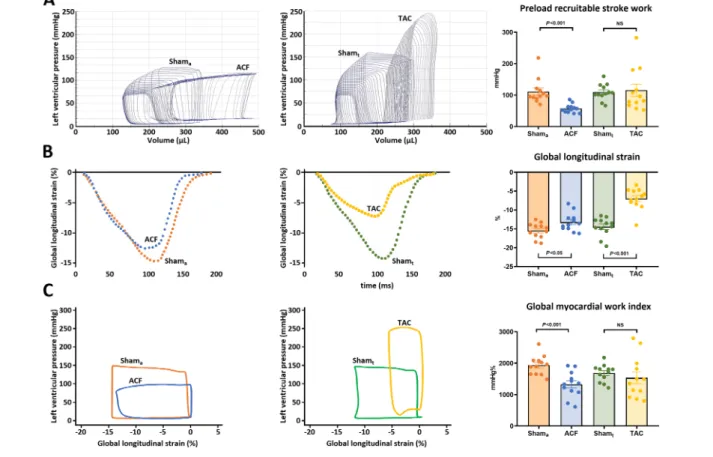
While conventional echocardiographic parameters showed no sign of overt functional deterioration, PRSW was markedly lower in ACF compared to Shama. Moreover, in contrast with the markedly decreased EF and FS, LV contractility appeared to be preserved in TAC (Figure2).
Global longitudinal strain was lower in both haemody- namic overload groups compared with their corresponding sham. Nevertheless, the extent of decrease was more evident in TAC (Figure2). In contrast with thesefindings, GMWI was found to be markedly lower in ACF compared with Shama, while TAC showed GMWI values that were comparable with Shamt(Figure2).
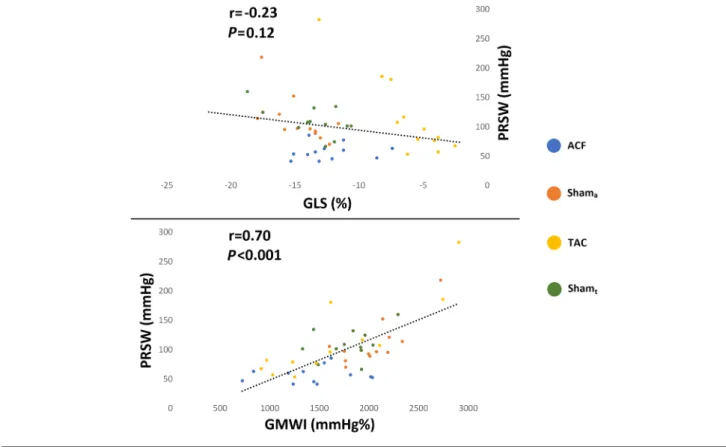
In the pooled study population, EF failed to demonstrate a relationship with PRSW (r= 0.07,P= 0.67). GLS also did not correlate with PRSW (r= 0.23,P= 0.12). On the other hand, GMWI showed a strong positive correlation with PRSW (r= 0.70,P < 0.001;Figure 3). This finding was consistent when only the TAC-Shamt(r = 0.77; P < 0.001) and ACF-
Shama(r= 0.71;P<0.001) groups were examined. Whereas Table
2Basichaemodynamicdataofthestudygroups PO-inducedHFVO-inducedHFPOvs.VO Shamt(n=12)TAC(n=12)Pvalue (Shamtvs.TAC)Shama(n=12)ACF(n=12)Pvalue (Shamavs.ACF)Pvalue HR,b.p.m.331±29301±220.01310±22309±220.980.40 LVESP,mmHg118.2±14.0233.1±31.7<0.001120.6±14.3106.9±17.40.06<0.001 LVEDP,mmHg8.7±2.522.7±7.6<0.00110.5±3.017.5±5.3<0.0010.07 LVEDV,μL283.5±47.4314.7±78.30.25280.1±35.4475.2±93.5<0.001<0.001 LVESV,μL124.7±26.9218.4±72.7<0.001119.4±36.0262.5±70.9<0.0010.15 SV,μL158.8±27.396.4±31.4<0.001160.7±33.0212.7±59.50.02<0.001 EF,%56.4±5.131.6±10.1<0.00157.7±10.544.8±9.6<0.01<0.01 CO,mL/min52558±1003228824±9214<0.00149982±1120166225±198840.03<0.001 SW,mmHg*mL15040±334715325±61830.8915659±369216492±55360.680.64 EDPVR,mmHg/μL0.024±0.0030.094±0.015<0.0010.027±0.0030.030±0.0030.49<0.001 CO,cardiacoutput;EDPVR:end-diastolicpressure-volumerelationship;HR,heartrate;LVEDP,leftventricularend-diastolicpressure;LVEDV,leftventricularend-diastolicvolume;LVEF, ejectionfraction;LVESP,leftventricularend-systolicpressure;LVESV,leftventricularend-systolicvolume;SV,strokevolume;SW,strokework.
Figure 1 (A) Morphological features of the study groups measured by echocardiography. Upper panel: Representative 2D echocardiographic images of the two heart failure models and a Sham-operated animal (red lines: myocardial wall thickness, white lines: end-diastolic diameter). While the left ventricular (LV) end-diastolic diameter was markedly enlarged in aortocavalfistula (ACF,n= 12) group, it was only mildly increased in transverse aortic constriction (TAC,n= 12) compared to their corresponding control (Shamaand Shamt,n= 12/12). The relative wall thickness was decreased in ACF, while it was increased in TAC. LV fractional shortening was significantly lower in both HF groups. On the other hand, LV ejection fraction was main- tained in ACF, while it was significantly lower in TAC compared to their corresponding Sham. [Statistics: Student’s unpairedt-test]. (b) Markers of left ventricular (LV)fibrosis and wall stress. Upper panel: Representative histological samples of the two heart failure models and a Sham-operated animal.
The area of interstitial and perivascularfibrosis was unaltered in the aortocavalfistula (ACF,n= 6) model compared to its Sham operated control (Shama,n= 6), while it was significantly increased in transverse aortic constriction (TAC,n= 6) model compared with the corresponding Sham group (Shamt,n= 6). Nevertheless, both atrial (ANP) and brain-type natriuretic peptide (BNP) levels were significantly increased in both HF models.
[Statistics: Student’s unpairedt-test; Mann–WhitneyU-test].
GLS did not correlate with LV contractility, it showed a strong correlation with relative LV ANP (r= 0.85;P<0.001) and BNP (r= 0.75;P<0.001) expression as well as with LV interstitial (r = 0.61; P < 0.001) and perivascular fibrosis (r = 0.54;
P < 0.001) (Figure 4). GMWI demonstrated only marginal or no correlation with these markers (vs. ANP: r = 0.42, P<0.05; vs. BNP:r= 0.35,P= 0.09; vs. interstitialfibrosis:
r = 0.03, P = 0.88; vs. perivascular fibrosis: r = 0.09, P = 0.57). Furthermore, the extent of interstitial (r = 0.52, P<0.001) and perivascular (r= 0.57,P<0.001) myocardial fibrosis showed correlation with diastolic stiffness parameter EDPVR.
Intraobserver and interobserver variability measurements confirmed high reproducibility of the GLS and GMWI mea- surements (Table1).
Discussion
In our study, invasive haemodynamic and conventional echo- cardiographic measurements of the ACF and TAC groups con- firmed the characteristic features of VO-induced and PO-induced HF, respectively. In contrast with the conven- tional parameters of LV function, PV analysis-derived PRSW
—a load-independent gold-standard parameter of LV inotropy—showed markedly reduced myocardial contractility in ACF, whereas it was found to be preserved in TAC. While LV GLS did not reflect the actual inotropic state of the LV in our current experiments, GMWI demonstrated a strong linear correlation with PRSW. On the other hand, GLS showed nota- ble correlation with LV interstitial and perivascularfibrosis as well as myocardial natriuretic peptide expression in the pooled population.
Current HF guidelines strongly emphasize the importance of LVEF measurement: the distinction of HF with reduced (HFrEF) or with preserved EF (HFpEF) carries important con- sequences in patient management.16The assessment of LV systolic function by EF is still fundamental, as impaired LVEF is a more or less unambiguous marker of underlying cardiac disease. Nevertheless, it is widely known that EF is signifi- cantly affected by multiple factors, including preload, afterload, and chamber geometry. Therefore, EF should not be perceived as a marker of contractility per se but rather as an integrative index of systolic performance.1To date, sep- aration of the different determinants (e.g. inotropy, preload, and afterload) of LV systolic function is only feasible by performing invasive P-V analysis. In fact, the caval vein occlu- sion method enables the investigator to measure PRSW, which has been reported to be highly independent from chamber geometry and loading conditions.17By calculating PRSW, prior experimental studies have revealed that LV con- tractility shows typical alterations in PO-induced and VO-induced HF.9,15 Importantly, these investigations have
Table3Basicechocardiographicdataofthestudygroups PO-inducedHFVO-inducedHFPOvs.VO Shamt(n=12)TAC(n=12)Pvalue(Shamtvs.TAC)Shama(n=12)ACF(n=12)Pvalue(Shamavs.ACF)Pvalue LVEDD,mm7.85±0.768.98±0.54<0.018.37±0.5413.25±1.06<0.001<0.001 LVESD,mm4.16±0.766.21±0.82<0.0014.82±0.718.69±0.66<0.001<0.001 RWT,%0.497±0.050.657±0.11<0.0010.491±0.070.341±0.05<0.001<0.001 LVM,g1.19±0.242.69±0.59<0.0011.39±0.183.42±0.69<0.0010.03 LVMi,g/m2 1.09±0.192.29±0.47<0.0011.26±0.142.87±0.55<0.0010.03 FS,%47.4±5.430.7±8.8<0.00142.5±6.434.2±5.0<0.010.28 EF,%66.7±6.249.6±8.9<0.00164.8±9.259.0±3.60.06<0.01 LVEDV,μL383.8±91.1600.7±74.2<0.001546.8±46.21815.3±251.3<0.001<0.001 LVESV,μL128.0±39.8304.4±74.1<0.001191.7±50.1743.1±111.9<0.001<0.001 SV,μL255.8±62.9296.3±54.00.16355.0±63.31072.2±172.6<0.001<0.001 CO,mL/min102295±2223689708±173820.20127973±19838337487±66083<0.001<0.001 CO,cardiacoutput;EF,ejectionfraction;FS,fractionalshotening;LVEDD,left-ventricularend-diastolicdiameter;LVEDV,leftventricularend-diastolicvolume;LVESD,leftventricular end-systolicdiameter;LVESV,leftventricularend-systolicvolume;LVM,leftventrricularmass;LVMi,leftventricularmassindex;RWT,relativewallthickness;SV,strokevolume.
also highlighted that EF does not reflect the changes in LV inotropy under pathophysiological states when chronic hae- modynamic overload is present.15,18 Accordingly, preserved or even increased PRSW along with clearly decreased EF has been reported in aortic banded rats.19,20On the contrary, massively reduced PRSW coupled with slightly decreased EF has been consequently noted in ACF models.18The signifi- cance of the LV contractility determination in haemodynamic overload-induced HF is highlighted by the fact that it might anticipate the improvement of LV systolic function after cor- rection of the primary haemodynamic insult. However, P-V analysis cannot be routinely performed in the everyday clini- cal situation. Hence, efforts have been made tofind alterna- tive less-invasive methods.
Speckle tracking echocardiography has emerged as one po- tential candidate. This is underpinned by the fact that GLS has exhibited high sensitivity in detecting myocardial dysfunction at an early phase of HF development, when conventional functional measures (i.e. EF) are still in the normal range.2
Furthermore, GLS was shown to have a strong diagnostic and prognostic role in a wide variety of cardiovascular dis- eases, effectively facilitating its implementation to everyday clinical practice.3 According to previous studies using rat models of athlete’s heart and diabetic cardiomyopathy, STE-derived strain and strain rate parameters indeed show a relationship with load-independent markers of LV contrac- tility, which elucidates its incremental clinical value.5,6Never- theless, it is important to mention that in these experimental settings, pathological LV overload was absent. In a recent publication of our research group, we have demonstrated that GLS does not correlate with LV contractility indices in rat models of VO-induced and PO-induced HF, rather reflecting VAC.9 Therefore, GLS carries similar shortcomings to the conventional measures of LV function with its consid- erable load sensitivity.
These findings are also confirmed by strong clinical evi- dence. Increased LV preload results in augmented GLS, and conversely, LV unloading decreases GLS values.8,21In patients
Figure 2 Left ventricular (LV) functional parameters. (A) Representative pressure-volume loops of the study groups. Preload recruitable stroke work, a load-independent marker of contractility, showed distinct changes in haemodynamic overload states: aortocavalfistula (ACF,n= 12) demonstrated significantly deteriorated values, while the transverse aortic constriction (TAC,n= 12) group had maintained LV contractility. (b) In contrast with these findings, global longitudinal strain was only mildly decreased in the ACF group while it was markedly lower in TAC compared with their corresponding sham (Shamaand Shamt,n= 12/12). (c) Representative pressure-strain loops of the study groups. The changes of global myocardial work index (GMWI) showed a pattern resembling to PRSW: in ACF, GMWI was significantly lower, while it was preserved in TAC compared with their control. [Statistics:
Student’s unpairedt-test].
with severe LV volume overload (e.g. mitral and/or aortic re- gurgitation), maintained LV systolic function may obscure sig- nificant LV contractile dysfunction: marked reduction in GLS is a common finding following mitral valve repair even in the presence of maintained (or even supernormal) preopera- tive values.22,23In contrast with thesefindings, GLS values are generally lower in the case of LV pressure overload (e.g. arte- rial hypertension and aortic valve stenosis), and the deterio- ration in GLS can be at least partially restored by appropriate treatment (blood pressure-lowering medical therapy and valve replacement).7,24
Importantly, other factors with limited reversibility may also affect LV longitudinal deformation. Beyond loading con- ditions, altered LV geometry and adverse myocardial tissue remodelling also contribute to the changes of GLS values.25,26 The presence of conduction abnormalities (e.g. left bundle branch block) were also found to impair GLS through in- creased afterload sensitivity.27 Nevertheless, even if overt changes of the myocardial macrostructure and microstruc- ture are observed, GLS is highly dependent on the corre- sponding loading conditions.
The rationale of myocardial work is based on these obser- vations: the pressure-strain curve-derived indices examine LV deformation in the context of the corresponding pressure.10
By using the data of the STE analysis and a simple blood pres- sure measurement, GMWI is an easy-to-measure parameter which is already implemented into a commercially available software.28Myocardial work index has shown to be sensitive markers of LV dysfunction, enabling the detection of myocar- dial damage on the regional and global levels.10,28 Clinical data are scarce regarding GMWI in overload states. However, available evidence are concurrent with our observations:
arterial hypertension with no signs of HF augments GMWI, while mitral regurgitation results in lower GMWI values.29,30 Moreover, the correction of mitral regurgitation with transcatheter mitral valve repair is associated with increasing myocardial work indices along with unchanged GLS, justifying the concept of load-adjusted deformation parameters.30
On the other hand, GLS demonstrated strong correlation with interstitial and perivascularfibrosis in addition to myo- cardial BNP expression. Previous clinical studies confirm thesefindings, demonstrating that GLS is an early and reliable marker of LVfibrosis as well as a precise parameter of LV wall stress.31,32According to these results, GLS may rather be per- ceived as a composite marker of overall LV myocardial‘well- ness’, incorporating contractility, loading conditions, and adverse myocardial tissue remodelling.
Figure 3 Correlation of left ventricular (LV) contractility and LV deformation parameters. Global longitudinal strain (GLS) did not correlate with preload recruitable stroke work (PRSW). Conversely, global myocardial work index (GMWI) demonstrated strong correlation with PRSW, a gold standard load-independent parameter of LV contractility in the pooled study population (n= 48). [Statistics: Pearson’s correlation coefficient analysis].
Conclusions
In our study, rat models of PO-induced and VO-induced HF showed discrepancy between the load-independent markers of contractility and the STE-derived GLS: in the presence of considerable LV haemodynamic overload, GLS does not reflect inotropy. GMWI, which examines LV longi- tudinal deformation in the context of the corresponding pressure, may be a useful marker of LV contractility in a wide range of loading conditions. As such, it may be a ro- bust marker of LV systolic function with a meaningful clin- ical value. Nevertheless, GLS demonstrated a relationship with LV myocardial fibrosis and neurohumoral markers of LV wall stress, suggesting that LV GLS may not be a pure functional, but a more integrative parameter, as its magni- tude is influenced by inotropy, chamber geometry, and ad- verse tissue remodelling.
Limitations
Regarding our study, several limitations may be addressed.
Firstly, rat models of PO-induced and VO-induced HF pathophysiologically differ from the clinical setting observed in humans. In the ACF model, an acute severe LV VO is gen- erated, compared to the typically progressively worsening VO associated with mitral or aortic regurgitation. It is also im- portant to mention that the TAC model does not cover the whole spectrum of aortic stenosis. Of particular interest, in distinct patients (e.g. low-flow, low-gradient aortic stenosis), impairment of LV contractility can be seen.33
In contrast to the conventional method where LV GLS is measured from multiple apical views, GLS was quantified from the parasternal long-axis view. Nevertheless, evidence suggests that the insonation angle has only a modest effect on the measurement of LV GLS.34In order to calculate GMWI,
Figure 4 Correlation between global longitudinal strain (GLS) and markers of LV wall stress andfibrosis. GLS showed a significant correlation with atrial natriuretic peptide (ANP;n= 24) as well as area of myocardial interstitialfibrosis (n= 39) in the pooled study population. [Statistics: Pearson and Spear- man correlation coefficient analysis].
invasively measured LV pressure was used. Nevertheless, the calculation of GMWI by the commercially available non-invasive method have been thoroughly validated against invasive measurements. Due to these differences, GMWI was calculated using a custom software. However, the utilized myocardial work calculation method is fundamentally the same as those described in previous publications.10
Acknowledgement
The excellent technical assistance of Henriett Biró, Edina Urbán, Benjamin Prokaj, and Gábor Fritz is greatly acknowledged.
Con fl ict of interest
None declared.
Funding
Project no. NVKP_16-1-2016-0017 (‘National Heart Program’) has been implemented with the support provided from the National Research, Development and Innovation Fund of Hungary,financed under the NVKP_16 funding scheme. The research was financed by the Thematic Excellence Pro- gramme (2020-4.1.1.-TKP2020) of the Ministry for Innovation and Technology in Hungary, within the framework of the Therapeutic Development and Bioimaging thematic programmes of the Semmelweis University and also by the New National Excellence Program of the Ministry of Human Capacities (ÚNKP-20-4-I-SE-13 to B.L., ÚNKP-20-4-II-SE-20 to M.R., and ÚNKP-20-5 to A.K.). A.K. was supported by the János Bolyai Research Scholarship of the Hungarian Academy of Sciences. This project was supported by a grant from the National Research, Development and Innovation Office (NKFIH) of Hungary (K134939 to T.R.).
References
1. Konstam MA, Abboud FM. Ejection frac- tion: misunderstood and overrated (changing the paradigm in categorizing heart failure). Circulation 2017; 135: 717–719.
2. Marwick TH, Shah SJ, Thomas JD. Myo- cardial strain in the assessment of pa- tients with heart failure: a review.
JAMA Cardiol2019;4: 287–294.
3. Voigt JU, Cvijic M. 2- and 3-dimensional myocardial strain in cardiac health and disease.JACC Cardiovasc Imaging2019;
12: 1849–1863.
4. Lang RM, Badano LP, Mor-Avi V, Afilalo J, Armstrong A, Ernande L, Flachskampf FA, Foster E, Goldstein SA, Kuznetsova T, Lancellotti P, Muraru D, Picard MH, Rietzschel ER, Rudski L, Spencer KT, Tsang W, Voigt JU. Recommendations for cardiac chamber quantification by echocardiography in adults: an update from the American Society of Echocardi- ography and the European Association of Cardiovascular Imaging. J Am Soc Echocardiogr2015;28: 1–39 e14.
5. Kovacs A, Olah A, Lux A, Matyas C, Nemeth BT, Kellermayer D, Ruppert M, Torok M, Szabo L, Meltzer A, Assabiny A, Birtalan E, Merkely B, Radovits T.
Strain and strain rate by speckle- tracking echocardiography correlate with pressure-volume loop-derived con- tractility indices in a rat model of athlete’s heart.Am J Physiol Heart Circ Physiol2015;308: H743–H748.
6. Matyas C, Kovacs A, Nemeth BT, Olah A, Braun S, Tokodi M, Barta BA, Benke K, Ruppert M, Lakatos BK, Merkely B,
Radovits T. Comparison of speckle-- tracking echocardiography with invasive hemodynamics for the detection of characteristic cardiac dysfunction in type-1 and type-2 diabetic rat models.
Cardiovasc Diabetol2018;17: 13.
7. Galli E, Lancellotti P, Sengupta PP, Donal E. LV mechanics in mitral and aortic valve diseases: value of functional as- sessment beyond ejection fraction.JACC Cardiovasc Imaging2014;7: 1151–1166.
8. Negishi K, Borowski AG, Popovic ZB, Greenberg NL, Martin DS, Bungo MW, Levine BD, Thomas JD. Effect of gravita- tional gradients on cardiac filling and performance. J Am Soc Echocardiogr 2017;30: 1180–1188.
9. Ruppert M, Lakatos BK, Braun S, Tokodi M, Karime C, Olah A, Sayour AA, Hizoh I, Barta BA, Merkely B, Kovacs A, Radovits T. Longitudinal strain reflects ventriculoarterial coupling rather than mere contractility in rat models of he- modynamic overload-induced heart fail- ure. J Am Soc Echocardiogr 2020; 33: 1264–1275.
10. Russell K, Eriksen M, Aaberge L, Wilhelmsen N, Skulstad H, Remme EW, Haugaa KH, Opdahl A, Fjeld JG, Gjesdal O, Edvardsen T, Smiseth OA. A novel clinical method for quantification of re- gional left ventricular pressure-strain loop area: a non-invasive index of myo- cardial work. Eur Heart J 2012; 33: 724–733.
11. Percie du Sert N, Hurst V, Ahluwalia A, Alam S, Avey MT, Baker M, Browne WJ, Clark A, Cuthill IC, Dirnagl U,
Emerson M, Garner P, Holgate ST, Howells DW, Karp NA, Lazic SE, Lidster K, MacCallum CJ, Macleod M, Pearl EJ, Petersen OH, Rawle F, Reynolds P, Rooney K, Sena ES, Silberberg SD, Steckler T, Wurbel H. The ARRIVE guidelines 2.0: updated guidelines for reporting animal research. PLoS Biol 2020;18: e3000410.
12. Nemeth BT, Matyas C, Olah A, Lux A, Hidi L, Ruppert M, Kellermayer D, Kokeny G, Szabo G, Merkely B, Radovits T. Cinaciguat prevents the development of pathologic hypertrophy in a rat model of left ventricular pressure overload.Sci Rep2016;6: 37166.
13. Ruppert M, Korkmaz-Icoz S, Loganathan S, Jiang W, Lehmann L, Olah A, Sayour AA, Barta BA, Merkely B, Karck M, Radovits T, Szabo G. Pressure-volume analysis reveals characteristic sex- related differences in cardiac function in a rat model of aortic banding- induced myocardial hypertrophy.Am J Physiol Heart Circ Physiol 2018; 315: H502–H511.
14. Pacher P, Nagayama T, Mukhopadhyay P, Batkai S, Kass DA. Measurement of cardiac function using pressure-volume conductance catheter technique in mice and rats. Nat Protoc 2008; 3: 1422–1434.
15. Ruppert M, Korkmaz-Icoz S, Loganathan S, Jiang W, Olah A, Sayour AA, Barta BA, Karime C, Merkely B, Karck M, Radovits T, Szabo G. Incomplete struc- tural reverse remodeling from late-stage left ventricular hypertrophy
impedes the recovery of diastolic but not systolic dysfunction in rats.J Hypertens 2019;37: 1200–1212.
16. Yancy CW, Jessup M, Bozkurt B, Butler J, Casey DE Jr, Colvin MM, Drazner MH, Filippatos GS, Fonarow GC, Givertz MM, Hollenberg SM, Lindenfeld J, Masoudi FA, McBride PE, Peterson PN, Stevenson LW, Westlake C. 2017 ACC/
AHA/HFSA focused update of the 2013 ACCF/AHA guideline for the manage- ment of heart failure: a report of the American College of Cardiology/Ameri- can Heart Association Task Force on Clinical Practice Guidelines and the Heart Failure Society of America.J Am Coll Cardiol2017;70: 776–803.
17. McClain LC, Wright LD, Bose RK, Spratt JA, Maier GW. Afterload sensitivity of nonlinear end-systolic pressure-volume relation vs preload recruitable stroke work in conscious dogs. J Surg Res 1998;75: 6–17.
18. Hutchinson KR, Guggilam A, Cismowski MJ, Galantowicz ML, West TA, Stewart JA Jr, Zhang X, Lord KC, Lucchesi PA.
Temporal pattern of left ventricular structural and functional remodeling following reversal of volume overload heart failure. J Appl Physiol (1985) 2011;111: 1778–1788.
19. Ruppert M, Bodi B, Korkmaz-Icoz S, Loganathan S, Jiang W, Lehmann L, Olah A, Barta BA, Sayour AA, Merkely B, Karck M, Papp Z, Szabo G, Radovits T. Myofilament Ca(2+) sensitivity corre- lates with left ventricular contractility during the progression of pressure overload-induced left ventricular myo- cardial hypertrophy in rats.J Mol Cell Cardiol2019;129: 208–218.
20. Chemaly ER, Chaanine AH, Sakata S, Hajjar RJ. Stroke volume-to-wall stress ratio as a load-adjusted and stiffness-ad- justed indicator of ventricular systolic performance in chronic loading.J Appl Physiol2012;113: 1267–1284.
21. Nafati C, Gardette M, Leone M, Reydellet L, Blasco V, Lannelongue A,
Sayagh F, Wiramus S, Antonini F, Albanese J, Zieleskiewicz L. Use of speckle-tracking strain in preload- dependent patients, need for cautious interpretation!Ann Intensive Care2018;
8: 29.
22. Bijvoet GP, Teske AJ, Chamuleau SAJ, Hart EA, Jansen R, Schaap J. Global longitudinal strain to predict left ventricular dysfunction in asymptomatic patients with severe mitral valve regur- gitation: literature review.Neth Heart J 2020;28: 63–72.
23. Pandis D, Sengupta PP, Castillo JG, Caracciolo G, Fischer GW, Narula J, Anyanwu A, Adams DH. Assessment of longitudinal myocardial mechanics in patients with degenerative mitral valve regurgitation predicts postoperative worsening of left ventricular systolic function.J Am Soc Echocardiogr 2014;
27: 627–638.
24. Ankola AA, DiLorenzo MP, Turner ME, Torres AJ, Crystal MA, Shah A. Left ven- tricular strain normalizes after balloon aortic valvuloplasty in infants with con- genital aortic stenosis. Pediatr Cardiol 2020;41: 576–583.
25. Stokke TM, Hasselberg NE, Smedsrud MK, Sarvari SI, Haugaa KH, Smiseth OA, Edvardsen T, Remme EW. Geometry as a confounder when assessing ventric- ular systolic function: comparison be- tween ejection fraction and strain.J Am Coll Cardiol2017;70: 942–954.
26. Lakatos BK, Kovacs A. Global longitudi- nal strain in moderate aortic stenosis: a chance to synthesize it all? Circ Cardiovasc Imaging2020;13: e010711.
27. Aalen J, Storsten P, Remme EW, Sirnes PA, Gjesdal O, Larsen CK, Kongsgaard E, Boe E, Skulstad H, Hisdal J, Smiseth OA. Afterload hypersensitivity in pa- tients with left bundle branch block.
JACC Cardiovasc Imaging 2019; 12: 967–977.
28. Wang CL, Chan YH, Wu VC, Lee HF, Hsiao FC, Chu PH. Incremental prog- nostic value of global myocardial work
over ejection fraction and global longi- tudinal strain in patients with heart fail- ure and reduced ejection fraction. Eur Heart J Cardiovasc Imaging 2021; 22: 348–356.
29. Kuznetsova T, D’Hooge J, Kloch-Badelek M, Sakiewicz W, Thijs L, Staessen JA.
Impact of hypertension on ventricular- arterial coupling and regional myocar- dial work at rest and during isometric exercise. J Am Soc Echocardiogr2012;
25: 882–890.
30. Papadopoulos K, Ikonomidis I, Chrissoheris M, Chalapas A, Kourkoveli P, Parissis J, Spargias K. MitraClip and left ventricular reverse remodelling: a strain imaging study. ESC Heart Fail 2020;7: 1409–1418.
31. Cameli M, Mondillo S, Righini FM, Lisi M, Dokollari A, Lindqvist P, Maccherini M, Henein M. Left ventricular deforma- tion and myocardialfibrosis in patients with advanced heart failure requiring transplantation. J Card Fail 2016; 22: 901–907.
32. Ersboll M, Valeur N, Mogensen UM, Andersen M, Greibe R, Moller JE, Hassager C, Sogaard P, Kober L. Global left ventricular longitudinal strain is closely associated with increased neuro- hormonal activation after acute myocar- dial infarction in patients with both reduced and preserved ejection fraction:
a two-dimensional speckle tracking study. Eur J Heart Fail 2012; 14: 1121–1129.
33. Gotzmann M, Hauptmann S, Hogeweg M, Choudhury DS, Schiedat F, Dietrich JW, Westhoff TH, Bergbauer M, Mugge A. Hemodynamics of paradoxical severe aortic stenosis: insight from a pressure- volume loop analysis. Clin Res Cardiol 2019;108: 931–939.
34. Forsha D, Risum N, Rajagopal S, Dolgner S, Hornik C, Barnhart H, Kisslo J, Barker P. The influence of angle of insonation and target depth on speckle-tracking strain. J Am Soc Echocardiogr2015;28: 580–586.