Redox Biology 38 (2021) 101808
Available online 25 November 2020
2213-2317/© 2020 The Author(s). Published by Elsevier B.V. This is an open access article under the CC BY-NC-ND license
(http://creativecommons.org/licenses/by-nc-nd/4.0/).
Research Paper
Cyclobutane pyrimidine dimers from UVB exposure induce a
hypermetabolic state in keratinocytes via mitochondrial oxidative stress
Csaba Heged us ˝
a,b, Tam ´ as Juh ´ asz
c, Eszter Fidrus
a,b, Eszter Anna Janka
a, G ´ abor Juh ´ asz
d, G abor Boros ´
e, Gy orgy Paragh ¨
f, Karen Uray
g, Gabriella Emri
a, ´ Eva Remenyik
a,**,1, P ´ eter Bai
g,h,i,*,1aDepartment of Dermatology, Faculty of Medicine, University of Debrecen, 4032, Debrecen, Hungary
bUniversity of Debrecen, Doctoral School of Health Sciences, 4032, Debrecen, Hungary
cDepartment of Anatomy, Histology and Embryology, Faculty of Medicine, University of Debrecen, 4032, Debrecen, Hungary
dDepartment of Anatomy, Cell and Developmental Biology, E¨otv¨os Lor´and University, 1117 Budapest, Hungary and Institute of Genetics, Biological Research Centre, 6726, Szeged, Hungary
eBioNTech RNA Pharmaceuticals GmbH, BioNTech AG, 55131, Mainz, Germany
fDepartment of Dermatology and Department of Cell Stress Biology, Roswell Park Comprehensive Cancer Center, 665 Elm St, Buffalo, NY, 14203, USA
gDepartment of Medical Chemistry, Faculty of Medicine, University of Debrecen, 4032, Debrecen, Hungary
hMTA-DE Lendület Laboratory of Cellular Metabolism Research Group, University of Debrecen, 4032, Debrecen, Hungary
iResearch Center for Molecular Medicine, Faculty of Medicine, University of Debrecen, 4032, Debrecen, Hungary
A R T I C L E I N F O Keywords:
UVB CPD
Photolyase mRNA Mitochondria Keratinocyte
A B S T R A C T
Ultraviolet B radiation (UVB) is an environmental complete carcinogen, which induces and promotes kerati- nocyte carcinomas, the most common human malignancies. UVB induces the formation of cyclobutane pyrim- idine dimers (CPDs). Repairing CPDs through nucleotide excision repair is slow and error-prone in placental mammals. In addition to the mutagenic and malignancy-inducing effects, UVB also elicits poorly understood complex metabolic changes in keratinocytes, possibly through CPDs. To determine the effects of CPDs, CPD- photolyase was overexpressed in keratinocytes using an N1-methyl pseudouridine-containing in vitro-tran- scribed mRNA. CPD-photolyase, which is normally not present in placental mammals, can efficiently and rapidly repair CPDs to block signaling pathways elicited by CPDs. Keratinocytes surviving UVB irradiation turn hyper- metabolic. We show that CPD-evoked mitochondrial reactive oxygen species production, followed by the acti- vation of several energy sensor enzymes, including sirtuins, AMPK, mTORC1, mTORC2, p53, and ATM, is responsible for the compensatory metabolic adaptations in keratinocytes surviving UVB irradiation. Compen- satory metabolic changes consist of enhanced glycolytic flux, Szent-Gy¨orgyi-Krebs cycle, and terminal oxidation.
Furthermore, mitochondrial fusion, mitochondrial biogenesis, and lipophagy characterize compensatory hy- permetabolism in UVB-exposed keratinocytes. These properties not only support the survival of keratinocytes, but also contribute to UVB-induced differentiation of keratinocytes. Our results indicate that CPD-dependent signaling acutely maintains skin integrity by supporting cellular energy metabolism.
1. Introduction
DNA repair is an energy intensive process [1]. Acute DNA damage stimulates oxidative metabolism [2], mitochondrial fusion [3], and metabolic changes that restore cellular ATP and NAD+levels depleted by the DNA repair machinery [4–7]. Direct physical connections and
multi-pronged communication exist between the nucleus and mito- chondria [8] to support their interaction, so mitochondria can serve the energy needs of the cell during DNA repair [1]. In contrast, cells with persistent, high levels of DNA damage undergo a cascade of events leading to mitochondrial dysfunction that contribute to diseases [9,10], such as in Cockayne Syndrome (CS), Xeroderma Pigmentosum (XP), and
* Corresponding author. University of Debrecen, Department of Medical Chemistry, 4032, Debrecen, Egyetem t´er 1., Hungary.
** Corresponding author.
E-mail addresses: remenyik@med.unideb.hu (´E. Remenyik), baip@med.unideb.hu (P. Bai).
1 Both authors are equally responsible for the paper.
Contents lists available at ScienceDirect
Redox Biology
journal homepage: www.elsevier.com/locate/redox
https://doi.org/10.1016/j.redox.2020.101808
Received 28 August 2020; Received in revised form 16 November 2020; Accepted 19 November 2020
Ataxia Telangiectasia (AT) patients [5,11]. Beyond these, the metabolic effects of DNA damage and DNA repair are not well characterized.
In addition to the induction of mitochondrial oxidative phosphory- lation, autophagy represents a mode to support cell survival. During autophagy, damaged organelles and macromolecules are recycled inside the lysosomes [12]. Autophagic machinery can be activated upon DNA damage to provide an adequate supply of ATP, NAD+, and dNTPs for DNA replication and repair [13]. Autophagic flux is impaired in cells with DNA repair defects [14–16] or with persistent DNA damage and mitochondrial dysfunction [17]. Autophagy deficient keratinocytes accumulate DNA damage [18]. Taken together, these reports indicate crosstalk between the DNA damage response (DDR), autophagy, and the mitochondria.
UV radiation is a complete carcinogen. UV radiation induces and promotes squamous and basal cell carcinoma formation and growth and is the environmental carcinogen responsible for most human malig- nancies. The mode through which UVA and UVB induce DNA damage is different. UVA (315–400 nm) mainly induces oxidative stress and DNA damage via reactive oxygen species (ROS) generation; UVB exposure (280–315 nm) mostly causes direct DNA damage through the production of intra-strand DNA base cross-linking, including cyclobutane pyrimi- dine dimers (CPDs) and (6–4) pyrimidine-pyrimidone photoproducts (6–4)PPs] and their Dewar isomers [19]. In humans, UVB-induced photoproducts are repaired by the evolutionary conserved but slow nucleotide excision repair (NER) mechanism [20–22]. UV irradiation can reach the surface of an organism. In humans, UV(B)-induced dam- age primarily affects the skin and eyes; in the skin, the primary acceptors of UVB light are keratinocytes.
In lower taxonomical classes from Archaebacteria to Marsupials, there is another repair mechanism to eliminate CPDs, called photore- activation [23,24]. Upon photon absorption in the near-UV/blue light (300–500 nm) range, the excited FAD− transfers one electron to the covalently attached pyrimidine bases, resulting in the removal of the DNA lesion [25,26]. Photoreactivation is an efficient DNA repair process catalyzed by photolyases, which remove CPDs or (6–4) photoproducts from DNA within an hour [27]. In contrast, the slower rate of global genome NER (GG-NER) requires 48 h to completely remove CPDs [28].
The overexpression of photolyases in placental (e.g. human) cells, represent an excellent opportunity to study the role of CPDs. In this study, we set out to investigate the metabolic effects of UVB-induced CPDs in keratinocytes.
2. Materials and methods 2.1. Chemicals
All chemicals were obtained from Sigma-Aldrich (St. Louis, MO, USA) unless stated otherwise. Key chemicals are listed in Supplementary Table S1.
2.2. Cell culture
The human immortalized HaCaT keratinocyte cell line was cultured in 4500 mg/L high glucose Dulbecco’s modified eagle media (DMEM) with L-glutamine and sodium pyruvate (Biosera, Budapest, Hungary) containing 10% heat-inactivated fetal bovine serum (FBS) and 0.5%
antibiotic/antimycotic solution (antibiotic antimycotic solution, stabi- lized Sigma, A5955).
Neonatal human epidermal keratinocytes (NHEK) (Thermo Fisher Scientific, C0015C) were cultured in Epilife Medium with 60 μM calcium (Thermo Fisher Scientific, MEPI500CA) supplemented with human keratinocyte growth supplement (Thermo Fisher Scientific, S0015) and 0.5% antibiotic/antimycotic solution (antibiotic antimycotic solution, stabilized Sigma, A5955).
2.3. UVB irradiation, dosimetry
Cells were washed and covered with 300 μL pre-warmed Dulbecco’s phosphate-buffered saline (DPBS) (Lonza, Walkersville, MD, USA) sup- plemented with 1 g/L D-glucose (Duchefa Biochemie, Haarlem, Netherlands), 100 mg/L CaCl2, and 100 mg/L MgCl2 (Spektrum 3D, P´ecs, Hungary). Cells were subjected to 20 or 40 mJ/cm2 UVB using two UVB broadband tubes (TL-20W/12 RS; Philips, Eindhoven, Netherlands). Non-irradiated cells were covered with tin foil. The proper UVB dose was measured with a UVX digital radiometer (UVP Inc., San Gabriel, CA, USA). After irradiation, the DPBS was replaced with fresh and complete culture medium. Cells remained in culture medium until the end of the experiment.
2.4. CPD-photolyase mRNA-based model system
Photolyase mRNA was generously gifted by Prof. Katalin Kariko and ´ Dr. G´abor Boros (BioNTech RNA pharmaceuticals GmbH, BioNTech AG). In vitro transcription of CPD-photolyase mRNA was performed as previously described [29], using linearized plasmid (pTEV-CPD-- PL-A101) encoding codon-optimized Potorous CPD-photolyase. The N1-methyl pseudouridine-containing mRNA was cellulose purified as described [30]. Instead of uridine, N1-methylpseudouridine was incor- porated into mRNA to provide enhanced stability and reduce immuno- genicity, thereby, improving the translational efficiency. The mRNA was shown to be free of dsRNA contaminants using dsRNA-specific J2 mAb (English & Scientific Consulting, Budapest, Hungary) in a dot-blot assay [31]. RNA samples were analyzed by agarose gel electrophoresis for quality assurance and stored in siliconized tubes at − 20 ◦C.
HaCaT or NHEK cells were harvested with trypsin-EDTA (Biosera, Budapest, Hungary), then seeded into 24-well plates at a density of 1 × 10⁵ cells per well for HaCaT cells and 2 ×10⁵ cells per well for NHEK cells, and allowed to adhere for at least 12 h. At 80% confluency, cells in each well were transfected with 500 ng CPD-photolyase mRNA com- plexed with 1 μL Lipofectamine Plus and 2 μL Lipofectamine LTX Re- agent (Thermo Fisher Scientific) in a final volume of 400 μL of serum and antibiotic-free EpiLife medium (Thermo Fisher Scientific). After 2 h, cells were washed and covered with 300 μL pre-warmed DPBS (Lonza, Walkersville, MD, USA) supplemented with 1 g/L D-glucose (Duchefa Biochemie, Haarlem, Netherlands), 100 mg/L CaCl2, and 100 mg/L MgCl2 (Spektrum 3D, P´ecs, Hungary). Cells were subjected to 20 or 40 mJ/cm2 UVB, using two UVB broadband tubes (TL-20W/12 RS; Philips, Eindhoven, Netherlands). Immediately after UVB irradiation, cells were either exposed to photoreactivating visible light using Sylvania Standard F18W/54–765 Daylight bulbs or kept in the dark for 30 min. The acti- vation of CPD-photolyase is referred to as “Light” throughout the manuscript, whilst “Dark” refers to the controls, where CPD-photolyase is inactive. Dark controls were covered with tin foil during photoreac- tivation. After treatment, the DPBS was replaced with fresh and com- plete growth medium and cells were cultured for 24 h. The proper UV dose was measured with a UVX digital radiometer (UVP Inc., San Gabriel, CA, USA). Detached dead cells were excluded from the exper- iments, except for studies on cell viability.
2.5. Cell viability
Cell viability 24 h post-UVB irradiation was determined using a Dead Cell Apoptosis Kit with Annexin V FITC and PI (Invitrogen, Carlsbad, CA, USA), according to the manufacturer’s instructions. Labeled cells were analyzed by flow cytometry with a FACSCalibur (Becton Dickinson, San Jose, CA, USA). Double negative cells were considered viable. For data collection and evaluation, CellQuest software 5.2 (Becton Dickinson) and Flowjo v10.0.7 (TreeStar, Ashland, OR, USA) single-cell analysis software were used.
Redox Biology 38 (2021) 101808 2.6. Cell proliferation
Cell proliferation was determined using clonogenic assays. Kerati- nocytes were harvested 24 h after UVB irradiation and cells were seeded in equal numbers in 100 mm Petri dishes at 5000 cells/dish. Cells were allowed to grow for 10 days. The medium was replaced every three days.
Ten days later, cells were washed with PBS, fixed with 100% methanol, and stained with May-Grünwald-Giemsa solution (Histolab Products, V¨astra Fr¨olunda, Sweden).
2.7. Cell cycle analysis
Cell cycle progression was quantified using propidium iodide (PI) staining. Briefly, cells were trypsinized, fixed with ice-cold 96% ethanol for 10 min, washed twice with PBS, and permeabilized with 0.1% Triton X-100. After extensive washing, cells were incubated with 0.5 mg/mL RNase in PBS at 37 ◦C for 1 h and counted for cell number normalization.
Cells were stained with PI (20 μg/mL final concentration, 10 min).
Unbound PI was eliminated by washing with PBS and doublet discrim- ination was performed. To determine DNA content, samples were analyzed on the x-axis in the FL2-A channel using a FACSCalibur flow cytometer.
2.8. CPD-specific enzyme-linked immunosorbent assay (ELISA)
Genomic DNA was extracted from HaCaT cells using a Purelink Genomic DNA mini kit (Thermo Fisher Scientific), according to the manufacturer’s instruction. For the quantitative detection of CPDs, direct ELISA was applied as previously described [29].
2.9. Western blot
HaCaT cells were pelleted by mild centrifugation at 1500 rpm for 5 min at 4 ◦C. The pellets were lysed on ice with RIPA buffer supplemented with a protease inhibitor cocktail (1:1000). After 5 min incubation on ice, supernatants were obtained by centrifugation of the lysates at 15,000 rpm for 10 min at 4 ◦C. Protein concentration was determined using a Pierce BCA assay kit (Thermo Fisher Scientific). The lysates were mixed with 5X loading buffer (Bromophenol blue (0.25%), β-Mercap- toethanol (5%), Glycerol (50%), sodium dodecyl sulfate (SDS; 10%), Tris-HCl (0.25 M, pH 6.8)), boiled for 10 min at 100 ◦C, and subjected to 7.5%, 10%, or 12.5% SDS polyacrylamide gel electrophoresis. Proteins were transferred onto nitrocellulose membranes (Bio-Rad, Hercules, CA, USA). The membranes were blocked with TBST (0.05% Tween 20 in TBS buffer) containing 5% bovine serum albumin (BSA). The incubation with primary antibodies was carried out overnight at 4 ◦C followed by washing. Membranes were incubated with horseradish peroxidase (HRP)-conjugated goat anti-mouse or anti-rabbit IgG as a secondary antibody (Bio-Rad) at room temperature for 1 h. Secondary antibody binding was detected with Pierce™ ECL Western Blotting Substrate (Thermo Fisher Scientific) or SuperSignal West Femto Maximum Sensitivity Substrate (Thermo Fisher Scientific). Antibodies used for Western blotting are listed in Supplementary Table S2. Images were captured using LI-COR C-DIGIT (Lincoln, NE, USA) with the Image Studio Digits Ver 5.2 software package. Bands were quantified using the ImageJ open source software (version 1.52a., National Institutes of Health, Bethesda, MD) [32]. Protein expression was normalized to β-actin.
2.10. Mitochondrial mass
Mitotracker Green (Thermo Fisher Scientific) was added to the cul- ture medium 24 h after UVB exposure (final concentration of 100 nM, 37 ◦C, 30 min). Following incubation, cells were washed with PBS, harvested by trypsinization, and placed on ice. The fluorescent intensity of cells stained with Mitotracker Green was analyzed using a
FACSCalibur flow cytometer.
2.11. Mitochondrial membrane potential
To assess mitochondrial membrane potential, cells were stained with 100 nM Mitotracker Red CMXRos (Thermo Fisher Scientific) dye at 37 ◦C for 30 min. Cells were washed with PBS, harvested by trypsini- zation, and placed on ice. The fluorescent intensity of cells stained with Mitotracker Red CMXRos was analyzed using a FACSCalibur flow cytometer.
2.12. Detection of reactive oxygen species (ROS)
Dihydroethidium (Thermo Fisher Scientific) was added to the culture medium 24 h after UVB exposure (final concentration of 40 nM, 37 ◦C, 30 min). Cells were washed with PBS, harvested by trypsinization, and placed on ice. The fluorescent intensity of cells stained with dihy- droethidium was analyzed using a FACSCalibur flow cytometer.
2.13. Detection of mitochondrial ROS
Cells were washed with PBS and incubated with MitoSOX Red at a final concentration of 1 μM for 10 min. Keratinocytes were harvested by trypsinization and immediately analyzed by flow cytometry for mito- chondrial ROS detection.
2.14. Mitochondrial DNA (mtDNA) isolation
Mitochondria were isolated by Mitochondrial DNA Isolation Kit provided by Biovision (Mountain View, CA, USA) according to the manufacturer’s instructions.
2.15. Assessment of mitochondrial morphology, lipid droplet formation, autophagy induction, and keratin 1 expression using confocal microscopy
Cells were plated on glass slides in a 24-well plate and, 24 h after UVB exposure, stained with 100 nM Mitotracker Red CMXRos (Thermo Fisher Scientific), 1 μg/mL Bodipy 493/503 (Thermo Fisher Scientific), or 30 μL Adipored (Lonza) in 1 mL PBS at 37 ◦C for 30 min. Cells were washed with PBS twice, fixed with 3.7% paraformaldehyde solution at room temperature for 20 min, and permeabilized with 0.2% Triton X- 100 for 20 min. After washing with PBS, slides were blocked with PBS with 1% BSA at 37 ◦C for 1 h. Cells were incubated with an Alexa Fluor 488-conjugated LC3A/B antibody diluted in 1% BSA (1:100) or with keratin 1 antibody (1:1000) (Abcam, Cambridge, UK) in 1% BSA at 4 ◦C overnight in a humid chamber. The next day, slides were washed three times with PBS and incubated with Alexa-488 conjugated goat anti- rabbit antibody (Thermo Fisher Scientific) for K1 visualization. Prior to imaging, cells were stained with a mounting medium with DAPI and analyzed using an Olympus FV3000 confocal microscopy (Olympus Co.
Tokyo, Japan) with a 60x oil immersion objective (NA: 1.3). The average pixel time was 4 μs. Z image series of 1 μm optical thickness were recorded in sequential scan mode. Background subtraction, noise reduction, local contrast enhancement, and unsharp mask were applied to raw mitochondrial images for better image quality and proper image evaluation [33]. Processed images were analyzed using ImageJ software Mito-Morphology Macro (URL:https://imagejdocu.tudor.lu/plugin/mo rphology/mitochondrial_morphology_macro_plug-in/start). Mitochon- drial number, content, circularity, and form factor were calculated from confocal microscopic images. Co-localization was measured using a JACoP plugin in ImageJ (URL: https://imagejdocu.tudor.lu/doku.php?
id=plugin:analysis:jacop_2.0:just_another_colocalization_plugin:start).
We discriminated three mitochondrial morphological subtypes, namely, fragmented, intermediate, and tubular, based on their length and interconnectivity.
C. Heged˝us et al.
2.16. Measurement of citrate synthase (CS) activity
For determining citrate synthase activity, a citrate synthase assay kit (CS0720) was used according to the manufacturer’s instructions. Optical density changes were determined using a kinetic program at 412 nm on a microplate reader. Values were normalized to total protein concentration.
2.17. Analysis of cellular oxygen consumption rate and glycolysis The oxygen consumption rate (OCR) is a proxy for oxidative phos- phorylation (OXPHOS), whereas ECAR represents lactic acid formed during glycolysis. Cells were seeded in an XF96 cell culture plate at 10,000 cell/well density for HaCaT cells, and 20,000 cell/well density for NHEK cells. Cells in one well were transfected with 125 ng CPD- specific photolyase-encoding mRNA complexed with 0.25 μL Lipofect- amine Plus and 0.5 μL Lipofectamine LTX Reagent (Thermo Fisher Sci- entific) in 100 μL serum and antibiotic-free Epilife medium (Thermo Fisher Scientific). Cells were covered with 30 μL pre-warmed DPBS (Lonza) for UVB irradiation. All other steps were similar for UVB irra- diation and photoreactivation. One hour prior to the assay, the culture medium was replaced with unbuffered DMEM supplemented with 10 mM D-glucose and the cells were equilibrated in a CO2-free incubator for 1 h. After four measurements of oxygen consumption, oligomycin and antimycin A were subsequently injected to determine oligomycin- resistant respiration and basal OCR, respectively. For the scheme of the experiment, see Supplementary Fig. S1A). All OCR and ECAR values were normalized to the total protein obtained from cells lysed with 1 M NaOH.
2.18. Characterization of substrate dependency of oxidative phosphorylation
The assay was based on the MitoFlex test from Agilent Agilent Technologies (Santa Clara, CA, USA): https://www.agilent.com/cs/libr ary/usermanuals/public/XF_Mito_Fuel_Flex_Test_Kit_User_Guide%20ol d.pdf. Cells were seeded in an XF96 cell culture plate (Agilent Tech- nologies) at 10,000 cell/well density. Cells in one well were transfected with 125 ng CPD-specific photolyase-encoding mRNA complexed with 0.25 μL Lipofectamine Plus and 0.5 μL Lipofectamine LTX Reagent (Thermo Fisher Scientific) in 100 μL serum and antibiotic-free Epilife medium (Thermo Fisher Scientific). Cells were covered with 30 μL pre- warmed DPBS (Lonza) for UVB irradiation. All other steps were similar for UVB irradiation and photoreactivation. One hour prior to the assay, the culture medium was replaced with unbuffered DMEM (Seahorse Bioscience North Billerica, MA, USA) that was supplemented with 1 mM pyruvate, 2 mM L-glutamine, and 10 mM D-glucose. Cells were equili- brated in a CO2-free incubator for 1 h before the assay. In the assays, BPTES was used to block glutaminolysis, Etomoxir was used to block fatty acid import to the mitochondria, and UK-5099 was used to inhibit pyruvate entry into the mitochondria.
To assess substrate oxidation ratios (termed baseline flux), after recording baseline OCR in cells, cells were blocked with either one of the inhibitors, OCR was recorded, then cells received the remaining two inhibitors and OCR was recorded again. The difference between the baseline OCR and the OCR with the three inhibitors was considered 100% (i.e. the total contribution of the three pathways to cellular OCR).
The difference between the baseline OCR and the OCR with one inhib- itor was calculated and was expressed as a percent of the total contribution.
To assess substrate oxidation ratios under stress (termed maximal output), after recording baseline OCR in cells, cells were blocked with either of two inhibitors, OCR was recorded, then cells received the remaining one inhibitor and OCR was recorded. The difference between the baseline flux and the OCR with the three inhibitors was considered 100% (i.e. the total contribution of the three pathways to cellular OCR).
The difference between the OCR with two inhibitors and the OCR with all three inhibitors was calculated and was expressed as a percent of the total contribution, calculated before. The difference between baseline flux and maximal output was calculated and termed spare capacity. OCR readings were measured using an XF96 extracellular flux analyzer (Seahorse Bioscience, North Billerica, MA, USA). The scheme of the measurements is presented in Figs. S1B and C.
2.19. Analysis of fatty acid oxidation
Cells were seeded in an XF96 Cell Culture Microplate at 10,000 cells/
well. The growth medium was replaced with substrate-limited medium (DMEM with 0.5 mM D-glucose, 1 mM L-Glutamine, 0.5 mM L-carnitine hydrochloride, and 1% FBS) to deplete endogenous substrates within the cell 24 h prior to the assay. Cells were washed with FAO Assay Medium (111 mM NaCl, 4.7 mM KCl, 1.25 mM CaCl2, 2 mM MgSO4, 1.2 mM NaH2PO4 supplemented with 2.5 mM glucose, 0.5 mM carnitine, and 5 mM HEPES and adjusted to pH 7.4) 45 min prior to the assay. FAO assay medium (135 μL/well) was added to each well and cells were equili- brated in a CO2-free incubator for 1 h. Vehicle or Etomoxir at a final concentration of 40 μM was added to each well to inhibit CPT1 and incubated for 15 min. XF Palmitate-BSA FAO Substrate (30 μL) or BSA (Seahorse Bioscience) was added to the appropriate wells to discrimi- nate exogenous and endogenous fatty acid oxidation. After four mea- surements of baseline oxygen consumption, oligomycin FCCP and antimycin A were injected. All OCR values were normalized to the total protein obtained from cells lysed by 1 M NaOH.
2.20. Determination of NAD+levels
The colorimetric assay for NAD+/NADH ratio determination was purchased from Biovision (Mountain View, CA, USA). Cells were washed with PBS two times, harvested in trypsin-EDTA solution, and pelleted by mild centrifugation. The pellet was extracted with NAD+ or NADH extraction buffer and exposed to freeze/thaw cycles. Samples were spun and the supernatant was transferred to a 96-well plate for NAD+/NADH assays. For NAD+determination, half of the samples were transferred into another tube and NAD+was decomposed by heating samples at 60 ◦C. Finally, working reagent was added to the samples, and optical density was determined at 450 nm. Optical densities of the standard curve and samples were used to calculate NAD+content. Values were normalized to total protein concentration.
2.21. Statistical analysis
For calculations, GraphPad Prism 7 (GraphPad Software Inc., San Diego, CA, USA) and SPSS 25 software (SPSS package for Windows, Release 25.; SPSS, Chicago, IL, USA) were used. The Kolmogor- ov–Smirnov test was used to assess the normality of the population. If necessary, values were normalized by transformation. The frequency of mitochondrial morphological subtypes (fragmented, intermediate, and tubular) was calculated using a chi2 test. For comparing multiple groups, ANOVA was used followed by Sidak’s multiple comparisons post-hoc test or Dunnett’s post-hoc test. All data are presented as mean ±SEM.
A p <0.05 was considered statistically significant. Statistical analysis was supervised by a biostatistician, EA Janka.
3. Results
3.1. Photolyase activation prevents UVB-induced DNA damage and restores cell viability
We aimed to assess the involvement of CPDs in metabolic processes by applying the photo-activated CPD-removal enzyme, photolyase. The activation of photolyase is marked by “Light” throughout the manu- script. “Dark” marks the controls, where photolyase is inactive. We
Redox Biology 38 (2021) 101808
applied two UVB doses, 20 or 40 mJ/cm2, and the cells were assessed 24 h post-irradiation. UVB-induced CPDs were efficiently removed by photolyase and the photodamage was repaired over time in the whole genome (Fig. 1A), as well as in the mitochondrial genome (Fig. 1B). UVB reduced the number of viable cells (Fig. 1C), reduced cell proliferation (Fig. 1D), and blocked the exit from M-phase of the cell cycle (Fig. 1E) by inducing CPDs.
3.2. CPD removal reprograms the cellular energy sensor system
UVB can reprogram cellular metabolism [7,34]. Therefore, the participation of CPDs in metabolic regulation was assessed. The non-redox functions of NAD+were assessed first [35]. UVB irradiation reduced cellular NAD+levels drastically in a CPD-dependent manner (Fig. 2A), indicating the activation of NAD+consumers, such as PARP1 [36]. Indeed, UVB irradiation-induced PAR formation in a pattern, which indicated PARP1 involvement (Fig. 2B, Fig. S2A). The removal of
CPDs reduced PAR formation (Fig. 2B, Fig. S2A), suggesting that PARP activity is CPD-dependent. Furthermore, UVB induced the expression of sirtuins, which are also NAD+-consuming enzymes (Fig. 2C, Fig. S2B).
UVB induced the phosphorylation of ATM (at S1981), p53 (at S15), AMPK (at T172), AKT (at S473), and S6K (at T389) in a dose and CPD-dependent fashion (Fig. 2D, Fig. S2C).
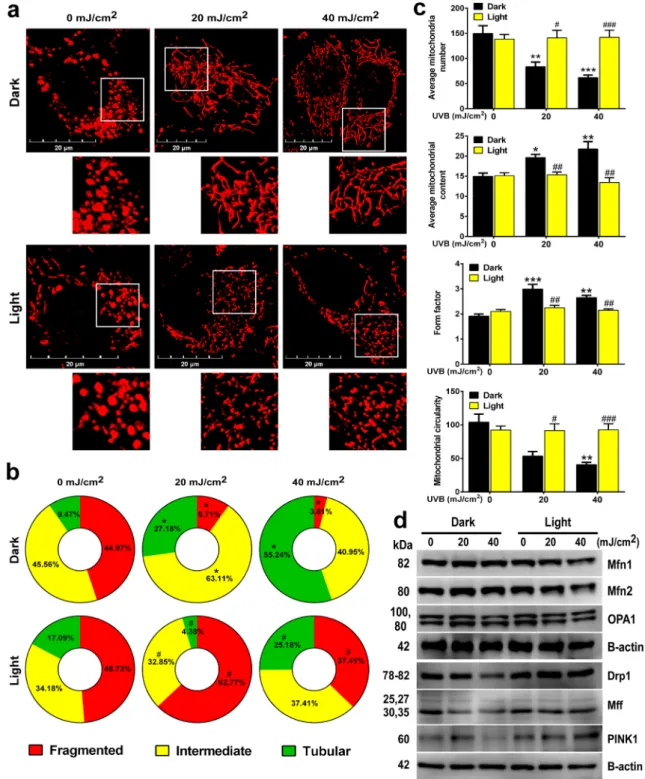
3.3. CPDs modulate mitochondrial biogenesis and substrate oxidation To explore CPD-elicited effects on mitochondrial function, mito- chondrial morphology was assessed. Cells were labeled with Mitotracker Red CMXRos and mitochondrial morphology was analyzed using confocal microscopy. UVB dose-dependently increased the proportions of cells with intermediate and tubular mitochondria (Fig. 3A–C), sug- gesting that UVB promoted the formation of an elongated, highly branched mitochondrial network. When CPDs were removed by pho- tolyase, mitochondrial morphology was left unchanged upon UVB Fig. 1. Photolyase activation prevents UVB-induced DNA damage and restores cell viability HaCaT keratinocytes (n =2 ×10⁵ cell) were treated with 20 or 40 mJ/
cm2 UVB, then cells were harvested. CPD formation from (a) genomic and (b) mitochondrial DNA was measured by CPD ELISA (n =3) after UVB exposure, as indicated. (c) Cell viability was assessed by Annexin V-Alexa-488 and Propidium iodide labeling (n =5) 24 after UVB exposure. (d) Cells were harvested 24 h post- irradiation and a clonogenic assay was performed (5000 cells/dish, n=4). (e) Cell cycle progression was assessed by Propidium Iodide incorporation (n =4) 24 after UVB exposure. - represents where photolyase is inactive, +represents where photolyase is active *; **, and *** indicate statistically significant differences at p <
0.05, p <0.01, and p <0.001 between dark non-irradiated and dark UVB-irradiated samples. #, ##, and ### indicate statistically significant differences at p <
0.05, p <0.01, and p <0.001 between dark and light (photoreactivated) samples. Data are presented as mean ±SEM. Significance was calculated using one-way ANOVA complemented by Sidak’s multiple comparisons post-hoc test.
C. Heged˝us et al.
exposure (Fig. 3A–C). Thus, UVB-induced alterations in mitochondrial morphology were CPD-dependent. Next, nuclear-coded proteins, responsible for regulating mitochondrial morphology were evaluated.
Proteins responsible for mitochondrial fusion, including mitofusin 1 (Mfn1), mitofusin 2 (Mfn2), and mitochondrial optic atrophy 1 (Opa1), were upregulated in response to UVB irradiation in a CPD-dependent fashion (Fig. 3D, Fig. S3) and likely drove UVB-induced mitochondrial fusion. In contrast, factors responsible for mitochondrial fission,
including mitochondrial fission factor (Mff), dynamin-related protein-1 (Drp1), and PTEN-induced protein kinase (PINK1), were downregulated in a CPD-dependent fashion (Fig. 3D, Fig. S3).
UVB-induced mitochondrial fusion was accompanied by mitochon- drial biogenesis, as evidenced by enhanced Mitotracker Green fluores- cence (Fig. 4A). In addition, the ratio of mitochondrial cytochrome C oxidase I (MTCO1) to nuclear succinate dehydrogenase complex subunit A (SDHA) proteins increased (Fig. 4B). The intensity of Mitotracker Red Fig. 2. CPD removal reprograms the cellular energy sensor system HaCaT keratinocytes (n =2 ×10⁵ cell) were treated with 20 or 40 mJ/cm2 UVB, then cells were harvested. (a) Total cellular NAD+content was determined by colorimetric assay 24 h post-UVB (n =3). (b) The time-course of PARP activity (PAR) was analyzed by Western blotting (n =3). Brightness and contrast were adjusted. Total PAR was normalized to the loading control β-actin. The uncut 10H blot is shown in Fig. S2a. (c) Expression levels of Sirtuin enzyme family members were analyzed by Western blotting 24 h post-UVB (n =4). Brightness and contrast were adjusted. Proteins of interest were normalized to the loading control β-actin. (d) The phosphorylation of ATM, AMPK, p53, AKT, and p70S6K1 was analyzed by Western blotting (n ≥3).
Brightness and contrast were adjusted. Proteins of interest were normalized to the loading control β-actin. *; **, and *** indicate statistically significant differences at p <0.05, p <0.01, and p <0.001 between dark non-irradiated and dark UVB-irradiated samples. #; ##, and ### indicate statistically significant differences at p <
0.05, p <0.01, and p <0.001 between dark and light (photoreactivated) samples. Data are presented as mean ±SEM. Significance was calculated using one-way ANOVA complemented by Sidak’s multiple comparisons post-hoc test. Densitometry is shown in Figs. S2B and c. In panel D, densitometry values were logarithmically transformed to achieve normal distribution for SIRT1 and SIRT5.
Redox Biology 38 (2021) 101808
Fig. 3. CPDs induce mitochondrial fusion in HaCaT keratinocytes (n =2 ×10⁵ cell) were treated with 20 or 40 mJ/cm2 UVB, then cells were harvested. (a) Cells were labeled with Mitotracker Red CMXRos dye after the indicated treatments. Representative confocal microscopic images are shown. (b) Mitochondrial morphological subtypes (tubular, intermediate, and fragmented) were quantified based on confocal microscopic images (a minimum of 100 cells were evaluated). (c) Mitochondrial parameters were quantified by ImageJ software (n =5). (d) The expression of Mfn1, Mfn2, and OPA1, which are responsible for mitochondrial fusion, were analyzed by Western blotting (n =4). The expression of Drp1, Mff, and PINK1, which are responsible for mitochondrial fission, were analyzed by Western blotting (n =2). Brightness and contrast were adjusted. Proteins of interest were normalized to the loading control β-actin. *; **, and *** indicate statistically significant differences at p <0.05, p <0.01, and p <0.001 between dark non-irradiated and dark UVB-irradiated samples. #; ##, and ### indicate statistically significant differences at p <0.05, p <0.01, and p <0.001 between dark and light (photoreactivated) samples. Data are presented as mean ±SEM. Significance was calculated using one-way ANOVA complemented by Sidak’s multiple comparisons post-hoc test. The frequency of mitochondrial morphological subtypes (frag- mented, intermediate, and tubular) was calculated using a chi2 test. Densitometry is shown in Fig. S3. (For interpretation of the references to color in this figure legend, the reader is referred to the Web version of this article.)
C. Heged˝us et al.
CMXRos fluorescence (Fig. 4C) also increased. These changes were abrogated by the enzymatic removal of CPDs (Fig. 4A–C).
As far as functional changes, UVB increased the extracellular acidi- fication rate, indicating glycolysis (Fig. 4D), citrate synthase activity (Fig. 4E) indicating Szent-Gy¨orgyi-Krebs cycle, and cellular basal oxy- gen consumption (Fig. 4F) indicating terminal oxidation. Thus, UVB may induce a hypermetabolic state in surviving cells via increased flux
of core catabolic pathways (glycolysis, the Szent-Gy¨orgyi-Krebs cycle, and terminal oxidation). The enzymatic removal of CPDs prevented UVB-induced metabolic changes (Fig. 4D–F). UVB also induced oligomycin-resistant respiration, a marker for mitochondrial uncou- pling, in a CPD-dependent fashion (Fig. 4G).
We assessed whether the flux of the catabolic pathways feeding mitochondrial oxidation changed in response to UVB irradiation. We Fig. 4. CPDs induce hypermetabolism For panels a to e 2 ×10⁵ HaCaT keratinocytes were treated with 20 or 40 mJ/cm2 UVB. From panels d, f-g 2 ×10⁴ HaCaT keratinocytes were treated with 20 or 40 mJ/cm2 UVB. Mitochondrial biogenesis was quantified using (a) Mitotracker Green labeling, representing mitochondrial mass (n =3) and (b) the ratio of MTCO1 and SDHA expression (n =4). (c) Mitochondrial membrane potential (n =3) was assessed by Mitotracker Red CMXRos incorporation. (d) Basal ECAR representing glycolysis, (f) basal OCR representing total oxidative phosphorylation, and (g) oligomycin-resistant respiration were measured using an XF96 instrument in XF medium supplemented with 10 mM glucose (n =3). (e) Citrate synthase activity, representing TCA cycle activity, was evaluated using a citrate synthase kit (n =4). *; **, and *** indicate statistically significant differences at p <0.05, p <0.01, and p <0.001 between dark non- irradiated and dark UVB-irradiated samples. #; ##, and ### indicate statistically significant differences at p <0.05, p <0.01, and p <0.001 between dark and light (photoreactivated) samples. Data are presented as mean ±SEM. Significance was calculated using one-way ANOVA complemented by Sidak’s multiple comparisons post-hoc test. In panel G, values were logarithmically transformed to achieve normal distribution. (For interpretation of the references to color in this figure legend, the reader is referred to the Web version of this article.)
Redox Biology 38 (2021) 101808
investigated three pathways that feed into the Szent-Gy¨orgyi-Krebs cycle, including pyruvate oxidation, fatty acid oxidation, and glutamine oxidation (Fig. S1). Glycolysis or lactate utilization yield pyruvate that is converted to acetyl-Coenzyme A, which can enter the Szent-Gy¨orgyi- Krebs cycle by combining with oxaloacetate yielding citric acid. Fatty acids are degraded to acetyl-Coenzyme A through beta oxidation. We
inhibited the mitochondrial availability of pyruvate and fatty acids by blocking their mitochondrial entry. Glutamine can be converted to α-ketoglutarate, which is a metabolite of the Szent-Gyorgyi-Krebs cycle. ¨ Inhibition of glutaminase activity blocks α-ketoglutarate biosynthesis.
The flux of these pathways maintains the physiological concentration of metabolites for the Szent-Gy¨orgyi-Krebs cycle. The inhibition of one or Fig. 5. CPDs modulate substrate oxidation profile From panels a to i 2 ×10⁴ HaCaT keratinocytes were treated with 40 mJ/cm2 UVB. From panel j, 2 ×10⁴ HaCaT keratinocytes were treated with 20 or 40 mJ/cm2 UVB. From panel k, 2 ×10⁵ HaCaT keratinocytes were treated with 20 or 40 mJ/cm2 UVB. (a–c) Pyruvate, (d–f) glutamine, and (g–i) fatty acid utilization were analyzed using a Mitofuel Flex test kit on the Seahorse XF96 instrument with the addition of BPTES, Etomoxir, and UK-5099 after 40 mJ/cm2 UVB dose (n =6). (j) Endogenous (BSA treatment) and exogenous (palmitate treatment) beta oxidation were measured using the XF96 instrument in FAO assay medium (n =4). (k) CPT1A, HADHA, and ACADM expression levels were assessed by Western blotting (n =3). Brightness and contrast were adjusted. Proteins of interest were normalized to the loading control β-actin. *; **, and *** indicate statistically significant differences at p <0.05, p <0.01, and p <
0.001 between dark non-irradiated and dark UVB-irradiated samples. #; ##, and ### indicate statistically significant differences at p <0.05, p <0.01, and p <
0.001 between dark and light (photoreactivated) samples. Data are presented as mean ±SEM. Significance was calculated using one-way ANOVA complemented by Sidak’s multiple comparisons post-hoc test. Densitometry is shown in Fig. S4.
C. Heged˝us et al.
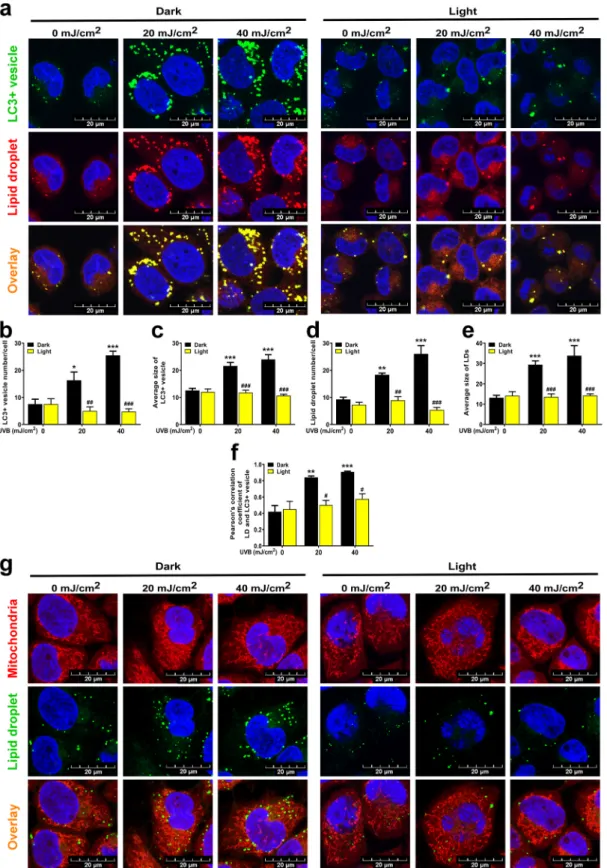
Fig. 6. UVB induces lipophagy in a CPD-dependent fashion HaCaT keratinocytes (n =2 ×10⁵ cells) were treated with 20 or 40 mJ/cm2 UVB, then cells were harvested. (a) Autophagy induction and lipid droplet (LD) formation were measured by punctate LC3A/B localization and Adipored accumulation on a confocal microscopy (n =3). Brightness and contrast were adjusted. (b) Number and (c) size of LC3+autophagosomes and (d) number and (e) size of LDs in cells from confocal images were quantified (n =3). (f) Autophagosome-LD co-localization was measured using JACOP plugin in ImageJ (n =3). HaCaT keratinocytes (n =2 × 10⁵ cells) were treated with 20 or 40 mJ/cm2 UVB, then cells were harvested. (g) Mitochondria were labeled using Mitotracker Red CMXRos and LDs were detected using Bodipy 493/503 dye. Brightness and contrast were adjusted. *; **, and *** indicate statistically significant differences at p <0.05, p <0.01, and p <0.001 between dark non-irradiated and dark UVB-irradiated samples. #; ##, and ### indicate statistically significant differences at p <0.05, p <0.01, and p <0.001 between dark and light (photoreactivated) samples and aaa indicates statistically significant differences at p <0.001 between dark vehicle and dark chloroquine- treated samples. Data are presented as mean ±SEM. Significance was calculated using one-way ANOVA complemented by Sidak’s multiple comparisons post-hoc test. (For interpretation of the references to color in this figure legend, the reader is referred to the Web version of this article.)
Redox Biology 38 (2021) 101808 two of these pathways leads to the compensatory upregulation of the non-inhibited pathways to complement the loss of the influx from the blocked pathways.
Metabolic substrate preference changed in a CPD-dependent fashion.
Removal of CPDs prevented UVB irradiation-induced pyruvate (Fig. 5A), glutamine (Fig. 5D), and fatty acid oxidation (Fig. 5G). In contrast, the substrate utilization rate (baseline flux) was not different in control cells versus cells depleted of CPDs (Fig. 5A, D, G). When compensating for the loss of complementary pathways (maximal output, Fig. 5B, E, H), UVB- irradiated cells were unable to further upregulate pyruvate, glutamine, or fatty acid oxidation. This effect was absent in photolyase-treated cells (Fig. 5E). Thus, UVB-treated cells had little or no spare capacity to enhance the oxidation of other substrates (negative values should be considered zero) (Fig. 5C, F, I). The loss of spare capacity is a sign of metabolic inflexibility. When cells were supplemented with palmitate, an oxidizable substrate for fatty acid oxidation, UVB-induced increases in fatty acid oxidation were enhanced; this effect was absent in cells in which photolyase eliminated CPDs (Fig. 5J). Accordingly, the protein expression of CPT1A, a fatty acid transporter, and HADHA and ACADM, two beta oxidation proteins, were induced upon UVB irradiation in a CPD-dependent fashion (Fig. 5K, Fig. S4).
3.4. UVB induces lipophagy in a CPD-dependent fashion
UVB induces autophagy [37]. Therefore, we assessed the CPD-dependence of autophagy induced by UVB. UVB-induced auto- phagy, marked by a higher number of LC3+vesicles, was abrogated upon removal of CPDs (Fig. 6A and B). Interestingly, the size of the LC3+ vesicles also increased upon UVB treatment (Fig. 6C).
Lipid droplets (LD) are important energy sources during nutrient deprivation or stress conditions. The breakdown or biogenesis of LDs can dynamically change according to environmental cues or metabolic needs [38]. In parallel with autophagy induction, we observed LD accumulation in the cytoplasm after UVB irradiation (Fig. 6A, D). The average size of LDs increased in response to UVB irradiation (Fig. 6E).
Depletion of CPDs prevented the increased LD number and size (Fig. 6A, D, E). The colocalization of LD with LC3+vesicles suggested that the LDs were undergoing autophagic degradation (Fig. 6A, F). We also interro- gated whether LDs co-localized with mitochondria. LDs did not co-localize with the mitochondria with or without UVB treatment (Fig. 6G, Fig. S5).
3.5. Hypermetabolic switch of keratinocytes upon UVB irradiation is due to CPD-dependent reactive oxygen species production
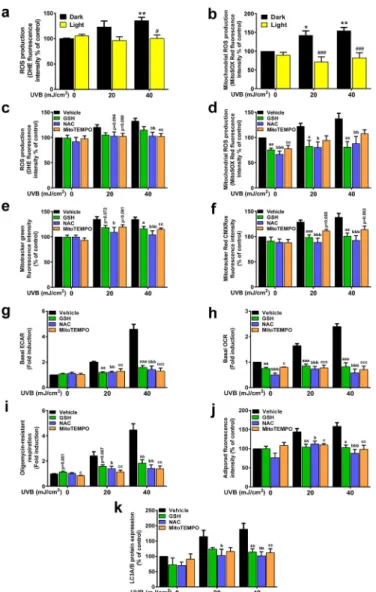
We detected increased CPD-dependent reactive species production in UVB-treated cells (Fig. 7A and B), similar to the observations of Wang and Kochevar [39]. UVB-induced reactive oxygen species (ROS) pro- duction was measured by DHE or MitoSOX Red. Increased ROS pro- duction was abolished when cells were treated with strong reductants, such as reduced glutathione (GSH), N-acetyl-cysteine (NAC), or a mitochondrial reactive species scavenger, MitoTEMPO (Fig. 7C and D), suggesting that reactive species production partially originated from the mitochondria. Other hallmarks of UVB-induced, CPD-dependent hy- permetabolic switches, such as MitoTracker Green fluorescence (marker for mitochondrial biogenesis, mitochondrial content) (Fig. 7E), Mito- Tracker Red CMXRos fluorescence (a readout of mitochondrial mem- brane potential) (Fig. 7F), induction of ECAR (Fig. 8G), and basal and oligomycin-resistant OCR (Fig. 7H and I) were abrogated upon GSH, NAC, and MitoTempo treatment. Similarly, lipid deposition and increased LC3 expression were also prevented by GSH, NAC, and MitoTempo treatment (Fig. 7J–K). Taken together, these data demon- strate that ROS, originating partially from the mitochondria, play a role in CPD-dependent compensatory reactions to UVB treatment.
Fig. 7.Compensatory effects after UVB irradiation are due to CPD-dependent reactive oxygen species production
From panels a to f and j to k 2 ×10⁵ HaCaT keratinocytes were treated with 20 or 40 mJ/cm2 UVB, then cells were harvested. From panel h to i, 2 ×10⁴ HaCaT keratinocytes were treated with 20 or 40 mJ/cm2 UVB, then cells were har- vested 24 h post-irradiation. In all cases, cells were pretreated with antioxidants for 2 h prior to UVB treatment and after the treatment, wells were refilled with medium containing antioxidants. (a) Total (n =5) and (b) mitochondrial ROS production (n = 4) were assessed by dihydroethidium and MitoSOX Red incorporation. (c) Total (n =9) and (d) mitochondrial ROS production (n =8), (e) mitochondrial biogenesis (n =7), (f) mitochondrial membrane potential (n
=7), (g) basal ECAR (n =3), (h) basal OCR (n =3), (i) oligomycin-sensitive respiration (n =3), (j) lipid droplet accumulation (n =7), and (k) LC3, as readouts of autophagy induction (n =6) were assessed as previously described after pretreatment with 5 mM GSH, 5 mM NAC and 10 μM MitoTEMPO. *; **, and *** indicate statistically significant differences at p <0.05, p <0.01, and p
<0.001 between dark non-irradiated and dark UVB-irradiated samples. #; ##, and ### indicate statistically significant differences at p <0.05, p <0.01, and p <0.001 between dark and light (photoreactivated) samples. a, aa, aaa, b, bb, bbb, and c, cc, ccc indicate statistically significant differences at p <0.05 p <
0.01, and p <0.001 between vehicle and ROS scavenger-treated samples. Data are presented as mean ± SEM. Significance was calculated using one-way ANOVA complemented by Sidak’s multiple comparisons post-hoc test. In panel I and J, values were logarithmically transformed to achieve normal dis- tribution. (For interpretation of the references to color in this figure legend, the reader is referred to the Web version of this article.)
C. Heged˝us et al.
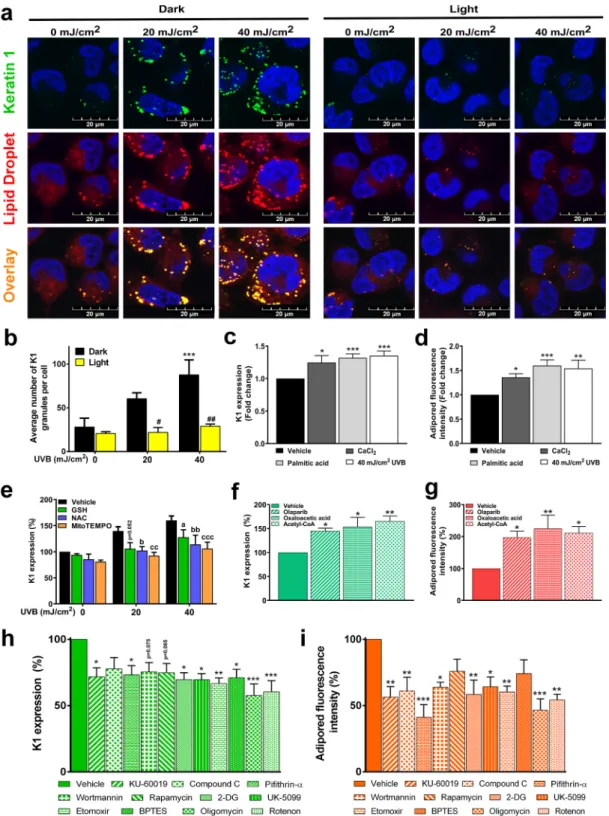
Fig. 8. UVB-induced lipid droplet biogenesis and keratinocyte differentiation are tightly interconnected and regulated by mitochondrial activity HaCaT keratinocytes (n =2 ×10⁵ cell) were treated with 20 or 40 mJ/cm2 UVB, then cells were harvested (panel a, b, e). HaCaT keratinocytes (n =2 ×10⁵ cell) were treated with 40 mJ/
cm2 UVB (panel f, g, h, i) then cells were harvested. Antioxidants (5 mM GSH, 5 mM NAC and 10 μM MitoTEMPO) were added to medium 2 h prior to UVB treatment and after the treatment, wells were refilled with medium containing the antioxidants. (a) Keratinocyte differentiation and lipid droplet formation were measured by Keratin 1 (K1) protein expression and Adipored accumulation using confocal microscopy. (b) Changes in the number of K1 granules was determined by ImageJ (n = 4). (c) K1 expression and (d) LD formation were determined by flow cytometry in response to CaCl2, palmitic acid treatment, and 40 mJ/cm2 UVB irradiation (n >5).
The effect of ROS scavengers on K1 expression was determined by flow cytometry (n =5). Analysis of K1 protein expression and LD content after 40 mJ/cm2 UVB exposure using flow cytometry after treatment with compounds that (f, g) support OXPHOS (n =4) or (h, i) agents that inhibit mitochondrial activity (n =6). *; **, and *** indicate statistically significant differences at p <0.05, p <0.01, and p <0.001 between vehicle and differently treated samples. a, aa, aaa, b, bb, bbb, and c, cc, ccc indicate statistically significant differences p <0.05 p <0.01, and p <0.001 between vehicle and ROS scavenger-treated samples. Data are presented as mean
±SEM. In panel B, E significance was calculated using one-way ANOVA complemented by Sidak’s multiple comparisons post-hoc test. In panel C, D, F, G, H, I significance was calculated using one-way ANOVA complemented by Dunnett’s post-hoc test.
Redox Biology 38 (2021) 101808
3.6. UVB-induced lipid droplet biogenesis and keratinocyte differentiation are tightly interconnected and regulated by mitochondrial activity
Finally, we assessed whether the UVB-induced changes have physi- ological relevance in keratinocyte differentiation using keratin 1 (K1) as a differentiation marker [40]. K1 expression was induced by the
application of calcium chloride, which induces keratinocyte differenti- ation [41], palmitic acid, which induces keratinocyte lipid accumulation [42], and UVB in the same dose as previous experiments (Fig. 8A–C).
These agents induced lipid accumulation in keratinocytes (Fig. 8A, D).
UVB-induced K1 expression was dependent on the production of reac- tive species; GSH, NAC, and MitoTempo reduced K1 expression Fig. 9.CPD and ROS-mediated mitochondrial changes upon UVB exposure are not cell type-specific For panels a to f and i to k n =2 ×10⁵ normal human epidermal keratinocytes (NHEK) keratinocytes were treated with a total dose of 20 or 40 mJ/cm2 UVB. From panel g to h and l to m n =2 ×10⁴ NHEK keratinocytes were treated with a total dose of 20 or 40 mJ/cm2 UVB. (a) Total ROS production was assessed by dihydroethidium incorporation (n =3). (b) Autophagy induction (n =4) and (c) lipid droplet (LD) formation were measured by LC3A/B and Adipored accumulation (n =4), respectively. (d) Mitochondrial mass was quantified by Mitotracker Green labeling (n =3). (e) Mitochondrial membrane potential (n =3) was assessed by Mitotracker Red CMXRos incorporation. (g) Basal ECAR rep- resenting glycolysis and (h) basal OCR representing total oxidative phosphorylation were measured by XF96 instrument in XF medium supplemented with 10 mM glucose (n =2). (i) Total ROS production (n =4), (j) mitochondrial membrane potential (n =5), (k) basal ECAR (n =3), and (l) basal OCR (n =3) were assessed as previously described upon 5 mM GSH, 5mM NAC, and 10 μM MitoTEMPO pretreatment. *; **, and *** indicate statistically significant difference at p <0.05, p <
0.01, and p <0.001 between dark non-irradiated and dark UVB-irradiated samples. #; ##, and ### indicate statistically significant difference at p <0.05, p <0.01, and p <0.001 between dark and light (photoreactivated) samples. a, aa, aaa, b, bb, bbb, and c, cc, ccc indicate statistically significant differences p <0.05 p <0.01, and p <0.001 between vehicle and ROS scavenger-treated samples. Data are presented as mean ±SEM, significance was calculated using one-way ANOVA com- plemented by Sidak’s multiple comparisons post-hoc test. In panels A and E, values were logarithmically transformed to achieve normal distribution. In panel D, I, K, and L, Box-Cox transformation was used to achieve normal distribution. (For interpretation of the references to color in this figure legend, the reader is referred to the Web version of this article.)
C. Heged˝us et al.
(Fig. 8E). In immunofluorescence studies, minimal K1 expression was detected in control keratinocytes. However, UVB irradiation upregu- lated K1 expression in a CPD-dependent manner (Fig. 8A).
Importantly, pharmacological inhibition of the CPD-modulated en- ergy-sensor enzymes (Fig. 2) impacted K1 expression and lipid accu- mulation. Olaparib, a PARP inhibitor, induced K1 expression and lipid accumulation, in agreement with its capacity to induce hypermetabo- lism [5,7] (Fig. 8F and G). Oxaloacetate and acetyl-CoA, which are anaplerotic substrates, also induced K1 expression and lipid accumula- tion (Fig. 8F and G). Furthermore, pharmacological inhibition of ATM by KU-60019, AMPK by Compound C, p53 by pifithrin-alpha-HBr, PI3K by wortmannin, and mTORC1 by Rapamycin all suppressed K1 expres- sion and lipid droplet accumulation (Fig. 8H and I). Similarly, phar- macological disruption of catabolism, including inhibition of glycolysis by 2-deoxy-glucose (2-DG), inhibition of mitochondrial pyruvate import by UK-5099, inhibition of fatty acid oxidation by etomoxir, inhibition of glutaminolysis by BPTES, inhibition of complex V by oligomycin, and inhibition of complex I by rotenone, all reduced K1 expression and lipid droplet accumulation (Fig. 8H and I). These data suggest that CPD for- mation and its downstream consequences, hypermetabolism and lipid accumulation, play a pivotal role in keratinocyte accommodation to UVB-induced differentiation. In other words, CPD-elicited effects have a physiological role in keratinocytes.
3.7. Normal human epidermal keratinocytes phenocopy UVB-irradiated HaCaT keratinocytes
HaCaT keratinocytes have mutations in p53 [43]. Therefore, we verified our observations in primary NHEK keratinocytes. UVB treat- ment induced mitochondrial biogenesis and mitochondrial oxidative metabolism in a CPD-dependent fashion in NHEK cells as marked by increases in mitochondrial mass (Fig. 9A) and mitochondrial membrane potential (Fig. 9B). As a consequence, UVB-irradiated NHEK cells became hypermetabolic, as evidenced by CPD-dependent increases in ECAR and OCR (Fig. 9C–D). In addition, reactive oxygen species pro- duction increased in a CPD-dependent fashion (Fig. 9E). CPD-dependent increases in adipored fluorescence (Fig. 9F) and LC3A/B protein expression (Fig. 9G) were also identified in UVB-treated NHEK cells, suggesting increases in lipophagy similar to HaCaT keratinocytes.
Finally, UVB-induced, CPD-dependent differentiation of NHEK cells, marked by increased expression of K1, was also found in NHEK cells (Fig. 9H).
In HaCaT cells, the above-detailed metabolic changes were depen- dent on mitochondrial reactive species production. Similar to HaCaT cells, UVB induced reactive species production in NHEK cells in a CPD- dependent fashion (Fig. 9E), which was inhibited by the application of GSH, NAC, and MitoTEMPO (Fig. 9I). The application of GSH, NAC, or MitoTEMPO reduced the CPD-dependent increases in mitochondrial membrane potential, ECAR, and OCR (Fig. 9J-L), indicating that NHEK cells phenocopy the UVB-induced, CPD-dependent changes we observed in HaCaT cells.
4. Discussion
In this study, we established the complex metabolic regulatory role of cyclobutane-pyrimidine dimers in mediating UVB effects. CPDs are the photoproducts of UVB. To study CPD-elicited effects, we applied a previously developed model system [44]. In this model, CPD-photolyase mRNA transfection in human keratinocytes was used to ectopically overexpress photolyase, a photoreactive enzyme that efficiently and rapidly removes CPDs [25,26]. Using this model, we compared UVB-irradiated control cells, in which photolyase was not activated, with UVB-irradiated and photoreactivated cells, in which photolyase is active. Hence, the effects of CPDs were revealed. We assessed only the surviving cells in our study; therefore, our findings reveal how cells compensate for UVB irradiation-induced damage.
As expected from previous studies [45–49], UVB irradiation led to CPD accumulation and induced cell cycle blockade and cell death. The detrimental effects of UVB were prevented by the rapid, photolyase-mediated removal of CPDs [29]. In cells surviving UVB irradiation, we observed a CPD-dependent decrease in NAD+levels and the induction of a set of proteins involved in the regulation of cellular oxidative metabolism, including sirtuins, ATM, p53, AMPK, mTORC1, and mTORC2. In fact, UVB was already shown to induce mTORC2 ac- tivity [50,51], but the CPD-dependence of mTORC2 and the other oxidative metabolism pathway enzymes were not previously demon- strated. The activation of this network of energy homeostasis sensors was translated into a functional hypermetabolic state in keratinocytes marked by an increased rate of glycolysis, Szent-Gy¨orgyi-Krebs cycle, and OXPHOS, as well as, mitochondrial fusion, which indicates high mitochondrial output [52]. Enhanced mitochondrial oxidation was fueled by pyruvate, fatty acid, and glutamine oxidation. These changes rendered cells surviving UVB irradiation metabolically inflexible, since their metabolic reserve decreased. Hypermetabolic metabolism is the opposite of hypometabolism, an underlying factor in UVB-induced tumorigenic transformation in skin tumor formation [53] or the Glut1-dependent glucose reliance found in psoriasis coupled with pro- liferation [54].
Along with lipid accumulation in keratinocytes, UVB irradiation- induced the formation of autophagic vesicles in a CPD-dependent fashion. LC3+vesicles and lipid droplets co-localized, suggesting lip- ophagy [55]. Autophagy is activated by DNA damage [56,57], including NER [58], and is PARP1-dependent [7,59]. Autophagy plays a pivotal role in facilitating repair processes by providing fuel and substrates for biosynthesis via the degradation of damaged cellular content. Along that same line, lipophagy may provide oxidizable substrates to cells [60,61].
The purpose of UVB-induced, CPD-dependent hypermetabolism may be to support the energy-intensive processes of DNA repair (e.g. chro- matin remodeling [62], enhanced NAD+ metabolism [5], and ATP dependent DNA repair factors [9]). In agreement with our results, UVC-induced DNA damage was shown to induce mitochondrial oxida- tive phosphorylation [2,3]. UVB induces mitochondrial metabolism, in a PARP1-dependent fashion [7], and increases glycogen content in the human epidermis [63]. Thus, there is a strong connection between metabolism and UV exposure. However, whether other UV-induced photoproducts, such as the 6-4 photoproducts, have metabolic effects is unclear. The 6-4 photoproducts can modulate the same protein factors as CPDs, such as ATR [64], and there are multiple connections between the DNA repair machinery and metabolic regulation [2,65]. Thus, our findings may be generalized to other UV-induced DNA damage-events;
nevertheless, conclusive studies are required.
Although UVA was shown to induce oxidative stress in prior studies [66,67], our current results link UVB to increased oxidative stress.
Herein, we provide evidence that UVB-induced compensatory events are dependent on the secondary production of reactive species, as strong reductants (GSH, NAC) attenuated these events. More importantly, MitoTEMPO, a reactive species scavenger specific to mitochondrial reactive species elimination, was as effective as the nonspecific GSH and NAC in preventing UVB-induced compensatory events. Mitochondria represent a good source for reactive species production [68]. Further- more, mitochondrial reactive species production is crucial for mito- chondrial biogenesis [69] and the induction of autophagy [70].
As far as the physiological relevance of these results, ultraviolet ra- diation (UVR) has multiple biological effects on the skin. UVR causes acute changes that result in erythema, inflammation, hyperalgesia, metabolic changes, and sunburn cell formation, as well as short-delayed consequences, including hyperpigmentation, epidermal hyperplasia, hyperkeratosis, immunosuppression, long-delayed photoaging, and carcinogenesis. Ultimately, UVR induces and drives melanoma and non- melanoma skin cancer growth [71–73]. Proliferating keratinocytes differentiate to stochastic stemlike cells and then commit to terminal differentiation to ultimately produce the cornified layer comprising the
Redox Biology 38 (2021) 101808
outmost barrier of the skin [41,74,75]. Keratinocyte differentiation is marked by the coordinated expression of differentiation markers (e.g.
keratin 1) [41,74] and the buildup of lipid droplets [42], which can be induced by external factors, such as CaCl2, palmitic acid, or UVB radi- ation. The role of UVB irradiation, mitochondrial ROS [76], and auto- phagy fueling mitochondrial metabolism [77] was demonstrated in keratinocyte differentiation. Here, we show that the CPD-dependent energy sensor network and the secondary ROS production play pivotal roles in keratinocyte differentiation after UVB exposure. Our results show that CPD-type DNA damage plays a signaling role via ROS pro- duction, supporting mitochondrial oxidative metabolism and promoting keratinocyte differentiation to remove cells with damaged DNA from the proliferating pool of cells. Hence, these changes assist in epidermal adaptation to UVB-induced genotoxic stress (Fig. 10). Moreover, ROS may play a paracrine role [78], coordinating the response of the whole skin to UVB irradiation. Finally, our results may explain the conflicting data on the applicability of antioxidants as protective agents against UVB-induced skin damage.
Declaration of competing interest
G.P. is a consultant for ADC Therapeutics and Buffalo Biolabs. Other authors declare no conflict of interest. The funders had no role in the design of the study, the collection, analyses, or interpretation of data, in the writing of the manuscript, or in the decision to publish the results.
Acknowledgments
We thank professor Katalin Karik´o (BioNTech RNA Pharmaceuticals, Mainz, Germany) for her support and for providing us the in vitro tran- scribed photolyase mRNA.
Appendix A. Supplementary data
Supplementary data to this article can be found online at https://doi.
org/10.1016/j.redox.2020.101808.
Funding
This work was supported by the European Union, the European Regional Development Fund, and the European Social Fund by the grants GINOP-2.3.2-15-2016-00005 (´ER), GINOP-2.3.2-15-2016-00006 (PB), EFOP-3.6.2-16-2017-00006 (KU), and TAMOP 4.2.4.A/2-11-1- ´ 2012-0001 “National Excellence Program” (JT). Furthermore, our research was supported by grants from NKFIH K120206 (ER), K120669 ´ (KU) NKFIH K123975 (PB), Momentum program (PB), Szodoray Lajos and Magyary Zolt´an Funds of the Hungarian Academy of Sciences, the OTKA Bridging Fund from the University of Debrecen. The research was financed by the Higher Education Institutional Excellence Programme
(NKFIH-1150-6/2019) of the Ministry of Innovation and Technology in Hungary, within the framework of the Biotechnology thematic program of the University of Debrecen.
Availability of data and material
All primary data is uploaded to Figshare at https://figshare.
com/s/9dc6391cb8085b0e5dcc (https://doi.org/10.6084/m9.figshare .12608465).
Author contributions
Conceptualization: P´eter Bai, Eva Remenyik, Csaba Heged´ ˝us; Meth- odology: Csaba Heged˝us, Tam´as Juh´asz, Eszter Fidrus; Formal analysis and investigation: Eszter Anna Janka; Writing - original draft prepara- tion: Csaba Hegedus; Writing/review and editing: G˝ ´abor Boros, Gabri- ella Emri, ´Eva Remenyik, P´eter Bai, Gyorgy Paragh, Tam¨ ´as Juh´asz, G´abor Juh´asz, Karen Uray; Funding acquisition: ´Eva Remenyik; Re- sources: ´Eva Remenyik, P´eter Bai, Tam´as Juh´asz; Supervision: Eva ´ Remenyik.
Consent for publication
All authors have read and agreed to the published version of the manuscript.
References
[1] A. Kaniak-Golik, A. Skoneczna, Mitochondria–nucleus network for genome stability, Free Radic. Biol. Med. 82 (2015) 73–104.
[2] L.E. Brace, S.C. Vose, K. Stanya, R.M. Gathungu, V.R. Marur, A. Longchamp, H. Trevi˜no-Villarreal, P. Mejia, D. Vargas, K. Inouye, et al., Increased oxidative phosphorylation in response to acute and chronic DNA damage, NPJ aging and mechanisms of disease 2 (2016) 16022. -16022.
[3] D. Tondera, S. Grandemange, A. Jourdain, M. Karbowski, Y. Mattenberger, S. Herzig, S. Da Cruz, P. Clerc, I. Raschke, C. Merkwirth, et al., SLP-2 is required for stress-induced mitochondrial hyperfusion, EMBO J. 28 (2009) 1589–1600.
[4] L. Qin, M. Fan, D. Candas, G. Jiang, S. Papadopoulos, L. Tian, G. Woloschak, D.
J. Grdina, J.J. Li, CDK1 enhances mitochondrial bioenergetics for radiation- induced DNA repair, Cell Rep. 13 (2015) 2056–2063.
[5] P. Bai, L. Nagy, T. Fodor, L. Liaudet, P. Pacher, Poly(ADP-ribose) polymerases as modulators of mitochondrial activity, Trends Endocrinol. Metabol. 26 (2015) 75–83.
[6] T.M. Dawson, V.L. Dawson, Mitochondrial mechanisms of neuronal cell death:
potential Therapeutics, Annu. Rev. Pharmacol. Toxicol. 57 (2017) 437–454.
[7] C. Hegedus, G. Boros, E. Fidrus, N.G. Kis, M. Antal, T. Juh˝ ´asz, A.E. Janka, L. Jank´o, G. Paragh, G. Emri, et al., PARP1 inhibition augments UVB-mediated
mitochondrial changes—implications for UV-induced DNA repair and photocarcinogenesis, Cancers 12 (2019).
[8] A. Murley, J. Nunnari, The emerging network of mitochondria-organelle contacts, Mol. Cell. 61 (2016) 648–653.
[9] N.B. Fakouri, Y. Hou, T.G. Demarest, L.S. Christiansen, M.N. Okur, J.G. Mohanty, D.L. Croteau, V.A. Bohr, Toward understanding genomic instability, mitochondrial dysfunction and aging, FEBS J. 286 (2019) 1058–1073.
[10] T. Shimura, M. Sasatani, K. Kamiya, H. Kawai, Y. Inaba, N. Kunugita, Mitochondrial reactive oxygen species perturb AKT/cyclin D1 cell cycle signaling via oxidative inactivation of PP2A in lowdose irradiated human fibroblasts, Oncotarget 7 (2016) 3559–3570.
[11] C.L. Navarro, P. Cau, N. L´evy, Molecular bases of progeroid syndromes, Hum. Mol.
Genet. 15 Spec (2) (2006) R151–R161.
[12] A. Rocchi, C. He, Emerging roles of autophagy in metabolism and metabolic disorders, Front. Biol. 10 (2015) 154–164.
[13] A.G. Eliopoulos, S. Havaki, V.G. Gorgoulis, DNA damage response and autophagy:
a meaningful partnership, Front. Genet. 7 (2016), 204-204.
[14] S.D. Desai, R.E. Reed, S. Babu, E.A. Lorio, ISG15 deregulates autophagy in genotoxin-treated ataxia telangiectasia cells, J. Biol. Chem. 288 (2013) 2388–2402.
[15] M. Scheibye-Knudsen, M. Ramamoorthy, P. Sykora, S. Maynard, P.C. Lin, R.
K. Minor, D.M. Wilson 3rd, M. Cooper, R. Spencer, R. de Cabo, et al., Cockayne syndrome group B protein prevents the accumulation of damaged mitochondria by promoting mitochondrial autophagy, J. Exp. Med. 209 (2012) 855–869.
[16] R. Ge, L. Liu, W. Dai, W. Zhang, Y. Yang, H. Wang, Q. Shi, S. Guo, X. Yi, G. Wang, et al., Xeroderma Pigmentosum group A promotes autophagy to facilitate cisplatin resistance in melanoma cells through the activation of PARP1, J. Invest. Dermatol.
136 (2016) 1219–1228.
[17] C. Bo-Htay, T. Shwe, L. Higgins, S. Palee, K. Shinlapawittayatorn, S.
C. Chattipakorn, N. Chattipakorn, Aging induced by D-galactose aggravates cardiac Fig. 10. UVB induces free radical production and compensatory hypermetab-
olism in a CPD-dependent fashion.
C. Heged˝us et al.