High glucose-induced hyperosmolarity impacts proliferation,
cytoskeleton remodeling and migration of human induced pluripotent stem cells via aquaporin-1
Rosalinda Madonna
a,c, Yong-Jian Geng
a,b, Harnath Shelat
a, Peter Ferdinandy
d,e, Raffaele De Caterina
c,⁎
aHeart Failure Research, Texas Heart Institute at St. Luke's Episcopal Hospital, Houston, TX, USA
bDepartment of Internal Medicine, Division of Cardiology, The University of Texas Health Science Center at Houston, Houston, TX, USA
cInstitute of Cardiology, Department of Neuroscience and Imaging,“G. d'Annunzio”University, Chieti, Italy
dPharmahungary Group, Szeged, Hungary
eDepartment of Pharmacology and Pharmacotherapy, Semmelweis University, Budapest, Hungary
a b s t r a c t a r t i c l e i n f o
Article history:
Received 3 May 2014
Received in revised form 9 July 2014 Accepted 30 July 2014
Available online 7 August 2014
Keywords:
Induced pluripotent stem cell Aquaporin-1
Cytoskeleton remodeling Hyperosmolarity Diabetes Hyperglycemia
Background and objective: Hyperglycemia leads to adaptive cell responses in part due to hyperosmolarity. In en- dothelial and epithelial cells, hyperosmolarity induces aquaporin-1 (AQP1) which plays a role in cytoskeletal re- modeling, cell proliferation and migration. Whether such impairments also occur in human induced pluripotent stem cells (iPS) is not known. We therefore investigated whether high glucose-induced hyperosmolarity impacts proliferation, migration, expression of pluripotency markers and actin skeleton remodeling in iPS cells in an AQP1-dependent manner. Methods and results: Human iPS cells were generated from skinfibroblasts by lentiviral transduction of four reprogramming factors (Oct4, Sox2, Klf4, c-Myc). After reprogramming, iPS cells were characterized by their adaptive responses to high glucose-induced hyperosmolarity by incubation with 5.5 mmol/L glucose, high glucose (HG) at 30.5 mM, or with the hyperosmolar control mannitol (HM). Exposure to either HG or HM increased the expression of AQP1. AQP1 co-immunoprecipitated withβ-catenin. HG and HM induced the expression ofβ-catenin. Under these conditions, iPS cells showed increased ratios of F-actin to G- actin and formed increased tubing networks. Inhibition of AQP1 with small interfering RNA (siRNA) reverted the inducing effects of HG and HM. Conclusions: High glucose enhances human iPS cell proliferation and cyto- skeletal remodeling due to hyperosmolarity-induced upregulation of AQP1.
© 2014 Elsevier B.V. All rights reserved.
1. Introduction
Transplantation of stem cells is emerging as a promising strategy for the repair and regeneration of damaged organs or tissues, including those in the cardiovascular system[1]. However, major limitations re- main for the use of adult stem cells harvested from essential organs, in- cluding the paucity, immunogenicity and low potency of adult stem cells. Advances in stem cell biology have recently offered new opportu- nities for regenerative therapies, enabling the generation of induced pluripotent stem (iPS) cells[2,3]or even induced cardiomyocytes[4]
from somatic cells of readily obtainable human tissue source. However an issue has been raised on a potentially lower yield of iPS cells obtained from patients in need of them, because disease or aging may render the reprogramming process of iPS cells from somatic cells less efficient, par- ticularly when the original stem cell preparation is of poor quality[5–9].
It is therefore of importance to determine whether and to what extent pathophysiological conditions, such as those occurring in diabetes, im- pair iPS cells, or create a microenvironment harmful or hostile for the subsequent iPS cell implantation. Recent studies have indeed docu- mented that biophysical factors, including hyperosmolarity, as occur- ring in diabetic hyperglycemia, may represent important regulatory elements influencing stem cell fate, both in physiological and patholog- ical conditions[10–13]. In the diabetic setting, hyperglycemia has been indeed shown to be involved in the control of stem and progenitor cell fate and cell reprogramming[14–18].
In addition to being a macronutrient and a metabolic regulator, glucose is an osmotically active molecule. While the effects of hyperosmolarity have been extensively studied in adult cultured cells, demonstrating changes in cell shape, nutrient transport, proliferation and growth[19–23], nothing is known on its effects on the properties and fate of iPS cells in in vitro conditions mimicking diabetes.
Against this background, we therefore hypothesized that disease- related changes may affect the somatic reprogramming of iPS cells. Con- sequently, we aimed at specifically investigating the cellular response of iPS cells to high glucose-induced hyperosmolarity, pursuing an analysis
⁎ Corresponding author at: Institute of Cardiology,“G. d'Annunzio”University—Chieti, C/o Ospedale SS. Annunziata, Via dei Vestini, 66013 Chieti, Italy. Tel.: +39 0871 41512;
fax: +39 0871 553 461.
E-mail address:rdecater@unich.it(R. De Caterina).
http://dx.doi.org/10.1016/j.bbadis.2014.07.030 0925-4439/© 2014 Elsevier B.V. All rights reserved.
Contents lists available atScienceDirect
Biochimica et Biophysica Acta
j o u r n a l h o m e p a g e : w w w . e l s e v i e r . c o m / l o c a t e / b b a d i s
of iPS cell growth, migration, actin skeleton remodeling and expres- sion of pluripotency markers in response to one biophysical condi- tion—increased osmolarity—mimicking that occurring in diabetic hyperglycemia.
2. Materials and methods 2.1. Reagents
D-Glucose,D-mannitol (devoid of metabolic activities and used as a purely hyperosmolar control), and all other chemicals were purchased from Sigma-Aldrich (St. Louis, MO, USA), unless otherwise specified.
2.2. iPS cell generation
Human foreskinfibroblasts [purchased from American Type Culture Collection (ATCC, Manassas, VA, USA)] were used to establish human iPS cells. Lentiviral vectors expressing 4 reprogramming transcription factors—octamer-binding transcription factor (OCT)-4, sex determining region Y (SRY)-box 2 (SOX2), Kruppel-like factor (KLF)-4, and c-MYC— and greenfluorescence protein (GFP) as a reporter gene under the con- trol of the human elongation factor-1 alpha promoter (EF1μ) were pur- chased from Open Biosystems (ThermoFisher Scientific, Huntsville, AL, USA). Fibroblasts were seeded at 1.5 × 10⁴cells/cm2in 24-well plates in Eagle's Minimum Essential Medium (MEM) supplemented with 10%
fetal bovine serum (FBS). At 30–40% confluence, cells were transduced with equal amounts of particles (at multiplicity of infection (MOI) of 1:10) of the lentiviral vectors encoding the four transcription factors (av- erage titer: 5 × 10⁸transducing units (TU)/mL), for a total MOI of 40 de- livered to target cells. Cells were then maintained in embryonic stem cell (ES)-specific medium (from Stem Cell Biotechnology, Vancouver, Canada). Following 2 to 3 weeks of culture in enriched natural seawater
(ES) medium, compact ES-like colonies emerged among a background of fibroblasts, and colonies with ES cell morphology were manually picked and transferred to new dishes for further experiments (online Supple- ment Fig. 1). The iPS cell lines were confirmed by teratoma formation assay and for the positivity of OCT-4, SOX2, KLF-4 and Nanog by immu- noblotting. More than three reprogramming experiments were per- formed and at least three clones for each experiment were analyzed.
The iPS cells were stored in liquid nitrogen until further experiments.
2.3. Experimental design
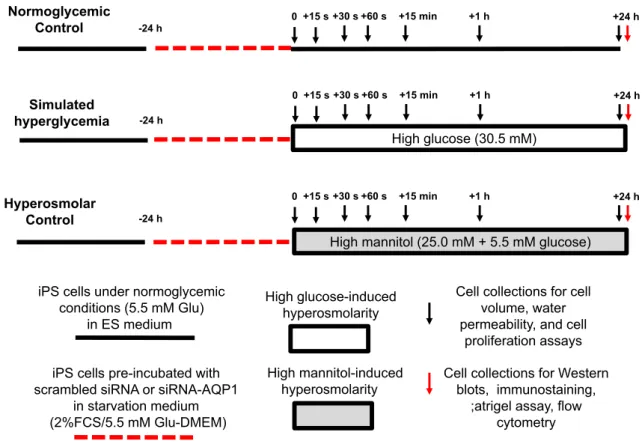
Human iPS cells were characterized for their adaptive responses to high glucose- and high mannitol-induced hyperosmolarity for up to 24 h (Fig. 1). After thawing, the iPS cells were let to recover by plating them in ES-specific medium. After reaching 70% confluency, cells were synchronized to be in the same cell-cycle phase by starvation in low- glucose (5.5 mM) Dulbecco's Modified Eagle Medium (DMEM) contain- ing 2% fetal calf serum (FCS) for 24 h. After synchronization, iPS cells were separated into 5 groups and incubated with control glucose con- centration (5.5 mM, control), high glucose (HG, 30.5 mM, respectively), or high mannitol (HM, 5.5 mM glucose + 25 mM mannitol, respective- ly) up to 24 h in separate experiments, respectively (Fig. 1). After os- motic stress conditions, cells from all the 3 groups were collected for in vitro assays as follows. Cell size, water permeability and cell prolifer- ation were monitored at different time points (0–15–30–60 s, 15 min, and 1 and 24 h), while protein expression of different targets (KLF-4, SOX-2, Nanog, OCT, GAPDH, G-actin, F-actin, AQP1,β-catenin) as well asflow-cytometry analyses of AQP1 expression (online Supplement Figs. 2 and 3), migration assays in Matrigel and visualization of the F- actin cytoskeleton were assessed after 24 h. In some preliminary exper- iments, cell volume was also measured at different osmotic environ- ments (HG at 17.5, 50.5, 105.5 and 185.5 mM and corresponding HM
iPS cells pre-incubated with scrambled siRNA or siRNA-AQP1
in starvation medium (2%FCS/5.5 mM Glu-DMEM)
High glucose-induced hyperosmolarity
High mannitol-induced hyperosmolarity iPS cells under normoglycemic
conditions (5.5 mM Glu) in ES medium
Cell collections for cell volume, water permeability, and cell
proliferation assays Cell collections for Western
blots, immunostaining,
;atrigel assay, flow cytometry
-24 h
0+15 s +30 s +60 s +15 min +1 h +24 h
Normoglycemic Control
Hyperosmolar Control
High mannitol (25.0 mM + 5.5 mM glucose)
-24 h
0 +15 s +30 s +60 s +15 min +1 h +24 h
Simulated hyperglycemia
HHigh glucose (30.5 mM)
-24 h
0+15 s +30 s +60 s +15 min +1 h +24 h
Fig. 1.Experimental protocol of high glucose-induced hyperosmolarity in induced pluripotent stem cells. Legend: h, hour; s, second; iPS cells, induced pluripotent stem cells; Glu, glucose;
siRNA, silencing RNA; AQP, aquaporin; DMEM, Dulbecco's Modified Eagle Medium; FCS, fetal calf serum, ES medium, and embryonic stem cell-specific medium.
concentrations). During the 24 h incubation period, cells were main- tained in OptiMem reduced serum medium (Invitrogen) to avoid the cell detachment and death due to starvation. Basal DMEM or OptiMem media have an inorganic salt concentration of 120 mM, a glucose (or mannitol) concentration of 5.5 mM, and an osmolality in the range of 322–374 mOsm/kg of H2O. After osmotic stress and control conditions, cell viability was assessed by cell morphology and cell count using phase-contrast microscopy, Trypan blue exclusion and total protein con- tent. Cell proliferation was assessed by determining the GFP-positive cells using a POLARstar OPTIMA plate reader (BMG Labtechnologies, Offenburg, Germany). Greenfluorescence emission with an emission peak of 523 nm was detected. Cell size was assessed using a Multisizer
™3 Coulter counter equipped with a Channelyzer (Beckman Coulter, Miami, FL, USA). The number of GFP-positive cells was assessed using a FACSCaliburflow cytometer (BD Biosciences, CA, USA).
2.4. Fluorescence-activated cell sorting (FACS) analysis of reprogrammed cells
Dissociated ES-like colonies were plated in serum-starved in low glu- cose DMEM containing 2% FCS for 24 h, and then incubated with control glucose (5.5 mM, control), high glucose (HG, 30.5 mM), or high mannitol (HM, 5.5 mM glucose + 25 mM mannitol) for 24 h. To quantify the num- ber of GFP-positive cells and AQP1-positive cells, after incubation, iPS cells were incubated with the AQP1 primary antibody (Santa Cruz) followed by secondary antibody (anti-mouse IgG + the PerCP–CY5 fluorophore), then sorted using FACS (FACSCaliburflow cytometer, Becton Dickinson, BD). See online Supplement for further details.
2.5. Transfection of AQP1 siRNA
A pool of three different small interfering RNA (siRNA) oligonucleo- tides against AQP1 conjugated with cyan (Cy)-5 or scrambled control siRNAs were obtained from Ambion (Invitrogen). Cells (2 × 10⁵/well) were plated on 6-well plates in low-serum medium without antibiotics (OptiMem) and incubated with 6μL of siRNA transfection reagent mixed with siRNAs (60μmol/L) up to a total volume of 800μL transfec- tion medium. After 24 h, a fresh medium was added with or without glucose or mannitol (5.5 or 30.5 mM) and incubated for an additional 24 h; cells were then harvested using ethylenediaminetetraacetic acid (EDTA)/phosphate buffered saline (PBS) without trypsin, and proteins were extracted for further experiments.
2.6. Migration assays
Migration assays were performed with Matrigel in 96-well plates (BD Biosciences, San Jose, CA, USA), allowing the formation of both tubules and a vascular-like network. Before the assay, human controlfi- broblasts or human iPS cells were grown for 24 h in endothelial basal medium (EBM, BD Biosciences) without endothelial growth factors, supplemented with 2.5% FBS and control concentrations of glucose (5.5 mM, control), and then shifted to the same medium with either control glucose (5.5 mM, control), high glucose (30.5 mM) or high man- nitol (5.5 mM glucose + 25 mM mannitol, or with siRNA to AQP1) and plated on Matrigel (at a density of 2 × 10⁵cells/50μL of Matrigel) for further 24 h. Images were acquired in Normaski mode with red and green channels using a 10 × objective on an immunofluorescence mi- croscope (Leica, Wetzlar, Germany), and pictures were taken by an at- tached digital output Olympus camera. Several tube formation indices (tube areas, tube length, and tube number) were quantified using the National Institutes of Health (NIH) Image software (version 1.62).
2.7. Immunoprecipitation and immunoblotting
Total proteins were isolated in ice-cold radioimmunoprecipitation (RIPA) buffer [24]. Proteins were separated under reducing
conditions and electroblotted onto polyvinylidenefluoride mem- branes (Immobilon-P; Millipore, Bedford, MA, USA). After blocking, the membranes were incubated overnight at 4 °C with the following primary antibodies: (1) AQP1 (Santa Cruz), (2) β-actin (Sigma), (3)β-catenin (Cell Signaling, Billerica, MA, USA), (4) KLF-4 (Cell Signal- ing), (5) Sox-2 (Cell Signaling), (6) Nanog (Cell Signaling), and (7) OCT- 4 (Cell Signaling). Equal loading/equal protein transfers were verified by stripping and re-probing each blot with an anti-GAPDH antibody.
For immunoprecipitation, cell lysates were mixed with the monoclonal mouse anti-AQP1 antibody and the immunocomplexes were pulled down with protein-A/G beads (Santa Cruz). The immunoprecipitants were then eluted, concentrated and subjected to immunoblotting for AQP orβ-catenin.
2.8. Fluorescence-quenching assay
Afluorescence quenching assay was performed according to a previ- ously published protocol[25]. Here, iPS cells were seeded on black, clear-bottomed plates (Corning), grown for 2 days at 37 °C, 5% CO2
and 95% relative humidity, and loaded with calcein-AM ester (BD Biosci- ences). Before loading the cells with the calcein-AM ester in assay buffer (0.8 mM MgSO4, 5 mM KCl, 1.8 mM CaCl2, 25 mM Na-HEPES, pH adjust- ed to 7.4 with HCl), the growth medium was exchanged with the fresh medium for 1 h. All assay plates were washed with a fresh assay buffer, and then treated with the osmolytes (glucose or mannitol) ranging in concentrations between 5.5 and 30.5 mM. Calceinfluorescence was re- corded on a Fluostar Optima plate reader (BMG LABTECH, Ortenberg, Germany) equipped with a 495-nm band-passfilter for excitation and a 520-nm long-passfilter for emission. Osmotic gradients were applied 5 s after the beginning of each baseline reading through the instrument.
Dynamic changes influorescence intensity were recorded for an addi- tional 15, 30 and 60 s, 15 min, 1 and 24 h.
2.9. Visualization of the F-actin cytoskeleton
F-actin incorporated into the cytoskeleton was visualized in iPS cells grown on cover slips, after permeabilization and incubation with phalloidin (rhodamine). iPS cells were grown on cover slips at a density of 30,000 cells per cover slip. After stimulation with an isotonic solution (105 mM NaCl, 6 mM KCl, 1 mM MgCl2, 1.5 mM CaCl2, 10 mM HEPES, 5.5 mM glucose, adjusted to pH 7.4 with NaOH) or a hypertonic solution (105 mM NaCl, 6 mM KCl, 1 mM MgCl2, 1.5 mM CaCl2, 10 mM HEPES, 30.5 mM glucose or 5.5 mM glucose/25 mM mannitol, adjusted to pH 7.4 with NaOH) for 24 h, cells werefixed in 3.7% fresh formaldehyde for 15 min at room temperature, washed twice, and permeabilized in 0.2% Triton X-100. After permeabilization, cells were incubated in 14μM phalloidin (rhodamine) (Acti-stain 535, 1:100 dilution, purchased from Cytoskeleton Inc, Denver, CO, USA) for 40 min at room temperature.
Stained samples were treated with Vectashield/DAPI mounting medium forfluorescence to retard photobleaching. All incubation and washing steps were performed in TRIS-buffer (TBS, 10 mM Tris–HCl, pH 7.3, 150 mM NaCl, 1 mM MgCl2and 1 mM EGTA) at room temperature.
2.10. Measurement of monomeric and polymeric F- and G-actin
Quantitation of the ratio of F-actin incorporated into the cytoskeleton to G-actin found in the cytosol was performed using a G-actin/F-actin assay kit (Cytoskeleton Inc, Denver, CO, USA) according to the manufacturer's instructions. In brief, iPS cells were homogenized in an F-actin stabilization buffer, and then centrifuged to separate the F-actin from the G-actin pool. The fractions were separated by sodium dodecyl sulfate-polyacrylamide gel electrophoresis (SDS-PAGE), and actin was quantified using Western blotting.
2.11. Statistical analysis
Two-group comparisons were performed using the Student'st-test for unpaired values. Multiple-group comparisons were made using analysis of variance (ANOVA), and the existence of individual differ- ences, in case of significant F-values at ANOVA, tested by Scheffé's mul- tiple contrasts. A P-value of less than 0.05 was considered significant.
3. Results
3.1. High glucose-induced hyperosmolarity impacts cell size and water permeability of human induced pluripotent stem cells
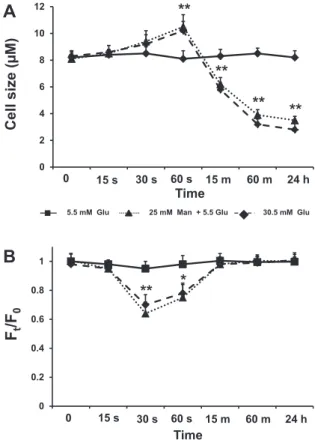
We tested the effect of hyperosmolarity on iPS cell size by incubating iPS cells with high glucose (HG) and high mannitol (HM), the latter de- void of glucose metabolic effects but increasing extracellular osmolarity to the same extent as high glucose. Cell size (as measured by diameter) changes in iPS cells in response to changes in extracellular osmolarity were assessed in suspended cells using a Coulter counter. Cell size mea- surements as shown inFig. 2A were recorded at different time points (0–15–30–60 s, at 15 min, at 1 and 24 h) after exposure to a
hyperosmolar medium by the addition of HG or HM (30.5 mM), and 60 s after a shift in extracellular osmolarity from iso-osmotic concentrations (5.5 mM) to a range of concentration with higher osmolarities (from 12.5 to 185.5 mM) (online Supplement Fig. 4A and B). Increasing osmolarity with HG or HM up to 30.5 mmol/L for 60 s caused a significant increase in cell size, while further increases in osmolarity decreased cell size (on- line Supplement Fig. 4A and B). No significant changes in cell size were recorded after 15 s and 30 s loading HG (30.5 mM glucose) or HM (5.5 mM glucose + 25 mM mannitol), while stable cell shrinking was ob- served after 15 min, 1 and 24 h (Fig. 2A).
To further analyze the effects of hyperosmolarity on iPS cells in terms of water permeability, we implemented a functional assay based upon calceinfluorescence quenching, a well-established method for the measurement of rapid osmosis in monolayers of cultured cells [26]. Cultured cells in the 96-well format were loaded with calcein- AM, a membrane-permeable calcein derivative that is cleaved intracel- lularly by esterases to become trapped in the cytoplasm. The functional assay of iPS cells was performed in afluorimetric plate reader as de- scribed in theMaterials and methodssection. Cells were rinsed in 50μL of isosmolar PBS. The extent offluorescence change (expression of the movement of calcein from inside to outside of the cell through os- motic gradients) was determined using the ratio betweenfluorescence before (Ft) and after (F0) a change in the extracellular osmolyte (glucose or mannitol) concentrations (Fig. 2B). Cell volume and permeability changes in response to osmotic gradients can be rapid if facilitators of water permeability, such as AQP1, are present[27]. Following very short incubations (15, 30 and 60 s), calcein quenching in response to osmolytes became clearly visible. After 60 s,fluorescence intensity ap- peared to be at equilibrium, and we did not observe any furtherfluores- cence intensity changes up to 15 min that could indicate changes in cellular osmolyte permeability (Fig. 2B). We tested the response of iPS cells to the addition of osmotic shifts from isosmotic (5.5 mM) to afinal extracellular osmolarity of 30.5 mM. We observed significant differences after loading HG (30.5 mM glucose) or HM (5.5 mM glucose + 25 mM mannitol) for 30 s (pb0.01) and 60 s (pb0.05) (Fig. 2B). Thus, iPS cells appear osmotically sensitive because they are able to sense and respond to hyperosmolarity by changing their size and water permeability.
3.2. High glucose but not high mannitol drives the expression of pluripotency markers in human induced pluripotent stem cells
To investigate whether environmental cues such as high glucose- induced hyperosmolarity impact the expression of pluripotency markers of iPS cells, we determined the differences in expression of KLF-4, Sox-2, Nanog and OCT-4 among experimental conditions tested (Fig. 3). Twenty-four hour exposure to HG (30.5 mM)—but not HM (5.5 mM glucose + 25 mM mannitol)—changed protein expression of KLF-4 with a 2.8-fold increase, with 1.5 increase of OCT-4, and a near-doubling of Nanog and SOX-2, as determined by Western analysis (Fig. 3). Thus, hyperosmolarity per se does not appear to impact markers of the pluripotency potential of iPS cells. In parallel experi- ments, cells were also incubated with sodium chloride and saccharose at equimolar concentrations, as further osmotic control, and similar re- sults were obtained.
3.3. High glucose induces cell proliferation of human induced pluripotent stem cells through a hyperosmolar mechanism
To evaluate whether increased levels of pluripotency markers trans- late into increased cell proliferation, differences in cell numbers be- tween the different conditions were determined. Data reported in Fig. 4were obtained by analyzing the expression of the greenfluores- cence protein (GFP) reporter gene in iPS cells after 1 h and 24 h expo- sures to a hyperosmolar medium by the addition of glucose or mannitol (30.5 mM). As shown inFig. 4A and B, the rate of cell
F
t/F
00 15 s 30 s Time
0 0.2 0.4 0.6 0.8 1
60 s 15 m 60 m 24 h
25 mM Man + 5.5 Glu
5.5 mM Glu 30.5 mM Glu
** *
15 s 0
2 4 6 8 10 12
** **
**
**
0 30 s 60 s 15 m 60 m 24 h
Cell size (µM)
Time
A
B
Fig. 2.Time-course of changes in cell size and water permeability in human induced plu- ripotent stem cells exposed to high glucose-induced hyperosmolar stress: iPS cells were detached by gentle trypsin/EDTA treatment and resuspended in iso-osmotic buffer.
Starting at iso-osmotic glucose concentration (5.5 mM) and up to 30.5 mM, a series of rapid osmotic shifts was conducted for 0–15–30–60 s, at 15 min, at 1 and 24 h. Changes in (A) cell size measurements (with a Multisizer™3 Coulter counter) in 3 replicate wells and (B) in averagefluorescence intensity (described as the ratio Ft/F0 offluores- cence F at time t to initialfluorescence F0) over time in 8 replicate wells before and after application of the indicated osmotic sugar concentration, are shown. Cell size and water permeability responses to altered extracellular osmolarity respectively follow positive and negative curvilinear trends, where the size decreases during exposure times after 60 s. while the water permeability returns to baseline. Each indicator reflects the mean cell size (cell diameter expressed inμm) (A) or the mean ratio Ft/F0 (B) of 10,000 cells in an individual measurement. Data are from 3 independent experiments. **,pb0.01 vs non-stimulated iPS cells; *,pb0.05 vs non-stimulated iPS cells.
proliferation was not significantly different in iPS cells after 1 h of incu- bation with HG and HM than in those cultured with normal glucose (5.5 mM). Similarly, no significant changes in cell proliferation were re- corded after 15–30–60 s and 15 min of incubation with HG and HM
(data not shown). Increasing incubation time up to 24 h with 30.5 mmol/L glucose or mannitol however did increase cell numbers (Fig. 4C and D). Overall, increasing osmolarity with mannitol and glu- cose up to 30.5 mM resulted in enhanced iPS cell numbers.
KLF-4 50 kDa 43
55 72
34 kB
43 55
OCT-3B 33 kDa OCT 4 43 kDa
33 43 55 72
43 Nanog
50 kDa SOX-2 40 kDa 43
55
34
Glucose, mM Mannitol, mM
30.5 5.5 5.5
- 25 -
GAPDH
Glu 5.5 mM Glu 30.5 mM
Man 25 mM + Glu 5.5 mM
A
KLF-4/GAPDH
**
0 2 4 6
Glu 5.5 mM Glu 30.5 mM
Man 25 mM + Glu 5.5mM
B
Sox-2/GAPDH
*
0
*
1 2
Glu 5.5 mM Glu 30.5 mM
Man 25 mM + Glu 5.5 mM
C
nanog/GAPDH
**
0 0.5 1
Glu 5.5 mM Glu 30.5 mM
Man 25 mM + 5.5. mM
D
Oct-4/GAPDH
**
0 2 4
Fig. 3.Expression of pluripotency markers in human induced pluripotent stem cells exposed to high glucose-induced hyperosmolar stress. Expression analysis of pluripotency genes (KLF- 4, Sox-2, Nanog and OCT-4) in iPS cells incubated for 24 h with high glucose (HG, 30.5 mM) or high mannitol (HM, 30.5 mM). GAPDH expression was used as a loading control. Blots shown are representative of 3 independent experiments. The results of scanning densitometry (n = 3 independent experiments) are expressed as arbitrary units in panels A–D. *,pb0.05 vs non- stimulated iPS cells; **,pb0.01 vs non-stimulated iPS cells.
30.5 5.5
**
GFP-Fluorescenc e (RFU)
24 -h incubation
Glucose, mM
C
0 100 200 300 400 500 600
- 25
**
GFP-Fluorescenc e (RFU)
24-h incubation
Mannitol, mM
Glucose, mM 5.5 5.5
D
0 100 200 300 400 500 600
A
Glucose, mM 5.5 30.5
GFP- F luoresc en ce (RFU)
1-h incubation
0 100 200 300 400 500 600
B
Mannitol, mM
5.5
25
GFP -F luorescence (RFU)
1-h incubation
Glucose, mM 5.5
- 0
100 200 300 400 500 600
Fig. 4.Quantification of GFP+-human induced pluripotent stem cells exposed to high glucose-induced hyperosmolar stress. Total number of greenfluorescent protein (GFP)+-iPS cells incubated for 1 h in isotonic (5.5 mM glucose) or hyperosmolar medium (high glucose (HG): 30.5 mM glucose or high mannitol (HM): 5.5 mM glucose + 25 mM mannitol) or for 24 h in isotonic (5.5 mM glucose) or hyperosmolar medium (HG: 30.5 mM glucose or HM: 5.5 mM glucose + 25 mM mannitol) were quantified spectrofluorimetrically. Results are expressed as (relativefluorescence units (RFU)), and are representative of 3 independent experiments. *,pb0.05 vs non-stimulated iPS cells; **,pb0.01 vs non-stimulated iPS cells.
3.4. Exposure of iPS cells to high glucose or high mannitol induces the formation of osmopodia
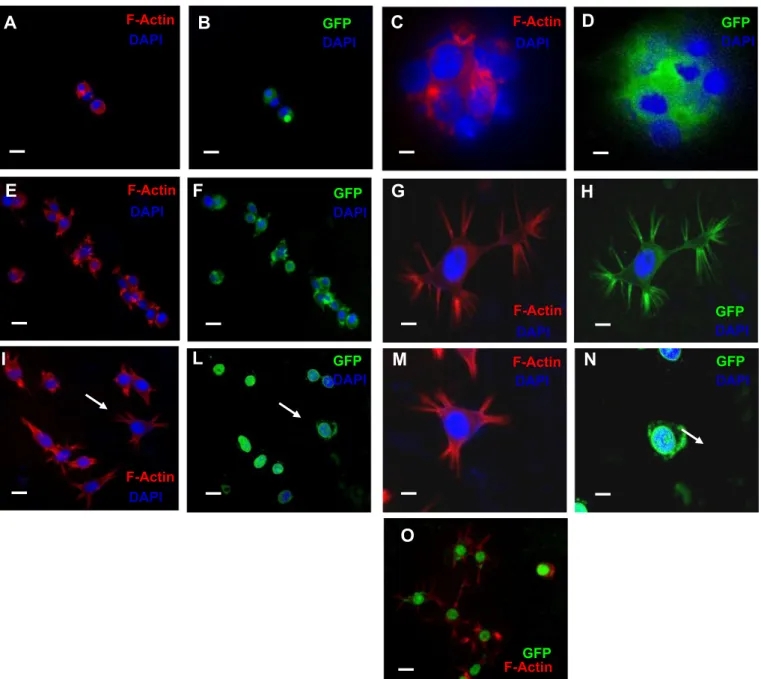
Under isotonic conditions (5.5 mM glucose), iPS cells appeared rounded and organized in compact ES-like colonies, with visible stress fibers (stained in red) running through the cytosol (Fig. 5A). However, their morphology and spatial organization changed markedly when ex- posed to a hyperosmolar medium. In HG or HM, the initial cellular re- sponse was a decreased cell volume. Cells shrank rapidly (with the shrinking process being completed in a few second). The cells then started extending cytoplasmic protrusions termed osmopodia[28].
The osmopodia extension process started after 10 min in medium at 30.5 mM of osmolyte concentration (physiological osmolality is 286 mOsm, which is produced by 5.5 mM glucose concentration).
Fig. 5 shows osmopodia formation from iPS cells at 30.5 mM hyperosmolarity. Podia extension was rare in an isotonic medium
(panel A). However, as the osmolarity of medium increased (panels A–D), the frequency and length of the podia increased dramatically, documenting the induction of the osmopodia by hyperosmolarity. The length and number of osmopodia per cell and the dynamics of osmopodia extension were variable even in a homogeneous iPS cell population. Some cells began osmopodia extension as soon as they completed the shrinking process, while others responded slowly to os- motic stress, causing a diverse distribution of osmopodia lengths. The number of osmopodia extending to a noticeable size per cell ranged from one tofive. Based on cellular volume change as an initial cellular response to the abrupt osmolarity shift, we investigated osmotically ac- tivated ion and water transport mechanisms across the cellular mem- brane. During preliminary experiments observing morphological changes in cells in a drop of cell suspension on a glass slide, we found thatfluorescently labeled cells (GFP-positive iPS cells), particularly those located near the edge of the drop, showed a significant increase
C D
F E
F-Actin GFP DAPI DAPI
GFP DAPI F-Actin
DAPI
F-Actin DAPI
GFP DAPI
I L
F-Actin DAPI
GFP DAPI
A
GFP DAPI F-Actin
DAPI
F-Actin DAPI
GFP DAPI
B
G H
M N
O
F-Actin GFP
Fig. 5.Reorganization of F-actin and formation of osmopodia in human induced pluripotent stem cells exposed to high glucose-induced hyperosmolar stress. iPS cells were incubated for 24 h in isotonic (5.5 mM glucose, A–D) or hyperosmolar medium [HG: 30.5 mM glucose (E–H) or HM: 25 mM mannitol + 5.5 mM glucose (I–O)]. F-actin was stained with rhodamine-conjugated phalloidin and visualized as redfluorescence under afluorescence microscope. In blue, DAPI staining of nuclei; in green, iPS cells expressing greenfluorescent protein (GFP) as a reporter gene.
Magnification 10×: panels A–B, E–F, I–L and O; magnification 20×: panels C–D, G–H, M–N. Arrows in I and L indicate GFP-positive iPS cells with F-actin staining in the samefield as panels M–N.
In panel O, mergedfluorescence from the GFP and F-actin in iPS cells incubated with HM. Scale bar: 10μm.
in osmopodia forming frequency. Almost all suspended cells exhibited hyperosmolarity-induced osmopodia extension.
The actin skeleton is known to play a crucial role in cell protrusion and changes in cell volume and shape[29]. It was therefore conceivable that hyperosmolarity exerts its effect on osmopodia formation through a per- turbation of the actin skeleton. To assess the effect of hyperosmolarity on the actin skeleton, iPS cells and osmopodia in either an isotonic of a hyperosmolar medium were stained in situ after fixation with rhodamine-conjugated phalloidin, which specifically visualizes the poly- meric (F) actin. Indeed, when cells were stained with rhodamine- conjugated phalloidin, F-actin was also detected on the osmopodia. How- ever, even though all iPS cell populations tested here showed a strong positivity in staining for the GFP-reporter gene, this greenfluorescent protein (which localizes in the nuclei as well as in the cytoplasm) was not detected in the osmopodia (Fig. 5E and F). InFig. 5, the rhodamine/
phalloidin-stained iPS cells showed osmopodia extended at 30.5 mM os- molarity (Fig. 5B, C and G). Interestingly, the podia anchored to other cells or to the surface of the culture plate, forming structures similar to tenupodia (arrows inFig. 5I)[28]. Tenupodia are thin, linear segments that bifurcate multiple times[28], and are suggested to play both sensory and mechanical roles during migration and homing of hematopoietic stem cells[28].
3.5. Hyperosmolarity-induced skeleton remodeling is associated with de novo F-actin assembly in iPS cells
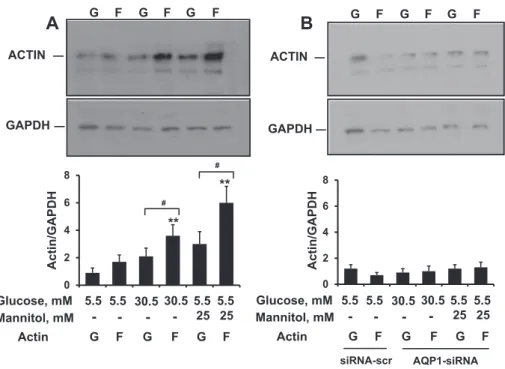
We assessed whether the effect of hyperosmolarity on the actin skeleton is associated with the de novo assembly of F-actin. Changes in F-actin versus G-actin were quantified by Western blotting using a G-actin/F-actin assay (as reported inMaterials and methodssection) (Fig. 6). In iPS cells exposed to HG (30.5 mM glucose) and HM (5.5 mM glucose + 25 mM mannitol), hyperosmolarity induced signif- icant F-actin polymerization, as determined by a 2-fold increase in F- actin (Fig. 6A).
The integrity of the F-actin cytoskeleton is critically dependent on cell volume changes; several volume-regulated transport proteins,
including water channels, exhibit functional interaction, with the cyto- skeleton playing a pivotal role in cell volume regulation[30]. iPS cells (seeFig. 7A, online Supplement Figs. 2 and 3) andfibroblasts before trans- duction[31]express AQP1. To address the mechanism underlying the ob- served F-actin polymerization in iPS cells exposed to hyperosmolarity, we knocked down the AQP1 water channel using a pool of 3 different siRNA oligonucleotides. A significant suppression of AQP1 (about 90%) occurred in iPS cells transfected with siRNAs against AQP1. As a control for the specificity of the siRNA approach, we determined the expression of AQP1 after transfection with a scrambled sequence of siRNA serving as a sequence-unrelated control. AQP1 expression was essentially unchanged with the control reagents. Conversely, in iPS cells ex- posed to hyperosmolarity (HG: 30.5 mM glucose and HM: 5.5 mM glucose + 25 mM mannitol), the silencing of AQP1 prevented the de novo assembly of F-actin induced by hyperosmolarity (Fig. 6B). Taken together, these experiments suggest that hyperosmolarity promotes de novo F-actin assembly, and that AQP1 is an important contributor to the hyperosmolar F-actin response.
3.6. AQP1 is expressed in iPS cells and affects their migration potential
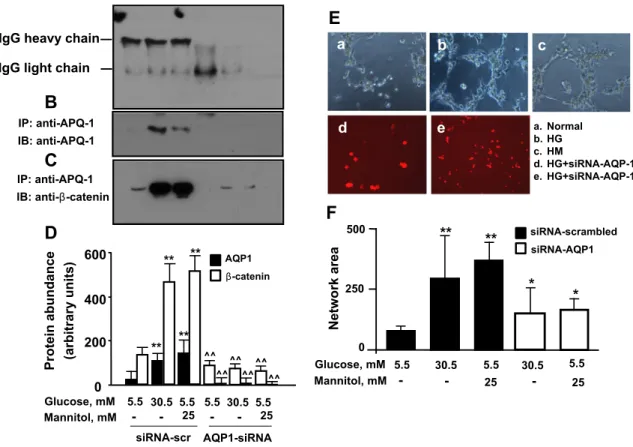
Because AQP1 has been demonstrated to mediate the effects of hyperosmolarity[32]and to be involved in cell migration[33], we inves- tigated the effect of this water channel on cell migration in iPS cells. As shown inFig. 7A, B and D, 24 h exposure of iPS cells to a hyperosmolar medium by the addition of glucose or mannitol (30.5 mM) increased AQP1 expression at immunoprecipitation. We seeded iPS cells on Matrigel after incubation with high glucose or high mannitol in the pres- ence or absence of AQP1 silencing. In this functional assay of cell migra- tion, iPS cells formed bundles in methylcellulose matrix and tubing networks in Matrigel, and high glucose or high mannitol produced the highest number of network formations (Fig. 7E and F). AQP1 knock- down drastically decreased network numbers and the area formed by iPS cells seeded in Matrigel compared with glucose and mannitol- treated cells, indicating a role for AQP1 in mediating hyperosmolarity- induced iPS cell migration. In contrast, scrambled sequences of siRNA
Glucose, mM Mannitol, mM
5.5 30.5 - - 5.5
-
30.5 -
5.5 25
5.5 25
siRNA-scr AQP1-siRNA 30.5
5.5 - - 5.5
-
30.5 -
5.5 25
5.5 25 Glucose, mM
Mannitol, mM GAPDH
G F G F G F
A
ACTIN
GAPDH
G F G F G F
B
ACTIN
0 2 4 6 8
Actin/GAPDH
G F G F G F
Actin
0 2 4 6 8
**
**
#
#
Actin/GAPDH
G F G F G F
Actin
Fig. 6.The effect of AQP1 on G/F actin redistribution in human induced pluripotent stem cells exposed to high glucose-induced hyperosmolar stress. Serum-starved iPS cells were transfected with a pool of siRNAs to AQP1 or siRNAs to a scrambled sequence for 24 h, and then incubated for 24 h with high glucose (HG, 30.5 mmol/L) or high mannitol (HM, 5.5 mM glucose + 25 mM mannitol). At the end of treatment, the G- versus F-actin content was quantified by scanning densitometry on Western blot bands as detailed inMaterials and methodssection. Panel A shows increased expression of F-actin versus G-actin in iPS cells exposed to high glucose or high mannitol. The silencing of AQP1 (panel B) reverts the G/F actin redistribution. Representative immunoblots from 3 different experiments are shown. **,pb0.01 F-actin vs G-actin;#,pb0.01 vs non-stimulated iPS cells.
did not modify the migration capacity of iPS cells. Taken together, these data indicate that hyperosmolarity influences the migration capacity of iPS cells primarily through the activation of upstream mediators of hyperosmolarity, such as AQP1.
3.7. Beta-catenin co-immunoprecipitates with AQP1 in iPS cells exposed to hyperosmolarity
β-Catenin has been reported to promote actin reorganization and is required for the organization of the cytoskeleton[34].β-Catenin can re- cruit cell adhesion molecules, receptors, ion channels and signaling pro- teins[35]. We therefore investigated the possible interaction between the water channel AQP1 andβ-catenin, and some of the downstream signaling of AQP1 in iPS cells exposed to hyperosmolarity. We tested this interaction by using co-immunoprecipitation to determine whether β-catenin is a component of an AQP1-containing complex. When confluent iPS cell lysates were immunoprecipitated with an AQP1- antibody (but not with a pre-immune serum),β-catenin was co- immunoprecipitated, thus suggesting thatβ-catenin interacts with AQP1 (Fig. 7C and D). Twenty-four-hour exposure of iPS cells to a hyperosmolar medium by the addition of glucose or mannitol (at 30.5 mM) increased the expression of β-catenin in the AQP1
immunoprecipitates (Fig. 7C and D). Becauseβ-catenin immunoprecip- itates with AQP1, we analyzed the effect of AQP1 silencing onβ-catenin expression. To specifically block AQP1, again we targeted disruption of AQP1 gene expression using 3 different species of siRNAs. In the immu- noprecipitation experiments, treatment with AQP1 siRNAs resulted in a substantial (N90%) reduction in AQP1 protein expression (Fig. 7B and D). Proteins from AQP1 siRNA-transfected cells were then probed for β-catenin abundance.β-Catenin expression in high glucose- and high mannitol-treated cells, as well as in cells at baseline, was substantially suppressed after transfection with siRNAs against AQP1 (Fig. 7C and D).
4. Discussion
The present study reports novelfindings regarding the effect of en- vironmental conditions simulating diabetes in vitro, i.e. high glucose and hyperosmolarity, in human iPS cells. Here we demonstrate that concentrations of glucose up to 30.5 mM, attainable under hyperglyce- mic conditions, induce F-actin and cytoskeleton remodeling in human iPS cells through an AQP1-dependent hyperosmolar mechanism and, through this mechanism, promote cell migration. These effects depend on the hyperosmolar component of hyperglycemia rather than on
A
IgG heavy chain IgG light chain
D
Proteinabundance (arbitraryunits) 0 200 400 600
** **
Glucose, mM Mannitol, mM
30.5 5.5 5.5
- 25 -
30.5 5.5 5.5
- 25 -
a. Normal b. HG c. HM
d. HG+siRNA-AQP-1 e. HG+siRNA-AQP-1
a b c
d e
E
Network area
*
0 250 500
*
** **
Glucose, mM Mannitol, mM
30.5 5.5
- - 25
5.5 30.5
- 25
5.5 siRNA-AQP1 siRNA-scrambled
F
siRNA-scr AQP1-siRNA
B
C
IP: anti-APQ-1 IB: anti-APQ-1
IP: anti-APQ-1 IB: anti-β-catenin
^^
**
^^
**
^^
^^ ^^ ^^
β-catenin AQP1
Fig. 7.A–D and E–F. Co-immunoprecipitation of AQP1 and beta-catenin in human induced pluripotent stem cells exposed to high glucose-induced hyperosmolar stress (A–D). Human iPS cells were incubated with control glucose (5.5 mmol/L, control), high glucose (HG, 30.5 mmol/L), or high mannitol (HM, 5.5 mM glucose + 25 mM mannitol) for 24 h. At the end of treat- ments, proteins were pulled down and immunoblotted with a monoclonal anti-antibody (panels A–B). In the upper panel of B, a Western blotting for normal IgG is shown in the same immunoprecipitated samples shown in the lower panel. The effect of 24 h incubation with high glucose (HG, 30.5 mmol/L) and high mannitol (HM, 5.5 mM glucose + 25 mM mannitol) on AQP1 and beta-catenin expressions are shown in panels B–C. In the panels C–D, a Western blotting for beta-catenin is shown in the same immunoprecipitated samples shown in the upper panel. Blots shown are representative of 3 independent experiments. The results of scanning densitometry (n = 3 independent experiments) are expressed as arbitrary units in panel D. Tubulization of human induced pluripotent stem cells exposed to high-glucose induced hyperosmolar stress via AQP1 (E–F). The effect of AQP1 gene silencing on high glucose- and high mannitol-induced tubulization of iPS cells. Serum-starved iPS cells were transfected with Cy5-conjugated-siRNAs to AQP1 or siRNAs to a scrambled sequence for 24 h, and then treated for 24 h with control glucose (5.5 mmol/L, control), high glucose (HG, 30.5 mmol/L) or high mannitol (HM, 5.5 mM glucose + 25 mM mannitol). After treatment, cells were enzymatically harvested, plated on Matrigel-coated 96 well-plates, and further incubated with stimuli for 24 h. After incubation, images were taken and analyzed as indicated in Materials and methodssection. Tubule quantification (arbitrary units) from 3 different experiments is shown. *,pb0.05 vs non-stimulated iPS cells treated with scrambled siRNA control;
**,pb0.01 vs stimulated iPS cells treated with scrambled siRNA control.
hyperglycemia per se, as they are mimicked by the exposure of cells to the metabolically inactive monosaccharide mannitol.
Currently available knowledge relates to the effects of high glucose on stem and progenitor cells[18,36], and there are no studies examining the effects of this harmful environmental condition and the resultant hyperosmolarity on iPS cell fate, proliferation and migration. At the same time, there is little knowledge of the underlying mechanisms by which biophysical (in this case hyperosmolarity) or biochemical signals (i.e., high glucose concentrations, simulating hyperglycemia, indepen- dent of hyperosmolarity) are transduced in changing the characteristics and responses of iPS cells. We here demonstrate for thefirst time that iPS cells are osmotically sensitive because capable of sensing and responding to hyperosmolarity,firstly by changing size and water per- meability, secondly by forming osmopodia and tenupodia-like struc- tures, andfinally by expressing protein targets of hyperosmolarity, such as AQP1. Osmopodia and tenupodia in iPS cells may play a role in migration, long distance cell–cell interaction, or even controlling cell death processes. Immunofluorescence images of iPS cells revealed that actin is present in these structures. Further investigation is required to determine their physiological function.
From a molecular biology perspective, cellular responses to hyper- osmolarity are compensatory molecular adaptations that allow the re- establishing of homeostasis [37]. AQP1 is a water channel protein expressed widely in vascular endothelia andfibroblasts, where it in- creases cell membrane water permeability and migration[33,37]. AQP1 protein is expressed strongly in human and animal models of highly pro- liferating microvessels, such as malignant brain tumors[38]and the cho- rioallantoic membrane of the chick embryo[39]. In iPS cells, AQP1 is an upstream mediator of hyperosmolarity, and may represent a form of memory that these cells retain from thefibroblasts from which they originate.
We show here that knock-down of AQP1 prevents the F-actin re- organization and iPS cell migration induced by hyperosmolarity. In non- silenced iPS cells, actin was mostly expressed as polymeric (F) actin, locat- ed in the cytoskeleton, and cells were able to migrate and organize a pseudo-vascular network in the Matrigel model of in vitro angiogenesis used by us. In contrast, iPS cells treated with siRNA against AQP1 expressed mostly monomeric (G) actin in the cytosol and lose the capac- ity to organize such a network offilaments. Thus, water entry in response to hyperosmolarity may create local osmotic gradients driving actin poly- merization and cell movement. This is consistent with previousfindings in other cell types, such as peritoneal mesothelial and ascitic cells[20, 40], human melanoma cells[41], leukocytes and microglia during autoim- mune neuro-inflammation[42,43], corneal keratinocytes[44]and retinal cells in diabetes[45]. Thus, from a functional point of view, AQP1-silenced iPS cells decrease their capacity to migrate.
Another importantfinding of our work is the demonstration that AQP1 interacts withβ-catenin, and this interaction is further enhanced in response to hyperosmolarity. In the canonical Wnt1/β-catenin path- way, Wnt1 ligand determines nuclear translocation of β-catenin, resulting in the regulation of gene transcription involved in cell prolifer- ation and differentiation[46]. Recently it has been shown that Wnt1/β- catenin signaling enhances the induction of iPS cells at early stages of reprogramming[47]. After translocation in the nuclei,β-catenin inter- acts with the reprogramming factors KLF4, OCT4, AND SOX2, further en- hancing the expression of pluripotency genes[47]. In the non-canonical Wnt1 pathway, which is mediated by the intracellular accumulation of calcium ions, Wnt1 ligand determines the nuclear translocation of tran- scription factor Nuclear Factor of Activated T-cells (NFAT), resulting in a suppression ofβ-catenin-dependent transcription, and activation of the small GTPase Cdc42, involved in the remodeling of the actin cytoskele- ton, as well as the regulation of cell shape and cell migration[48–50].
Canonical and non-canonical Wnt1 pathways seem to have opposite ef- fects on iPS cells and stem cells, since the activation of the former would lead to induction of reprogramming[47], while activation of the latter would enhance changes in cell shape, adhesion and migration[51].
We have previously observed (data not shown) that in endothelial cells and iPS cells hyperosmolarity increases the expression of NFAT and its nuclear translocation, suggesting an activation of the non- canonical Wnt1 pathway in cells exposed to hyperosmolarity.
Our data, showing interaction between AQP1 andβ-catenin, would indicate that the cellular redistribution ofβ-catenin from the nuclei to the cytoplasma is a consequence of hyperosmolarity, with a reduction of the proportion ofβ-catenin free to translocate into the nuclei. There- fore the interaction between AQP1 andβ-catenin is probably a second- ary effect, rather than the direct consequence of osmolarity changes. On the contrary, activation of the non-canonical Wnt signaling pathway would be the primary effect of hyperosmolarity, and may represent the putative intracellular mechanism and the main downstream medi- ator of hyperosmolarity effects on iPS cell adhesion and migration. The effects of hyperosmolarity on canonical as well as non-canonical Wnt pathways need however to be further characterized.
Taken together, these data show that AQP1 is a critical component for the assembly of a plasma membrane-associated multiprotein com- plex, of whichβ-catenin is an important component; and that AQP1 me- diates the stimulatory effect of hyperosmolarity on the cytoskeletal reorganization and motility of iPS cells. Interestingly, high glucose, but not high mannitol, which is devoid of glucose metabolic effect, positive- ly affected gene expression of pluripotency markers in iPS cells. This finding is supported by previous literature reporting an increase in the reprogramming efficiency of iPS cells under high-glucose conditions[14, 52,53](reviewed in [18]). It has indeed been shown that somatic reprogramming and pluripotency are characterized by a transition from oxidative metabolism to anaerobic glycolysis[14]. A high concen- tration of glucose in the culture medium stimulates the glycolyticflux, which guarantees the production of sufficient amounts of ATP to meet the metabolic requirements of proliferating cells[54].
The generation of iPS cells from patients or healthy donors offers a dis- ease model in which the patterns of growth, apoptosis and differentia- tion, as well as physiological responses to environmental factors such as elevated glucose concentrations and the resultant hyperosmolarity (both common in diabetes) can be analyzed. Although we acknowledge a limitation in our studies in not having a direct in vivo transferability, be- cause we did not usefibroblasts derived from diabetic patients, the deri- vation of iPS cells from commercially available humanfibroblasts has allowed us to analyze, in a selective manner, the effect of two main players—hyperglycemia and hyperosmolarity—in the diabetic microen- vironment. Our studies therefore demonstrate how iPS cells may serve as in vitro disease model useful for the selective assessment of the cellular response of stem cells to environmental factors that can play a role in pathopysiological conditions, such as overt diabetes. Understanding the molecular and cellular responses of iPS cells in normal and disease condi- tions will help in generating autologous human iPS cell lines from healthy donors or diabetic patients for future therapeutic developments.
Authors' contributions
Rosalinda Madonna: Conception and design, collection and assem- bly of data, data analysis and interpretation, and manuscript writing.
Yong-Jian Geng: Data analysis and interpretation,financial support, and provision of study material.
Harnath Shelat: Collection of data.
Peter Ferdinandy: Data analysis and interpretation and manuscript writing.
Raffaele De Caterina: Data analysis and interpretation,financial sup- port, manuscript writing, andfinal approval.
Conflict of interest No conflicts of interest.
Acknowledgements
This study was supported by funds from the Istituto Nazionale Ricerche Cardiovascolari (I.N.R.C.) and Fondazione Cariplo (to RDC and RM), and Texas Heart Institute (to RM and YJG).
Appendix A. Supplementary data
Supplementary data to this article can be found online athttp://dx.
doi.org/10.1016/j.bbadis.2014.07.030.
References
[1] R. Sharma, R. Raghubir, Stem cell therapy: a hope for dying hearts, Stem Cells Dev.
16 (2007) 517–536.
[2] W.J. He, Q. Hou, Q. Han, W. Han, X. Fu, Pluripotent reprogramming and lineage reprogramming: promises and challenges in cardiovascular regeneration, Tissue Eng. Part B Rev. 20 (4) (2013) 304–313.
[3] M. Rao, M.L. Condic, Alternative sources of pluripotent stem cells: scientific solutions to an ethical dilemma, Stem Cells Dev. 17 (2008) 1–10.
[4] L. Qian, Y. Huang, C.I. Spencer, A. Foley, V. Vedantham, L. Liu, S.J. Conway, J.D. Fu, D.
Srivastava, In vivo reprogramming of murine cardiacfibroblasts into induced cardiomyocytes, Nature 485 (2012) 593–598.
[5] E.M. Heinrich, S. Dimmeler, MicroRNAs and stem cells: control of pluripotency, reprogramming, and lineage commitment, Circ. Res. 110 (2012) 1014–1022.
[6] R. Madonna, Human-induced pluripotent stem cells: in quest of clinical applications, Mol. Biotechnol. 52 (2) (2012) 193–203.
[7] S. Mahmoudi, A. Brunet, Aging and reprogramming: a two-way street, Curr. Opin.
Cell Biol. 24 (6) (2012) 744–756.
[8] B. Wang, Y. Miyagoe-Suzuki, E. Yada, N. Ito, T. Nishiyama, M. Nakamura, Y. Ono, N.
Motohashi, M. Segawa, S. Masuda, S. Takeda, Reprogramming efficiency and quality of induced pluripotent stem cells (iPSCs) generated from muscle-derivedfibroblasts of mdx mice at different ages, PLoS Curr. 3 (2011) RRN1274.
[9] B. Zuo, J. Yang, F. Wang, L. Wang, Y. Yin, J. Dan, N. Liu, L. Liu, Influences of lamin A levels on induction of pluripotent stem cells, Biol. Open 1 (2012) 1118–1127.
[10]P. Costa, F.V. Almeida, J.T. Connelly, Biophysical signals controlling cell fate deci- sions: how do stem cells really feel? Int. J. Biochem. Cell Biol. 44 (2012) 2233–2237.
[11] E.S. Oswald, L.M. Brown, J.C. Bulinski, C.T. Hung, Label-free protein profiling of adipose-derived human stem cells under hyperosmotic treatment, J. Proteome Res. 10 (2011) 3050–3059.
[12] D. Studer, C. Millan, E. Ozturk, K. Maniura-Weber, M. Zenobi-Wong, Molecular and biophysical mechanisms regulating hypertrophic differentiation in chondrocytes and mesenchymal stem cells, Eur. Cell Mater. 24 (2012) 118–135 (discussion 135).
[13] Y. Sun, C.S. Chen, J. Fu, Forcing stem cells to behave: a biophysical perspective of the cellular microenvironment, Annu. Rev. Biophys. 41 (2012) 519–542.
[14] C.D. Folmes, T.J. Nelson, A. Martinez-Fernandez, D.K. Arrell, J.Z. Lindor, P.P. Dzeja, Y.
Ikeda, C. Perez-Terzic, A. Terzic, Somatic oxidative bioenergetics transitions into pluripotency-dependent glycolysis to facilitate nuclear reprogramming, Cell Metab. 14 (2011) 264–271.
[15] Y.Y. Jang, S.J. Sharkis, A low level of reactive oxygen species selects for primitive he- matopoietic stem cells that may reside in the low-oxygenic niche, Blood 110 (2007) 3056–3063.
[16] J.E. Le Belle, N.M. Orozco, A.A. Paucar, J.P. Saxe, J. Mottahedeh, A.D. Pyle, H. Wu, H.I.
Kornblum, Proliferative neural stem cells have high endogenous ROS levels that reg- ulate self-renewal and neurogenesis in a PI3K/Akt-dependent manner, Cell Stem Cell 8 (2011) 59–71.
[17] S. Varum, A.S. Rodrigues, M.B. Moura, O. Momcilovic, C.A.t. Easley, J. Ramalho- Santos, B. Van Houten, G. Schatten, Energy metabolism in human pluripotent stem cells and their differentiated counterparts, PLoS One 6 (2011) e20914.
[18] R. Madonna, A. Gorbe, P. Ferdinandy, R. De Caterina, Glucose metabolism, hyperosmotic stress, and reprogramming of somatic cells, Mol. Biotechnol. 55 (2) (2013) 169–178.
[19]W.J. Armitage, P. Mazur, Osmotic tolerance of human granulocytes, Am. J. Physiol.
247 (1984) C373–C381.
[20]A. Breborowicz, A. Polubinska, D.G. Oreopoulos, Changes in volume of peritoneal mesothelial cells exposed to osmotic stress, Perit. Dial. Int. 19 (1999) 119–123.
[21]M.R. Curry, P.F. Watson, Osmotic effects on ram and human sperm membranes in relation to thawing injury, Cryobiology 31 (1994) 39–46.
[22]D. Kultz, S. Madhany, M.B. Burg, Hyperosmolality causes growth arrest of murine kidney cells. Induction of GADD45 and GADD153 by osmosensing via stress- activated protein kinase 2, J. Biol. Chem. 273 (1998) 13645–13651.
[23] S.S. Ozturk, B.O. Palsson, Effect of medium osmolarity on hybridoma growth, metab- olism, and antibody production, Biotechnol. Bioeng. 37 (1991) 989–993.
[24] R. Madonna, P. Di Napoli, M. Massaro, A. Grilli, M. Felaco, A. De Caterina, D. Tang, R.
De Caterina, Y.J. Geng, Simvastatin attenuates expression of cytokine-inducible nitric-oxide synthase in embryonic cardiac myoblasts, J. Biol. Chem. 280 (2005) 13503–13511.
[25] R.A. Fenton, H.B. Moeller, S. Nielsen, B.L. de Groot, M. Rutzler, A plate reader-based method for cell water permeability measurement, Am. J. Physiol. Renal Physiol.
298 (2010) F224–F230.
[26]E. Solenov, H. Watanabe, G.T. Manley, A.S. Verkman, Sevenfold-reduced osmotic water permeability in primary astrocyte cultures from AQP-4-deficient mice, mea- sured by afluorescence quenching method, Am. J. Physiol. Cell Physiol. 286 (2004) C426–C432.
[27]G.M. Preston, T.P. Carroll, W.B. Guggino, P. Agre, Appearance of water channels in Xenopus oocytes expressing red cell CHIP28 protein, Science 256 (1992) 385–387.
[28]K. Francis, R. Ramakrishna, W. Holloway, B.O. Palsson, Two new pseudopod mor- phologies displayed by the human hematopoietic KG1a progenitor cell line and by primary human CD34(+) cells, Blood 92 (1998) 3616–3623.
[29] V.M. Loitto, T. Karlsson, K.E. Magnusson, Waterflux in cell motility: expanding the mechanisms of membrane protrusion, Cell Motil. Cytoskeleton 66 (2009) 237–247.
[30] A.S. Verkman, More than just water channels: unexspected cellular roles of aquapo- rins, J. Cell Sci. 118 (2007) 3225–3232.
[31] N. Sugimoto, O. Shido, K. Matsuzaki, T. Ohno-Shosaku, Y. Hitomi, M. Tanaka, T.
Sawaki, Y. Fujita, T. Kawanami, Y. Masaki, T. Okazaki, H. Nakamura, S. Koizumi, A.
Yachie, H. Umehara, Cellular heat acclimation regulates cell growth, cell morpholo- gy, mitogen-activated protein kinase activation, and expression of aquaporins in mousefibroblast cells, Cell. Physiol. Biochem. 30 (2012) 450–457.
[32] F. Lang, G.L. Busch, M. Ritter, H. Volkl, S. Waldegger, E. Gulbins, D. Haussinger, Functional significance of cell volume regulatory mechanisms, Physiol. Rev. 78 (1998) 247–306.
[33] S. Saadoun, M.C. Papadopoulos, M. Hara-Chikuma, A.S. Verkman, Impairment of an- giogenesis and cell migration by targeted aquaporin-1 gene disruption, Nature 434 (2005) 786–792.
[34]K. Barami, L. Lewis-Tuffin, P.Z. Anastasiadis, The role of cadherins and catenins in gliomagenesis, Neurosurg. Focus. 21 (2006) E13.
[35] C. Perego, C. Vanoni, A. Villa, R. Longhi, S.M. Kaech, E. Frohli, A. Hajnal, S.K. Kim, G.
Pietrini, PDZ-mediated interactions retain the epithelial GABA transporter on the basolateral surface of polarized epithelial cells, EMBO J. 18 (1999) 2384–2393.
[36] R. Madonna, R. De Caterina, Cellular and molecular mechanisms of vascular injury in diabetes—part II: cellular mechanisms and therapeutic targets, Vascul. Pharmacol.
54 (2012) 75–79.
[37] L.S. King, D. Kozono, P. Agre, From structure to disease: the evolving tale of aquapo- rin biology, Nat. Rev. Mol. Cell Biol. 5 (2004) 687–698.
[38] S. Saadoun, M.C. Papadopoulos, D.C. Davies, B.A. Bell, S. Krishna, Increased aquaporin 1 water channel expression in human brain tumours, Br. J. Cancer 87 (2002) 621–623.
[39] D. Ribatti, A. Frigeri, B. Nico, G.P. Nicchia, M. De Giorgis, L. Roncali, M. Svelto, Aquaporin-1 expression in the chick embryo chorioallantoic membrane, Anat. Rec.
268 (2002) 85–89.
[40]M. Rasmussen, R.T. Alexander, B.V. Darborg, N. Mobjerg, E.K. Hoffmann, A. Kapus, S.F.
Pedersen, Osmotic cell shrinkage activates ezrin/radixin/moesin (ERM) proteins: acti- vation mechanisms and physiological implications, Am. J. Physiol. Cell Physiol. 294 (2008) C197–C212.
[41]E. Monzani, A.A. Shtil, C.A. La Porta, The water channels, new druggable targets to combat cancer cell survival, invasiveness and metastasis, Curr. Drug Targets 8 (2007) 1132–1137.
[42] L. Li, H. Zhang, M. Varrin-Doyer, S.S. Zamvil, A.S. Verkman, Proinflammatory role of aquaporin-4 in autoimmune neuroinflammation, FASEB J. 25 (2011) 1556–1566.
[43] A.S. Verkman, Aquaporins: translating bench research to human disease, J. Exp. Biol.
212 (2009) 1707–1715.
[44]J. Ruiz-Ederra, A.S. Verkman, Aquaporin-1-facilitated keratocyte migration in cell culture and in vivo corneal wound healing models, Exp. Eye Res. 89 (2009) 159–165.
[45] M. Hollborn, S. Dukic-Stefanovic, T. Pannicke, E. Ulbricht, A. Reichenbach, P.
Wiedemann, A. Bringmann, L. Kohen, Expression of aquaporins in the retina of dia- betic rats, Curr. Eye Res. 36 (2011) 850–856.
[46]D. Baksh, R.S. Tuan, Canonical and non-canonical Wnts differentially affect the de- velopment potential of primary isolate of human bone marrow mesenchymal stem cells, J. Cell. Physiol. 212 (2007) 817–826.
[47] P. Zhang, W.H. Chang, B. Fong, F. Gao, C. Liu, D. Al Alam, S. Bellusci, W. Lu, Regulation of induced pluripotent stem (iPS) cell induction by Wnt/beta-catenin signaling, J.
Biol. Chem. 289 (2014) 9221–9232.
[48] R. Habas, I.B. Dawid, X. He, Coactivation of Rac and Rho by Wnt/Frizzled signaling is required for vertebrate gastrulation, Genes Dev. 17 (2003) 295–309.
[49] K. Schlessinger, E.J. McManus, A. Hall, Cdc42 and noncanonical Wnt signal transduc- tion pathways cooperate to promote cell polarity, J. Cell Biol. 178 (2007) 355–361.
[50]K. Schlessinger, A. Hall, N. Tolwinski, Wnt signaling pathways meet Rho GTPases, Genes Dev. 23 (2009) 265–277.
[51] J. De Calisto, C. Araya, L. Marchant, C.F. Riaz, R. Mayor, Essential role of non-canonical Wnt signalling in neural crest migration, Development 132 (2005) 2587–2597.
[52]S.Y. Lunt, M.G. Vander Heiden, Aerobic glycolysis: meeting the metabolic require- ments of cell proliferation, Annu. Rev. Cell Dev. Biol. 27 (2011) 441–464.
[53] L.A. Mylotte, A.M. Duffy, M. Murphy, T. O'Brien, A. Samali, F. Barry, E. Szegezdi, Met- abolicflexibility permits mesenchymal stem cell survival in an ischemic environ- ment, Stem Cells 26 (2008) 1325–1336.
[54] A. Bar-Even, E. Noor, A. Flamholz, J.M. Buescher, R. Milo, Hydrophobicity and charge shape cellular metabolite concentrations, PLoS Comput. Biol. 7 (2011) e1002166.