Article
Stromal Cells Serve Drug Resistance for Multiple Myeloma via Mitochondrial Transfer: A Study on Primary Myeloma and
Stromal Cells
Zsolt Matula1,*, Gábor Mikala1, Szilvia Lukácsi2 , János Matkó3, Tamás Kovács4,Éva Monostori5, Ferenc Uher1and István Vályi-Nagy1
Citation: Matula, Z.; Mikala, G.;
Lukácsi, S.; Matkó, J.; Kovács, T.;
Monostori, É.; Uher, F.; Vályi-Nagy, I.
Stromal Cells Serve Drug Resistance for Multiple Myeloma via Mitochondrial Transfer: A Study on Primary Myeloma and Stromal Cells.
Cancers2021,13, 3461. https://
doi.org/10.3390/cancers13143461
Academic Editors: Sikander Ailawadhi and Lucia Altucci
Received: 26 May 2021 Accepted: 7 July 2021 Published: 10 July 2021
Publisher’s Note:MDPI stays neutral with regard to jurisdictional claims in published maps and institutional affil- iations.
Copyright: © 2021 by the authors.
Licensee MDPI, Basel, Switzerland.
This article is an open access article distributed under the terms and conditions of the Creative Commons Attribution (CC BY) license (https://
creativecommons.org/licenses/by/
4.0/).
1 Central Hospital of Southern Pest, National Institute of Hematology and Infectious Diseases, 1097 Budapest, Hungary; gmikala@dpckorhaz.hu (G.M.); uher.ferenc@gmail.com (F.U.);
drvnistvan@gmail.com (I.V.-N.)
2 MTA-ELTE Immunology Research Group, Department of Immunology, Eötvös Loránd University, 1053 Budapest, Hungary; lukacsisz.zs@gmail.com
3 Department of Immunology, Eötvös Loránd University, 1053 Budapest, Hungary; matko@elte.hu
4 Department of Anatomy, Histology and Embryology, Semmelweis University, 1085 Budapest, Hungary;
kovacs.tamas@med.semmelweis-univ.hu
5 Institute of Genetics, Biological Research Centre, 6726 Szeged, Hungary; monosbeni@gmail.com
* Correspondence: matula.zsolt@gmail.com
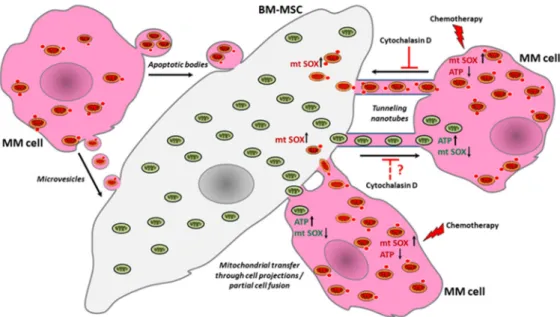
Simple Summary:Mitochondrial transfer plays a crucial role in the acquisition of drug resistance in multiple myeloma, but its exact mechanism is not yet clear; moreover, overcoming the drug resistance that it causes is also a major challenge. Our research on primary myeloma cell cultures reveals that mitochondrial transfer is bi-directional between bone marrow stromal cells and myeloma cells, occurring via tunneling nanotubes and partial cell fusion with extreme increases under the influence of chemotherapeutic drugs, whereupon survival and adenosine triphosphate levels increase, while mitochondrial superoxide levels decrease in myeloma cells. These changes and the elevation of superoxide levels in stromal cells are proportional to the amount of incorporated mitochondria derived from the other cell type and to the concentration of the used drug. Although the inhibition of mitochondrial transfer is limited between stromal and myeloma cells, the supportive effect of stromal cells can be effectively averted by influencing the tumor metabolism with an inhibitor of oxidative phosphorylation in addition to chemotherapeutics.
Abstract:Recently, it has become evident that mitochondrial transfer (MT) plays a crucial role in the acquisition of cancer drug resistance in many hematologic malignancies; however, for multiple myeloma, there is a need to generate novel data to better understand this mechanism. Here, we show that primary myeloma cells (MMs) respond to an increasing concentration of chemotherapeutic drugs with an increase in the acquisition of mitochondria from autologous bone marrow stromal cells (BM-MSCs), whereupon survival and adenosine triphosphate levels of MMs increase, while the mitochondrial superoxide levels decrease in MMs. These changes are proportional to the amount of incorporated BM-MSC-derived mitochondria and to the concentration of the used drug, but seem independent from the type and mechanism of action of chemotherapeutics. In parallel, BM- MSCs also incorporate an increasing amount of MM cell-derived mitochondria accompanied by an elevation of superoxide levels. Using the therapeutic antibodies Daratumumab, Isatuximab, or Elotuzumab, no similar effect was observed regarding the MT. Our research shows that MT occurs via tunneling nanotubes and partial cell fusion with extreme increases under the influence of chemotherapeutic drugs, but its inhibition is limited. However, the supportive effect of stromal cells can be effectively avoided by influencing the metabolism of myeloma cells with the concomitant use of chemotherapeutic agents and an inhibitor of oxidative phosphorylation.
Keywords:multiple myeloma; tunneling nanotube; mitochondrial transfer; cancer drug resistance;
bone marrow mesenchymal stromal cell
Cancers2021,13, 3461. https://doi.org/10.3390/cancers13143461 https://www.mdpi.com/journal/cancers
Cancers2021,13, 3461 2 of 24
1. Introduction
Understanding the molecular mechanisms of cancer drug resistance is critical in order to accomplish effective and long-lasting cancer treatment. The ‘intrinsic’ mechanisms of drug resistance include many cellular processes such as DNA damage repair, genomic insta- bility, apoptosis inhibition, metabolic adaptation, and the activity of drug transporters [1].
In addition, recently it has also become clear that cellular interactions within the tumor microenvironment play at least as important a role in tumor progression and resistance to therapy as the intracellular mechanisms. The most essential mediators of intercellular signaling are soluble factors, extracellular vesicles, and tunneling nanotubes (TNTs) [2], furthermore, the interactions of membrane proteins followed by the exchange of large plasma membrane fragments, also known as trogocytosis, are also decisive in the com- munication between mesenchymal stromal cells (MSCs) and cancer cells [3]. All of these different types of interactions involve functional interference and the mutual acquisition of new cellular properties.
Tunneling nanotubes are long-distance intercellular connections that allow the ex- change of various cargos between cells, from ions and small molecules to functional organelles such as mitochondria [4]. The horizontal mitochondrial transfer is of great importance, as the acquisition of cancer drug resistance seems to be strongly associated with TNT-mediated mitochondrial transfer. Therefore, mitochondria emerged as a cru- cial therapeutic target in cancer and in other common pathologies as well, such as heart attack, Parkinson disease, Alzheimer disease, fatty liver disease, muscular dystrophies, and even colitis [5]. A recent approach optimizing cancer therapy is targeting different cellular organelles, including the mitochondria [6]. Over the past decade, several studies have found that the acquisition of mitochondria from neighboring healthy cells and/or the transfer of damaged mitochondria to the healthy cells through TNTs increases the growth potential of tumor cells, provides survival benefits, enhances their chemoresis- tance, and certainly alters the metabolism and functional properties of the recipient tumor cells [7–11]. The acquisition of mitochondria via TNTs does not only increase the oxidative phosphorylation (OXPHOS) activity and adenosine triphosphate (ATP) level of tumor cells, but also indirectly affects their general metabolism, improves their proliferative and migratory properties, and increases the feasibility of developing resistance to chemother- apeutic treatment [12–14]. Tumor cell metabolism is characterized by an energy-saving mode ensured by high glycolytic activity and none, or decreased, OXPHOS [15], even in the presence of abundant oxygen. However, recent studies have shown that OXPHOS increased in certain tumor types [16–18]. Mitochondria have a major contribution in the generation of reactive oxygen species (ROS): electrons are released due to OXPHOS activity and molecular oxygen interacting with these electrons producing ROS. Oxidative stress induces a sharp decrease of mitochondrial membrane potential and facilitates the induction of the mitochondrial permeability transition pores (MPTPs). As a result of opening the MPTPs, antioxidant molecules such as glutathione are released from mitochondria, which reduce the ability of ROS neutralization. In addition, more free radicals are produced due to the loss of mitochondrial electron transport chain components through the MPTPs.
Mitochondrial permeability transition is a central coordinating event of apoptosis, and thus targeting MPTP might be a propitious anticancer therapy due to the specificity and less chance of developing resistance mechanisms [19].
Mesenchymal stromal cells protect leukemic cells such as T cell acute lymphoblas- tic leukemia (T-ALL) [10] and acute myeloid leukemia (AML) [7,8] from chemotherapy;
however, the exact mechanism of this protection has not been clearly revealed. In the case of T-ALL, the survival of leukemic cells upon treatment with drugs (cytarabine or mitoxantrone) was attributed to mitochondrial transfer toward stromal cells through TNTs.
The stromal cells showed an increasing number of leukemic cell-derived mitochondria, while in parallel the intracellular levels of mitochondrial ROS and apoptotic rates were significantly reduced in both Jurkat and primary ALL cells [10]. By inhibiting the formation
of membrane nanotubes with cytochalasin D, the chemoresistance of leukemic cells was radically reduced.
In the case of acute myeloid leukemia, superoxide generated by the NADPH oxidase 2 enzyme complex induces bone marrow stromal cells to deliver mitochondria to AML blasts through tumor cell-derived membrane nanotubes [7]. In AML cells co-cultured with mesenchymal stromal cells, mitochondrial mass and mitochondrial ATP production increased by 14% and up to 1.5-fold, respectively, and AML showed a higher survival rate upon drug treatment [8].
Additionally, B-cell precursor acute lymphoblastic leukemia (BCP-ALL) cells induced MSCs to produce pro-survival cytokines and chemokines such as interferon-γ-inducible protein 10, interleukin 8, and monocyte chemotactic protein-1 [20]. The precursor B cell-derived membrane nanotubes carry autophagosomes, mitochondria, endoplasmic reticulum, and the ICAM-1 transmembrane protein into mesenchymal stromal cells [9].
Bone marrow stromal cells can also transfer mitochondria through TNTs into B-ALL cells and rescue them from ROS-inducing chemotherapy [21], suggesting that mitochondrial transfer between BCP-ALL cells and MSCs can occur in both directions.
At present, only one study has been conducted on this topic in relation to multiple myeloma claiming that bone marrow stromal cells increased OXPHOS activity in MMs by the accumulation of functional mitochondria from BM-MSCs via TNTs, and CD38 was involved in this process [11].
In this study, primary myeloma cells (MMs) and autologous BM-MSCs were used.
The purpose of the work was to obtain a deeper insight into the mechanism by which MSCs protect MMs from cytotoxic effect of chemotherapeutic drugs and therapeutical antibodies used in the treatment of multiple myeloma. In the course of testing these medicines, we determined the direction and kinetics of mitochondrial transfer. A variety of inhibitors blocking different cellular processes such as endocytosis, the formation of gap junctions, actin, and tubulin polymerization, and macropinocytosis were also used. Changes in mitochondrial specific superoxide and ATP levels in both donor and recipient cells were determined in parallel with the quantification of intercellular mitochondrial transfer in the presence or absence of drugs or inhibitors. The effect of the OXPHOS inhibitor metformin in combination with chemotherapeutic agents was also assessed regarding the survival of MMs in the presence of autologous BM-MSCs.
2. Materials and Methods
2.1. Primary Cell Isolation and Culture
All experiments using primary human cells were approved by the Ethics and Scientific Committee of the Central Hospital of Southern Pest—National Institute of Hematology and Infectious Diseases (OGYÉI/50268-8/2017). Bone marrow aspirates collected for diagnostic and research purposes were obtained by sternal bone marrow puncture after patients’ written informed consent. A list of involved patients is shown in Table1. Bone marrow mononuclear cells (BM-MNCs) were isolated by density gradient centrifugation on Ficoll-Paque PLUS (GE Healthcare Bio-Sciences, Pittsburgh, PA, USA) according to the manufacturer’s instructions. The isolated BM-MNCs were cultured in DMEM/F12 growth medium supplemented by 10%v/vFBS, 2 mM L-glutamine, 100 IU/mL of Penicillin, and 100µg/mL of Streptomycin. Medium and supplements were purchased from Thermo Fisher Scientific (Waltham, MA, USA). Culture medium was changed after 3 days, and primary cells were further cultured for up to 1–2 months, while the growth medium was changed twice a week. When the cell cultures contained only stromal cells and intensively proliferating malignant plasma cells, the co-cultures were passaged. One part of the cells was cryopreserved, while the other part was further cultured for the experiments as follows: proliferating myeloma cells were washed thoroughly from the stromal cell layer and cultured in a separate flask. The washing step was repeated a further two times, and the separation of the two cell types was improved by a repeated passage if needed, after which malignant plasma cells were washed thoroughly again from the newly adhered
Cancers2021,13, 3461 4 of 24
stromal cells. If the two cell types could not be separated this way, stromal cells were sorted by FACSAria flow cytometer (BD Biosciences, Franklin Lakes, NJ, USA). Only successfully separated cell cultures were used for further experiments, where the culture of stromal cells contained little or no myeloma cells. All primary bone marrow samples were obtained from patients with intramedullary myeloma.
Table 1. Multiple myeloma patients with excellent in vitro growth potential of neoplastic plasma cells used in this study.
Sample ID Age Sex Ig Isotype Primary Genetic Alteration
Newly Diag- nosed/Relapsed
#108 83 Female IgA lambda t(4;14) Relapsed
#118 70 Male IgG kappa Hyperdiploidy Newly
diagnosed
#123 85 Female IgG kappa t(4;14) Relapsed
#126 74 Female IgG lambda Hyperdiploidy Relapsed
#128 43 Male Kappa light
chain Hyperdiploidy Newly
diagnosed
#130 53 Male IgG kappa Hyperdiploidy Newly
diagnosed
#132 56 Male IgA kappa t(4;14) Newly
diagnosed
#165 77 Female IgA kappa t(11;14) Newly
diagnosed
#178 77 Male IgG kappa Hyperdiploidy Relapsed
#179 50 Female Kappa light
chain t(11;14) Newly
diagnosed
2.2. Therapeutic Antibodies, Chemotherapeutic Drugs, and Inhibitors Used in the Cytotoxicity Assay and Mitochondrial Transfer Assays
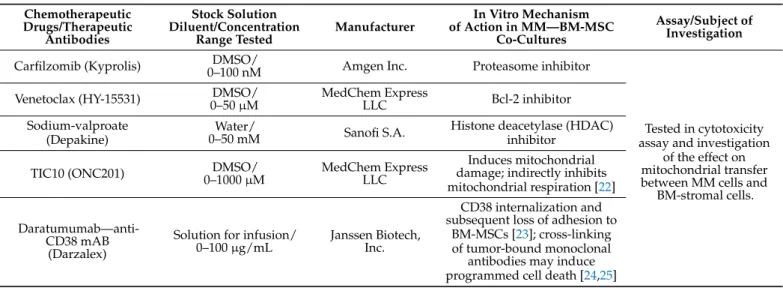
The list of therapeutic antibodies and chemotherapeutic agents and inhibitors of various cellular processes used in cytotoxicity assays and mitochondrial transfer assays are detailed in Table2.
Table 2.Therapeutic antibodies, chemotherapeutic drugs, and inhibitors used in this study.
Chemotherapeutic Drugs/Therapeutic
Antibodies
Stock Solution Diluent/Concentration
Range Tested Manufacturer
In Vitro Mechanism of Action in MM—BM-MSC
Co-Cultures
Assay/Subject of Investigation Carfilzomib (Kyprolis) DMSO/
0–100 nM Amgen Inc. Proteasome inhibitor
Tested in cytotoxicity assay and investigation
of the effect on mitochondrial transfer between MM cells and
BM-stromal cells.
Venetoclax (HY-15531) DMSO/
0–50µM MedChem Express
LLC Bcl-2 inhibitor
Sodium-valproate (Depakine)
Water/
0–50 mM Sanofi S.A. Histone deacetylase (HDAC) inhibitor
TIC10 (ONC201) DMSO/
0–1000µM MedChem Express LLC
Induces mitochondrial damage; indirectly inhibits mitochondrial respiration [22]
Daratumumab—anti- CD38 mAB
(Darzalex)
Solution for infusion/
0–100µg/mL Janssen Biotech, Inc.
CD38 internalization and subsequent loss of adhesion to
BM-MSCs [23]; cross-linking of tumor-bound monoclonal
antibodies may induce programmed cell death [24,25]
Table 2.Cont.
Chemotherapeutic Drugs/Therapeutic
Antibodies
Stock Solution Diluent/Concentration
Range Tested Manufacturer
In Vitro Mechanism of Action in MM—BM-MSC
Co-Cultures
Assay/Subject of Investigation
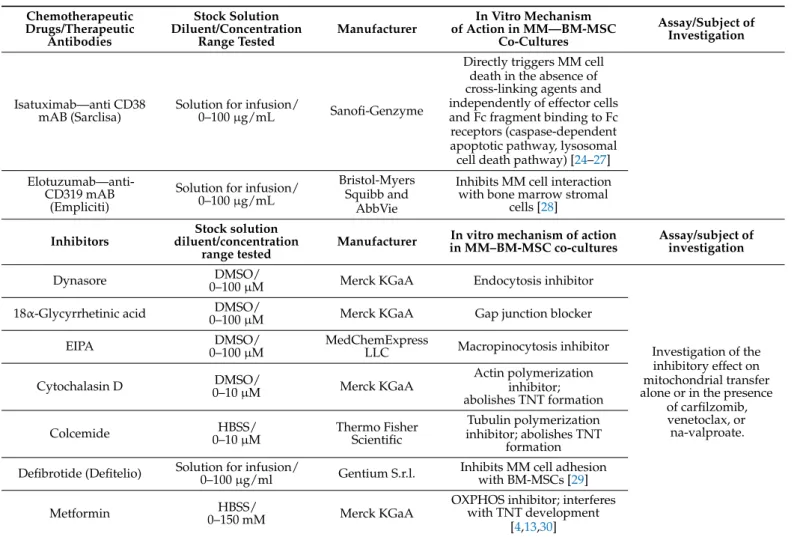
Isatuximab—anti CD38
mAB (Sarclisa) Solution for infusion/
0–100µg/mL Sanofi-Genzyme
Directly triggers MM cell death in the absence of cross-linking agents and independently of effector cells and Fc fragment binding to Fc receptors (caspase-dependent apoptotic pathway, lysosomal cell death pathway) [24–27]
Elotuzumab—anti- CD319 mAB
(Empliciti)
Solution for infusion/
0–100µg/mL
Bristol-Myers Squibb and
AbbVie
Inhibits MM cell interaction with bone marrow stromal
cells [28]
Inhibitors
Stock solution diluent/concentration
range tested Manufacturer In vitro mechanism of action in MM–BM-MSC co-cultures
Assay/subject of investigation
Dynasore DMSO/
0–100µM Merck KGaA Endocytosis inhibitor
Investigation of the inhibitory effect on mitochondrial transfer alone or in the presence
of carfilzomib, venetoclax, or
na-valproate.
18α-Glycyrrhetinic acid DMSO/
0–100µM Merck KGaA Gap junction blocker
EIPA DMSO/
0–100µM MedChemExpress
LLC Macropinocytosis inhibitor
Cytochalasin D DMSO/
0–10µM Merck KGaA
Actin polymerization inhibitor;
abolishes TNT formation
Colcemide HBSS/
0–10µM Thermo Fisher Scientific
Tubulin polymerization inhibitor; abolishes TNT
formation Defibrotide (Defitelio) Solution for infusion/
0–100µg/ml Gentium S.r.l. Inhibits MM cell adhesion with BM-MSCs [29]
Metformin HBSS/
0–150 mM Merck KGaA
OXPHOS inhibitor; interferes with TNT development
[4,13,30]
2.3. In Vitro Cytotoxicity Assay
Toxic effects of various drugs on BM-MSCs or MM cell monocultures, or their co- cultures, were determined with the high-content screening (HCS) method. Briefly, a 1× 10³ MSC/well and a 1× 10⁴ myeloma cell/well were seeded in the DMEM/F12 medium on 96-well plates in monocultures or co-cultures. Cells were incubated in the pres- ence or absence of different drugs for 72 h at 37◦C. After incubation, Hoechst 33,342 dye was added to each well in a final concentration of 100 ng/mL for 1 h in order to distin- guish between myeloma cells and stromal cells based on the size of the nucleus. Finally, 1µg/mL propidium iodide was added to each well. Results were evaluated using the CellReporterXpress Image Acquisition and Analysis Software (Molecular Devices, San Jose, CA, USA).
2.4. Mitochondrial Transfer Assay
Bone marrow mesenchymal stromal cells or myeloma cells were stained with Mito- tracker Red FM (Thermo Fisher Scientific) at a final concentration of 200 nM in 1X HBSS buffer at 37◦C for 15 min and then washed three times in 1X HBSS. BM-MSCs were seeded in a 24-well plate (Eppendorf, Hamburg, Germany) at a density of 2.5×10⁴cells/well, while stained myeloma cells were seeded into T75 flasks (Eppendorf). Both cell types were further cultured for 72 h at 37◦C, then the stained cells were washed again three times with 1 x HBSS buffer. Co-cultures were established with 1:10 ratio of BM-MSCs (2.5 × 10⁴cells/well): myeloma cells (2.5 × 10⁵ cells/well). MitoTracker-labeled BM- MSCs and unlabeled myeloma cells or MitoTracker-labeled myeloma cells and unlabeled BM-MSCs were seeded on 24-well plates and cells were incubated for different periods
Cancers2021,13, 3461 6 of 24
of time (2, 6, 12, 24, 48 h) with or without drug treatment (Supplementary Figure S1A).
After co-culturing, the cells were trypsinized, washed, and incubated with fluorescently labeled monoclonal antibodies to distinguish myeloma cells from stromal cells. Monoclonal antibodies, anti-CD146 Alexa Fluor 488 and anti-CD38 Alexa Fluor 488 (both purchased from BioLegend, San Diego, CA, USA) were used to distinguish Mitotracker unlabeled BM-MSCs and myeloma cells, respectively, from those of Mitotracker labeled co-cultured cells. MitoTracker red fluorescence was analyzed by a FACSCanto II flow cytometer (BD Biosciences).
2.5. Transwell Assay
Unlabeled BM-MSCs or MM cells were seeded into wells of 24-well plates (BD Bio- sciences) at a density of 2.5×10⁴or 5× 10⁵cells/well, respectively, and paired with MitoTracker Red-stained myeloma cells or BM-MSCs seeded into the transwell inserts (BD Falcon, 353096, 3µm pore size). After 1 or 2 days of co-culture in the presence or absence of chemotherapeutic drugs, unlabeled cells were measured for MitoTracker Red positivity by flow cytometry (Supplementary Figures S1B and S4).
2.6. Isolation of Microvesicles (MV) and Investigation of Their Role in Mitochondrial Delivery Bone marrow mesenchymal stromal cells and myeloma cells were stained with Mito- tracker Red FM and washed, as described previously. Both cell types were further cultured for 72 h and then washed twice. Fetal bovine serum of the growth medium was replaced by KnockOut Serum Replacement (Thermo Fisher Scientific) in order to avoid contamination with extracellular vesicles present in FBS. For MV production, both cell types were grown into the log phase. Microvesicles were isolated by the combination of differential centrifu- gation and gravity-driven filtration as follows: After the collection of the culture medium, cells were removed by centrifugation at 300×gfor 10 min, and thereafter, the cell debris was removed by 2000×gcentrifugation for 10 min. The supernatants were filtered by gravity through a 0.8µm syringe filter unit (Merck) to completely remove apoptotic bodies and centrifuged for 20 min at 12,500×gat room temperature (Supplementary Figure S1C).
The concentration of MV isolates was determined by TRPS analysis using a qNano device (IZON Science, Christchurch, New Zealand), as described previously [2]. Calibration was achieved using CPC400 calibration beads (IZON Science, Christchurch, New Zealand). At least 500 events were registered with a linear particle rate in time using NP400 nanopore membrane (IZON Science) stretched between 45 and 47 mm. The voltage was set to 0.2–0.34 V to achieve a stable average current (126–130 nA) with a low average RMS noise.
Microvesicles were stained with PKH67 membrane labeling dye (Merck). Microvesicle suspension derived from donor cells, the Mitotracker Red-stained BM-MSC or MM cells were cultured with recipient cells, unstained myeloma cells, or BM-MSCs, respectively, at 6×10⁴MVs/cell ratios for 24 h. The percentage of PKH67 and Mitotracker Red FM positive recipient cells was determined by flow cytometry.
2.7. Determination of Mitochondrial Superoxide Levels
The mitochondrial superoxide levels in monocultures or co-cultures were detected using the MitoSOX Red fluorogenic reagent (Thermo Fisher Scientific). Monocultures or co- cultures were trypsinized, washed with HBSS, and incubated in the MitoSOX Red (Thermo Fisher Scientific) working solution (5µM dye in HBSS) at 37◦C for 10 min. After washing the cells with prewarmed HBSS buffer thrice, cells were analyzed by flow cytometry.
2.8. Determination of Mitochondrial ATP Levels in Living Cells
Cells were plated in a monoculture or in an MM–BM-MSC co-culture for 24 h with or without drug treatment. After 24 h, MM cells or BM-MSCs were labeled with 10µM of BioTracker ATP-Red dye (Merck) for 15 min at 37◦C then washed thrice with PBS. ATP level was analyzed in the samples with flow cytometry.
2.9. Confocal Laser Scanning Microscopy
For confocal laser scanning microscopy,µ-Slide eight-well glass bottom imaging cham- bers (Ibidi, Gräfelfing, Germany) were coated with 10µg/cm2human plasma fibronectin (Merck, Darmstadt, Germany). Bone marrow mesenchymal stromal cells or myeloma cells were stained with Mitotracker Red FM, as described previously. Myeloma cells were labeled with Vybrant DiI cell-labeling solution (Thermo Fisher Scientific) as follows: cells were washed with PBS and then incubated with the prewarmed dye solution (5 mg DiI/mL in PBS) for 5 min at 37◦C. After incubation, the cells were washed thrice with culture medium. Myeloma cells (1×10⁵cells/cm2) were seeded on the imaging chambers and co- cultured with the stromal cells (1×10⁴cells/cm2) for 24 h. Mitotracker stained BM-MSCs or MM cells were co-cultured with unstained myeloma cells (labeled with Vybrant DiI) or BM-MSCs (labeled anti-CD146 eFluor 450), respectively. The imaging chambers were incu- bated in a heating and incubation system (Ibidi) during the whole process at 37◦C with 5%
CO2. Finally, the samples were examined with an Olympus FluoView 500 Laser Scanning Confocal Microscope (Shinjuku, Tokyo, Japan) with a 60×oil immersion objective and analyzed with FluoView application software (Ver. 05.00.110). For the experiments with fixed samples, co-cultures were fixed with 4% PFA solution for 10 min at room temperature.
Prior to and after fixation, cells were washed with dPBS buffer thrice. These samples were examined with a Zeiss LSM 780 Laser Scanning Confocal Microscope (Zeiss, Oberkochen, Germany), and data were analyzed with Zen 3.3 (blue edition) application software.
2.10. Live Imaging of Mitochondrial Transfer in Co-Cultures with High-Content Screening Method The process of mitochondrial transfer was investigated using time-lapse imaging using the ImageXpress Pico Automated Cell Imaging System (Molecular Devices). BM- MSCs were labeled with MitoTracker Red FM, as described previously, while myeloma cells were unlabeled. The number of mitotracker-positive myeloma cells was quantified using a 20×objective by analyzing 0.69 mm×0.69 mm areas (0.4761 mm2). The images were taken from the beginning of the establishment of the co-cultures for 1 h with an interval of 8311 ms. The time-lapse video thus consisted of a total of 434 images.
2.11. Lentiviral Gene Transfer
The lentiviral product identified as ‘Mitochondria Cyto-Tracer, pCT-Mito-GFP (CMV)’
was purchased from System Biosciences (Palo Alto, CA, USA). Primary myeloma cells and BM-stromal cells were transduced with lentiviral particles delivering sequences that expressed fluorescent protein tags (AcGFP1) targeted specifically to the mitochondria (Supplementary Figure S7). Both cell types were transduced with pCT-Mito-GFP at a multiplicity of infection (MOI) of approximately 10 (BM-MSC) and 25 (MM). GFP-positive stromal cells and myeloma cells were sorted by FACSAria flow cytometer (BD Biosciences).
2.12. Statistical Evaluation
The data are presented as the mean of three repeated experiments of biological paral- lels±SD. Statistical differences were evaluated using Student’st-test.pvalues < 0.05 were accepted as significant.
3. Results
3.1. Effect of BM-MSCs on MM Cells’ Survival in the Presence of Toxic Concentration of Various Drugs
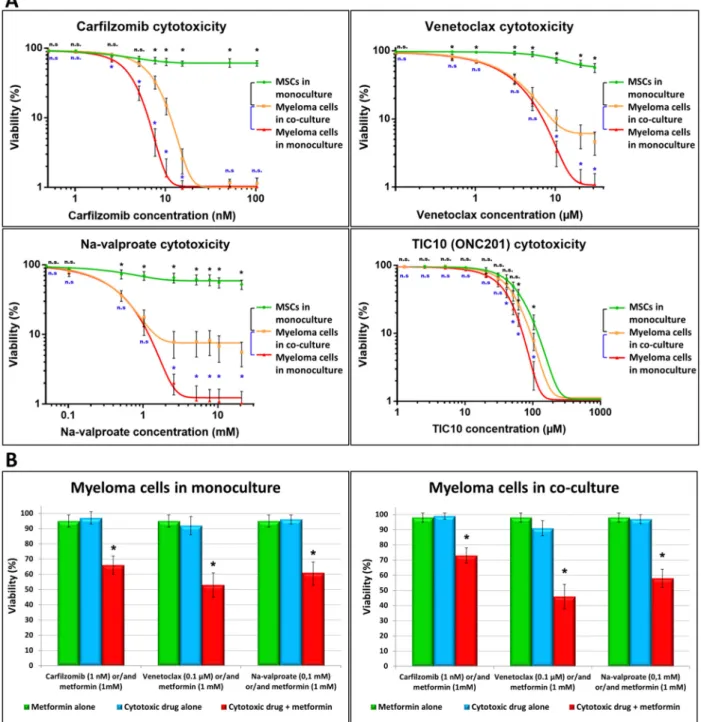
To determine the cytotoxicity of different drugs on primary myeloma cell cultures, we examined the effect of various drugs on the viability of myeloma cells and bone marrow stromal cells both in monocultures and BM-MSC–MM co-cultures (Figure1A). Cell cultures were treated with the proteasome inhibitor carfilzomib (0–100 nM), the BCL-2 inhibitor venetoclax (0–13µM), the histone deacetylase inhibitor sodium-valproate (0–11 mM), and the mitochondrion-damaging TIC10 (0–100µM) at various drug concentrations.
Cancers2021,13, 3461 8 of 24
Cancers 2021, 13, x FOR PEER REVIEW 9 of 25
Figure 1. Effect of BM-MSCs on the cytotoxicity of drugs exerted on MMs. Cells (1 × 10³ BM-MSC/well, 1 × 10⁴ myeloma cell/well in monocultures or MM–BM-MSC co-cultures) were incubated for 72 h in the absence or presence of various drugs then labeled with Hoechst 33,342 and propidium iodide. Cell death was analyzed with a high-content screening method using an automated digital microscope system (A and B). (A) Cytotoxicity of different concentrations carfilzomib, venetoclax, Na-valproate, and TIC10 was determined in MMs (red line) and BM-MSC (green line) monocultures or MM ̶ BM-MSC (orange line) co-cultures. (B) The drugs (blue columns) carfilzomib (1nM), venetoclax (0.1 µM), Na-valproate (0.1 mM), and metformin (1 mM, green column) were added to the MM monoculture (left graph) or MM ̶ BM-MSC co- culture (right graph) alone or in combination (red column). These results are representative of three independent experi- ments for one patient. The values are presented as mean ± standard deviation, p values < 0.05 were considered significant (*) while p values > 0.05 were considered non-significant (n.s.).
The low concentrations of the drugs carfilzomib (1 nM), venetolax (0.1 µM), Na- valproate (0.1 mM), and TIC10 (10 µM) were not toxic to either MMs or BM-MSCs. The presence of higher concentrations of any of the drugs resulted in a steep decrease in the viability of MMs, and the highest concentrations, 100 nM of carfilzomib, 30 µM of vene- tolax, 20 mM of Na-valproate, and 100 µM of TIC10) left no cells alive in the MM cultures.
Figure 1.Effect of BM-MSCs on the cytotoxicity of drugs exerted on MMs. Cells (1×10³BM-MSC/well, 1×10⁴myeloma cell/well in monocultures or MM–BM-MSC co-cultures) were incubated for 72 h in the absence or presence of various drugs then labeled with Hoechst 33,342 and propidium iodide. Cell death was analyzed with a high-content screening method using an automated digital microscope system (A and B). (A) Cytotoxicity of different concentrations carfilzomib, venetoclax, Na-valproate, and TIC10 was determined in MMs (red line) and BM-MSC (green line) monocultures or MM–BM-MSC (orange line) co-cultures. (B) The drugs (blue columns) carfilzomib (1nM), venetoclax (0.1µM), Na-valproate (0.1 mM), and metformin (1 mM, green column) were added to the MM monoculture (left graph) or MM–BM-MSC co-culture (right graph) alone or in combination (red column). These results are representative of three independent experiments for one patient.
The values are presented as mean±standard deviation,pvalues < 0.05 were considered significant (*) whilepvalues > 0.05 were considered non-significant (n.s.).
The low concentrations of the drugs carfilzomib (1 nM), venetolax (0.1µM), Na- valproate (0.1 mM), and TIC10 (10µM) were not toxic to either MMs or BM-MSCs. The presence of higher concentrations of any of the drugs resulted in a steep decrease in the
viability of MMs, and the highest concentrations, 100 nM of carfilzomib, 30µM of venetolax, 20 mM of Na-valproate, and 100µM of TIC10) left no cells alive in the MM cultures. On the contrary, BM-MSCs were resistant to the drugs even in the highest concentrations, except TIC10, which showed similar toxicity to BM-MSCs as it did to MMs. BM-MSCs affected drug-induced death of the MMs. In the co-culture, BM-MSCs efficiently protected MMs from apoptosis caused by carfilzomib and a high concentration of the drugs venetoclax and Na-valproate. Although large differences in cytotoxicity were observed between co- cultures derived from different donors, the following trend was evident for all cell cultures:
in the presence of carfilzomib, BM-MSCs effectively protected MM cells from apoptosis at all concentrations toxic to the MM cells. In contrast, in the presence of venetoclax and na-valproate, this protective effect occurred only at high drug concentrations. As TIC10 inhibited mitochondrial functions of both MMs and BM-MSCs, this drug had little effect on MM survival. Therefore, this drug was omitted from the further experiments.
Recently, antibodies have been introduced as biological treatments in MM therapy [23–28,31]. The therapeutical antibodies Daratumumab (CD38), Isatuximab (CD38), and Elotuzumab (CD139) were tested regarding their cytotoxic effects on MMs in concen- trations found in the sera of patients found after therapy [32]. None of these antibodies were toxic to MMs or BM-MSCs in monocultures or co-cultures (Supplementary Figure S2).
Pharmacological approaches shifting the metabolism of leukemic cells toward lower oxidative phosphorylation significantly enhance the effect of anti-leukemic drugs [13].
Therefore, we tested the cytotoxic effect of metformin, an agent inhibiting oxidative phos- phorylation [13,30], in combination with carfilzomib, venetoclax, and Na-valproate, on MM monocultures or BM-MSC–MM co-cultures. As shown in Figure1B, even the non-toxic dose of metformin significantly reduced the viability of MMs in both monocultures and co-cultures when used together with a non-toxic dose of chemotherapeutic drugs (carfil- zomib, venetoclax, Na-valproate). BM-MSCs in co-cultures did not affect appreciably MMs’
survival in the presence of these drug combinations despite the escalating bidirectional MT.
3.2. Mitochondrial Transfer between BM-Mscs and Mms in the Presence of Chemotherapeutic Drugs and Therapeutic Antibodies
To understand the mechanism by which BM-MSCs prevent MMs from drug-induced cytotoxicity, mitochondrial transfer (MT) was followed between BM-MSCs and MMs in the presence or absence of various cytotoxic drugs at different time points (Figure2).
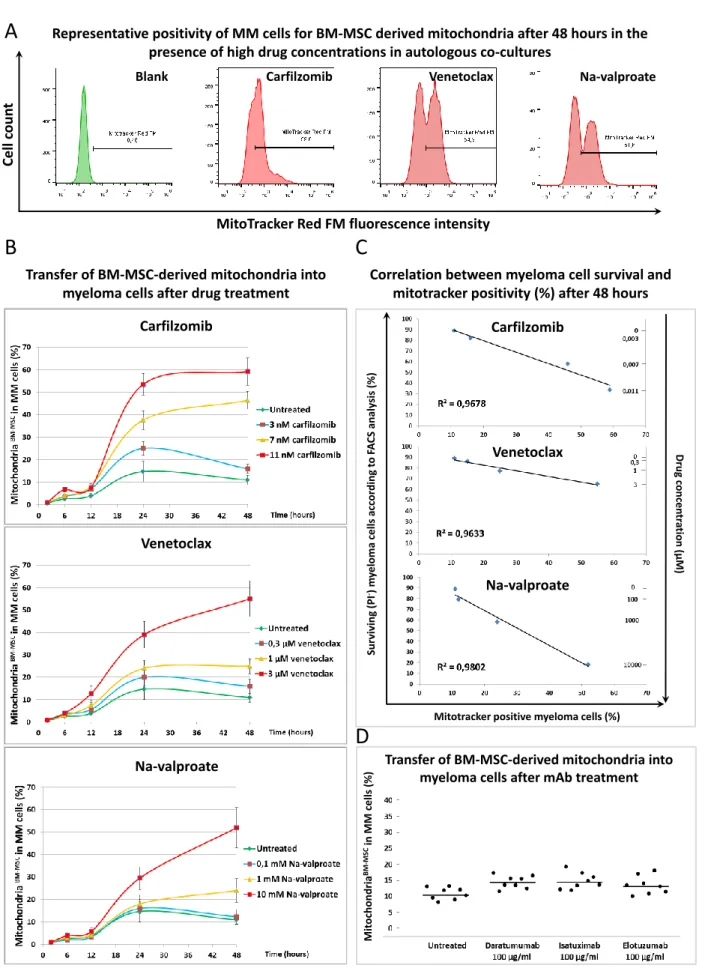
BM-MSC-derived mitochondria (labeled with Mitotracker Red FM dye) transferred into MMs (gated using CD38 antibody) even without any drug treatment, an average of 8–15%
of MMs were positive for BM-MSC-derived mitochondria after 48 h of co-culture. The gating strategy for FACS analysis of mitochondrial transfer is shown in Supplementary Figure S8. All drugs increased the uptake of BM-MSC-derived mitochondria by MMs. The time course of the MT in the presence or absence of various drug concentrations showed that no transfer was observed in up to 12 h of the co-culture (Figure2B). Between 12 and 24 h, MT sharply increased when using the highest concentration of the drugs. Then, up to 48 h, the presence of the highest concentrations of the drugs affected the transfer of BM-MSC-derived mitochondria into MMs differently. MT, stimulated by 11 nM of the proteasome inhibitor carfilzomib, reached a plateau or a very slight increase, respectively, while it was elevated in the presence of 3µM of venetoclax (BCL-2 inhibitor) or 10 mM of Na-valproate (histone deacetylase inhibitor).
Cancers2021,13, 3461 10 of 24
B
Transfer of BM-MSC-derived mitochondria into myeloma cells after drug treatment
Cell count
MitoTracker Red FM fluorescence intensity
Representative positivity of MM cells for BM-MSC derived mitochondria after 48 hours in the presence of high drug concentrations in autologous co-cultures
A
Blank Carfilzomib Venetoclax Na-valproate
C
D
Na-valproate
Surviving(PI-) myelomacellsaccordingtoFACS analysis(%)
Correlation between myeloma cell survival and mitotracker positivity (%) after 48 hours
Mitotracker positive myeloma cells (%)
Drugconcentration(µM)
Venetoclax
Na-valproate Carfilzomib
Transfer of BM-MSC-derived mitochondria into myeloma cells after mAb treatment
MitochondriaBM-MSCinMM cells(%)
Venetoclax Carfilzomib
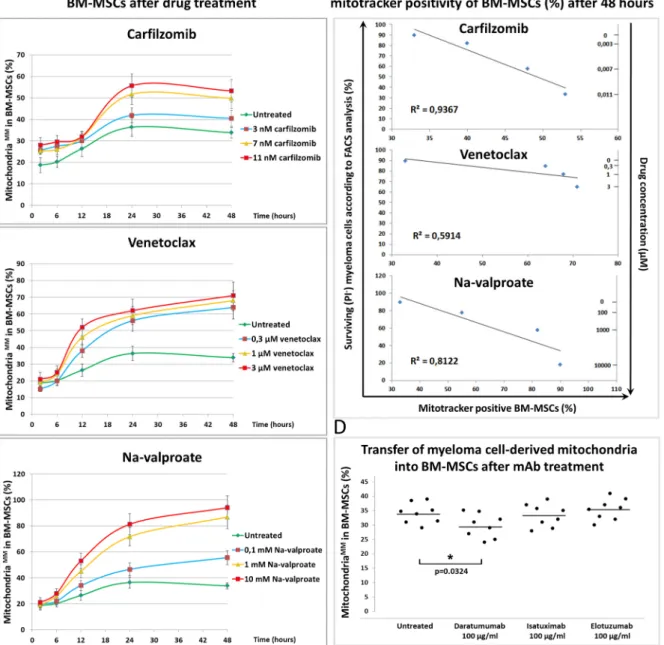
Figure 2.Mitochondrial transfer from bone marrow stromal cells to myeloma cells in the presence of chemotherapeutic drugs and therapeutic antibodies. (A) BM-MSCs were labeled with Mitotracker Red FM then co-cultured with MMs for 48 h in the presence or absence of the highest concentrations of each drug: 3µM of venetoclax, 10 mM of Na-valproate, and 11 nM of carfilzomib. BM-MSC-derived mitochondria+MMs were analyzed by flow cytometry within the CD38+myeloma
cell population. (B) Unlabeled MMs and Mitotracker Red FM-labeled BM-MSCs were co-cultured for 2, 6, 12, 24, and 48 h in the presence or absence of carfilzomib (3, 7, or 11 nM), venetoclax (0.3, 1, or 3µM), Na-valproate (0.1, 1, or 10 mM), and mitochondrial transfer from BM-MSCs to MMs was analyzed as described under (A). (C) Correlation between survival of MMs and content of BM-MSC-derived mitochondria in the surviving MMs was evaluated in the presence or absence of different drug concentrations: 3, 7, or 11 nM of carfilzomib; 0.3, 1, or 3µM of venetoclax; 0.1, 1, or 10 mM of Na-valproate.
(D) The effect of therapeutic antibodies on mitochondrial transfer from BM-MSCs to MMs after 48 h of co-culture was analyzed as described under (A). The results of (A–C) panels are representative of three independent experiments for one patient. Panel (D) represents the averages of three independent experiments for 8 patients.
The effects of lower concentrations of the drugs showed concentration dependence regarding MT from BM-MSCs to MMs (Figure2B). The positivity of MMs for BM-MSC- derived mitochondria in the presence of the highest drug concentrations after 48 h of co-culture is shown in Figure2A. An unambiguous correlation was found between the survival of MMs, the amount of drugs added, and the BM-MSC-derived mitochondrial incorporation of the surviving myeloma cells. An increased amount of various drugs induced increased cell death of MMs; however, the surviving cells incorporated an in- creasing amount of BM-MSC-derived mitochondria (Figure2C). These results suggest that BM-MSC-derived mitochondria served as a survival signal for the malignant plasma cells, and hence MMs were more resistant to the cytotoxic effect of the drugs used. Ther- apeutic antibodies did not exert a cytotoxic effect on MMs (Supplementary Figure S2), and, as expected, these non-toxic monoclonal antibodies did not attenuate the transfer of BM-MSC-derived mitochondria to MMs (Figure2D).
To test whether the unidirectional transfer of mitochondria from BM-MSCs to MMs or bidirectional exchange occurred between the two cell types, MT from MMs to BM-MSCs were examined by analyzing MM cell-derived mitochondria in CD146+BM-MSCs after 48 h of co-cultures in the presence of various drugs. The gating strategy for FACS analysis of mitochondrial transfer is shown in Supplementary Figure S8. A large amount (55–90% of recipient cells were positive) of MM cell-derived mitochondria was detected in BM-MSCs (Figure3A) depending on the drug used. On the other hand, MT from MMs to BM-MSCs was detected as early as 2 h after treatment of the co-cultures with drugs since 15–30% of BM-MSCs became positive for MM cell-derived mitochondria (Figure3B). Note that MT in the opposite direction (from BM-MSCs to MMs) remained under 5% at this early time point (Figure2B). The early (2 h of co-culture) incorporation of mitochondria by BM-MSCs indicated that this transfer mechanism may occur via endocytosis of MMs undergoing an early apoptotic phase induced by drug cytotoxicity. This assumption was supported by the finding that 60% of the BM-MSCs were able to phagocytose apoptotic tumor cells as early as 3 h after induction of apoptosis [33].
Between 6 and 12 h, the stromal cells showed a continuous elevation of incorporation of MM cell-derived mitochondria in the presence of any concentrations of all drugs and then reached a plateau for up to 48 h of co-culture in a drug dose-dependent fashion (Figure3B).
A strong correlation was found between the mortality of MMs (drug cytotoxicity), MM cell- derived mitochondrial incorporation by the BM-MSCs, and the used drug concentrations.
The more MMs died upon treatment with increasing amounts of drugs, the more MM cell- derived mitochondria appeared in BM-MSCs (Figure3C). Therapeutic antibodies did not inhibit MT from BM-MSC to MMs (Figure2D) except Daratumumab, which significantly decreased the amount of transferred mitochondria from MMs to BM-MSCs (Figure3D).
Cancers2021,13, 3461 12 of 24
Cancers 2021, 13, x FOR PEER REVIEW 13 of 25
Figure 3. Mitochondrial transfer from myeloma cells to bone marrow stromal cells in the presence of chemotherapeutic drugs and therapeutic antibodies. (A) MMs were labeled with Mitotracker Red FM then co-cultured with BM-MSCs for 48 h in the presence or absence of the highest concentrations of each drug: 3 µM of venetoclax, 10 mM of Na-valproate, and 11 nM of carfilzomib. MM cell-derived mitochondria+ BM-MSCs were analyzed by flow cytometry within the CD146+ BM-MSC population. (B) Mitotracker Red FM-labeled MMs and BM-MSCs were co-cultured for 2, 6, 12, 24, and 48 h in the presence or absence of carfilzomib (3, 7, or 11 nM), venetoclax (0.3, 1, or 3 µM), Na-valproate (0.1, 1, or 10 mM), and Figure 3.Mitochondrial transfer from myeloma cells to bone marrow stromal cells in the presence of chemotherapeutic drugs and therapeutic antibodies. (A) MMs were labeled with Mitotracker Red FM then co-cultured with BM-MSCs for 48 h in the presence or absence of the highest concentrations of each drug: 3µM of venetoclax, 10 mM of Na-valproate, and 11 nM of carfilzomib. MM cell-derived mitochondria+BM-MSCs were analyzed by flow cytometry within the CD146+
BM-MSC population. (B) Mitotracker Red FM-labeled MMs and BM-MSCs were co-cultured for 2, 6, 12, 24, and 48 h in the presence or absence of carfilzomib (3, 7, or 11 nM), venetoclax (0.3, 1, or 3µM), Na-valproate (0.1, 1, or 10 mM), and mitochondrial transfer from BM-MSCs to MMs was analyzed as described under (A). (C) The correlation between MM cell survival and content of MM cell-derived mitochondria in BM-MSCs was evaluated in the presence or absence of different drug concentrations: 3, 7, or 11 nM carfilzomib; 0.3, 1, or 3µM venetoclax; 0.1, 1, or 10 mM Na-valproate. (D) The effect of therapeutic antibodies on mitochondrial transfer from MMs to BM-MSCs after 48 h of co-culture was analyzed as described under (A). The results of (A–C) panels are representative of three independent experiments for one patient. Panel (D) represents the averages of three independent experiments for 8 patients. The values are presented as mean±standard deviation,pvalues < 0.05 were considered significant (*).
3.3. Mitochondrial Transfer in Transwell Experiments and the Role of Microvesicles in the Intercellular Mitochondrial Transfer
Mitochondrial transfer between different cells may occur by direct cell-to-cell contact or by endocytosis of mitochondria containing vesicles. To determine the mechanism of MT, the mitochondrial transfer assays were performed in transwell chambers. Unlabeled recipient cells (BM-MSCs or MMs) were seeded into the bottom of 24-well plates, while MitoTracker-stained donor cells (MMs or BM-MSCs, respectively) were seeded into the transwell inserts (Supplementary Figure S1). No MT was detected in either direction after 2 days in transwell cultures, indicating that MT required direct cell–cell contact (Supplementary Figure S3).
However, when microvesicles (MVs) were isolated from the supernatant of MitoTracker- labeled BM-MSCs or MMs and incubated with unlabeled MMs or BM-MSCs (5×10⁴MV/cell on average), respectively, different results were obtained. The isolated MVs were always labeled with the PKH67 membrane labeling kit before incubating with the unlabeled re- cipient cells in order to determine whether the recipient cells are able to incorporate the donor cell-derived MVs or not. After 24 or 48 h of co-culture, MMs did not accumulate considerable amounts of membrane components from PKH67-labeled MVs derived from BM-MSCs, and, accordingly, MMs did not accumulate BM-MSC-derived mitochondria (Supplementary Figure S4A). In contrast, after the fluorescently labeled MV treatment, most of the acceptor BM-MSCs was highly positive for the fluorescent membrane labeling dye and also for MM cell-derived mitochondria indicating that BM-MSCs are capable of incorporating microvesicles released from MMs (Supplementary Figure S4B).
In summary, MVs have no role in horizontal mitochondrial transfer using phys- iological cell/MV ratios, as shown in the transwell experiments. Although MMs are unable to incorporate MVs of BM-MSC origin even when incubated with large amounts of MVs (5×10⁴MV/cell on average), stromal cells are unquestionably able to incorporate mitochondria-containing MVs released by MMs when incubated with concentrated MVs.
3.4. Determination of Mitochondrial Superoxide Levels
One of the effects of cytotoxic drugs on myeloma cells is triggering the production of free radicals in their mitochondria. Indeed, all used drugs induced an increase in free radicals in MMs in monocultures (Figure4A). When we used a higher concentration of the drugs, the presence of BM-MSCs in co-cultures significantly decreased the amount of free radicals in MMs (Figure4A).
In contrast, none of the treatment of BM-MSCs with drugs resulted in a free radical increase in BM-MSC monocultures, while in co-cultures with MMs, free radical levels increased significantly in the presence of Na-valproate and non-significantly in the pres- ence of carfilzomib or venetoclax (Figure4B). The increase in free radical levels in BM- MSCs in co-cultures was explained by the incorporation of MM cell-derived mitochondria by BM-MSCs.
CancersCancers 2021, 13, x FOR PEER REVIEW 2021,13, 3461 14 of 2415 of 25
Figure 4. Mitochondrial superoxide levels in MMs and BM-MSCs. The cells were treated with various drugs in mono- or co-cultures and cultured for 24 h (A,B). After washing, all cells of the co-cultures were labeled with MitoSOX Red for 10 min at 37 °C. After subsequent washing, superoxide levels were analyzed by flow cytometry within the CD38+ MM cell population (A) or within the CD146+ BM-MSC population (B) using anti-CD38 Alexa Fluor 488 or anti-CD146 Alexa Fluor 488 monoclonal antibodies, respectively. The values are presented as mean ± standard deviation, p values < 0.05 were considered significant (*) while p values > 0.05 were considered non-significant (n.s.). The results are representative of three independent experiments for one patient.
In contrast, none of the treatment of BM-MSCs with drugs resulted in a free radical increase in BM-MSC monocultures, while in co-cultures with MMs, free radical levels in- creased significantly in the presence of Na-valproate and non-significantly in the presence of carfilzomib or venetoclax (Figure 4B). The increase in free radical levels in BM-MSCs in co-cultures was explained by the incorporation of MM cell-derived mitochondria by BM- MSCs.
3.5. Determination of ATP Levels
Chemotherapeutic drugs, which affected cell survival, mitochondrial transfer, and mitochondrial functions, might also change energy, e.g., ATP production. In myeloma Figure 4.Mitochondrial superoxide levels in MMs and BM-MSCs. The cells were treated with various drugs in mono- or co-cultures and cultured for 24 h (A,B). After washing, all cells of the co-cultures were labeled with MitoSOX Red for 10 min at 37◦C. After subsequent washing, superoxide levels were analyzed by flow cytometry within the CD38+MM cell population (A) or within the CD146+BM-MSC population (B) using anti-CD38 Alexa Fluor 488 or anti-CD146 Alexa Fluor 488 monoclonal antibodies, respectively. The values are presented as mean±standard deviation,pvalues < 0.05 were considered significant (*) whilepvalues > 0.05 were considered non-significant (n.s.). The results are representative of three independent experiments for one patient.
3.5. Determination of ATP Levels
Chemotherapeutic drugs, which affected cell survival, mitochondrial transfer, and mitochondrial functions, might also change energy, e.g., ATP production. In myeloma monocultures, mitochondrial ATP levels significantly decreased after carfilzomib treatment, while they showed little or no change upon venetoclax or Na-valproate treatment compared to untreated MMs (Figure5A).
Cancers2021,13, 3461 monocultures, mitochondrial ATP levels significantly decreased after carfilzomib treat-15 of 24
ment, while they showed little or no change upon venetoclax or Na-valproate treatment compared to untreated MMs (Figure 5A).
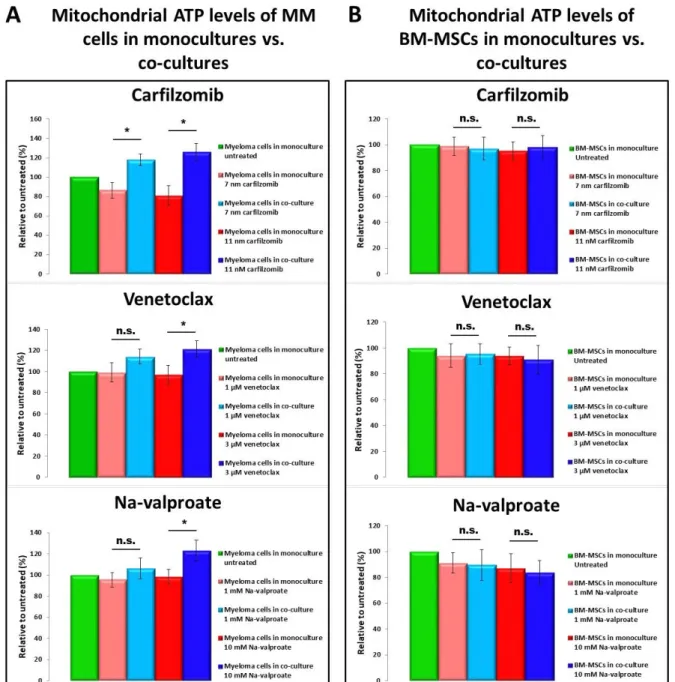
Figure 5. Mitochondrial ATP levels in MMs and BM-MSCs. BM-MSCs (B) or MMs (A) were plated in monocultures or in co-cultures and incubated for 24 h in the presence or absence of various drugs. After washing, cells were labeled with BioTracker ATP-Red for 15 min at 37 °C. Finally, after subsequent washing, ATP levels were analyzed by flow cytometry within the CD38+ MM cell population (A) or within the CD146+ BM-MSC population (B) using anti-CD38 Alexa Fluor 488 or anti-CD146 Alexa Fluor 488 monoclonal antibodies, respectively. The values are presented as mean ± standard devia- tion, p values < 0.05 were considered significant (*) while p values > 0.05 were considered non-significant (n.s.). The results are representative of three independent experiments for one patient.
None of the drugs affected ATP production by BM-MSCs (Figure 5B) significantly, but the mitochondrial ATP level of stromal cells slightly decreased after drug treatment.
Co-culturing MMs with BM-MSCs resulted in significant increase in mitochondrial ATP levels in MMs compared to the corresponding MM monocultures (Figure 5A), supporting the view, that ‘healthy’ BM-MSC-derived mitochondria serve as an ATP source for MMs.
Figure 5. Mitochondrial ATP levels in MMs and BM-MSCs. BM-MSCs (B) or MMs (A) were plated in monocultures or in co-cultures and incubated for 24 h in the presence or absence of various drugs. After washing, cells were labeled with BioTracker ATP-Red for 15 min at 37◦C. Finally, after subsequent washing, ATP levels were analyzed by flow cytometry within the CD38+MM cell population (A) or within the CD146+BM-MSC population (B) using anti-CD38 Alexa Fluor 488 or anti-CD146 Alexa Fluor 488 monoclonal antibodies, respectively. The values are presented as mean±standard deviation, pvalues < 0.05 were considered significant (*) whilepvalues > 0.05 were considered non-significant (n.s.). The results are representative of three independent experiments for one patient.
None of the drugs affected ATP production by BM-MSCs (Figure5B) significantly, but the mitochondrial ATP level of stromal cells slightly decreased after drug treatment.
Co-culturing MMs with BM-MSCs resulted in significant increase in mitochondrial ATP levels in MMs compared to the corresponding MM monocultures (Figure5A), supporting the view, that ‘healthy’ BM-MSC-derived mitochondria serve as an ATP source for MMs.
Contrarily, myeloma cells did not affect mitochondrial ATP levels of BM-MSCs in co- cultures in the presence of drugs (Figure5B).
Cancers2021,13, 3461 16 of 24
3.6. Confocal Laser Scanning Microscopy of BM-MSC–MM Co-Cultures
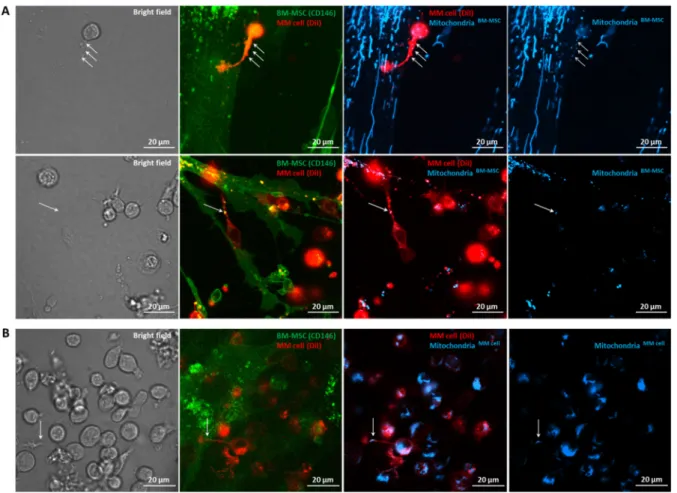
To clarify the mechanisms responsible for mitochondrial transfer between human primary BM-MSCs and myeloma cells, we analyzed the co-cultures with confocal laser scanning microscopy. Previous studies showed that transfer of mitochondria from non- malignant stromal cells into malignant cells and/or the transfer of damaged mitochondria to the stromal cells occurred via tunneling nanotubes [7–11,20]. Hence, we analyzed the role of tunneling nanotubes in MT between primary BM-MSCs and MMs. The stromal cells and myeloma cells were distinguished with anti-CD146 eFluor 450 conjugated antibody and Vybrant DiI membrane-labeling dye, respectively. The mitochondria of the donor cells were labeled with Mitotracker Red FM dye, and after 24 h of co-culture, the transfer of these organelles into the recipient cells was investigated (Figure6). Mitochondrial transfer was visualized both from BM-MSC to MMs (Figure6A) and from MMs to BM- MSC (Figure6B) through MM cell-derived tunneling nanotubes indicated by white arrows;
hence, we can clearly state that myeloma cell-derived TNTs play an important role in mitochondrial delivery in both directions. In contrast, no organelle transfer was detected in either direction via BM-MSC-derived TNTs.
Cancers 2021, 13, x FOR PEER REVIEW 17 of 25
Contrarily, myeloma cells did not affect mitochondrial ATP levels of BM-MSCs in co-cul- tures in the presence of drugs (Figure 5B).
Figure 6. Visualization of tunneling nanotubes (TNTs) during mitochondrial transfer between BM-MSCs and MMs with confocal laser scanning microscopy. BM-MSCs and MMs were labeled with anti-CD146 conjugated with eFluor 450 (green) or with Vybrant DiI membrane-labeling dye (red), respectively (A,B). The mitochondria in BM-MSCs (A) or MMs (B) were stained with MitoTracker Red FM dye (blueish). MitoTracker Red FM-labeled BM-MSCs (A) or MMs (B) were co-cultured for 24 h with the recipient cells. A and B, left, show the bright field images of BM-MSC–MM co-cultures. The second column images show overlaps between BM-MSCs and MMs; the third column images show overlaps between BM-MSC- derived mitochondria in BM-MSCs and MMs (A) or MM cell-derived mitochondria in MMs and in BM-MSCs (B), and images on the right show BM-MSC-derived mitochondria (A) or MM cell-derived mitochondria (B). White arrows show the mitochondrial transfer from BM-MSCs to MMs (A) or from MMs to BM-MSCs (B) through MM cell-derived TNTs.
3.6. Confocal Laser Scanning Microscopy of BM-MSC–MM Co-Cultures
To clarify the mechanisms responsible for mitochondrial transfer between human primary BM-MSCs and myeloma cells, we analyzed the co-cultures with confocal laser scanning microscopy. Previous studies showed that transfer of mitochondria from non- malignant stromal cells into malignant cells and/or the transfer of damaged mitochondria to the stromal cells occurred via tunneling nanotubes [7–11,20]. Hence, we analyzed the role of tunneling nanotubes in MT between primary BM-MSCs and MMs. The stromal cells and myeloma cells were distinguished with anti-CD146 eFluor 450 conjugated anti- body and Vybrant DiI membrane-labeling dye, respectively. The mitochondria of the do- nor cells were labeled with Mitotracker Red FM dye, and after 24 h of co-culture, the trans- fer of these organelles into the recipient cells was investigated (Figure 6). Mitochondrial transfer was visualized both from BM-MSC to MMs (Figure 6A) and from MMs to BM- MSC (Figure 6B) through MM cell-derived tunneling nanotubes indicated by white ar- rows; hence, we can clearly state that myeloma cell-derived TNTs play an important role Figure 6.Visualization of tunneling nanotubes (TNTs) during mitochondrial transfer between BM-MSCs and MMs with confocal laser scanning microscopy. BM-MSCs and MMs were labeled with anti-CD146 conjugated with eFluor 450 (green) or with Vybrant DiI membrane-labeling dye (red), respectively (A,B). The mitochondria in BM-MSCs (A) or MMs (B) were stained with MitoTracker Red FM dye (blueish). MitoTracker Red FM-labeled BM-MSCs (A) or MMs (B) were co-cultured for 24 h with the recipient cells. A and B, left, show the bright field images of BM-MSC–MM co-cultures. The second column images show overlaps between BM-MSCs and MMs; the third column images show overlaps between BM-MSC-derived mitochondria in BM-MSCs and MMs (A) or MM cell-derived mitochondria in MMs and in BM-MSCs (B), and images on the right show BM-MSC-derived mitochondria (A) or MM cell-derived mitochondria (B). White arrows show the mitochondrial transfer from BM-MSCs to MMs (A) or from MMs to BM-MSCs (B) through MM cell-derived TNTs.
3.7. Effects of Different Inhibitors on Mitochondrial Transfer
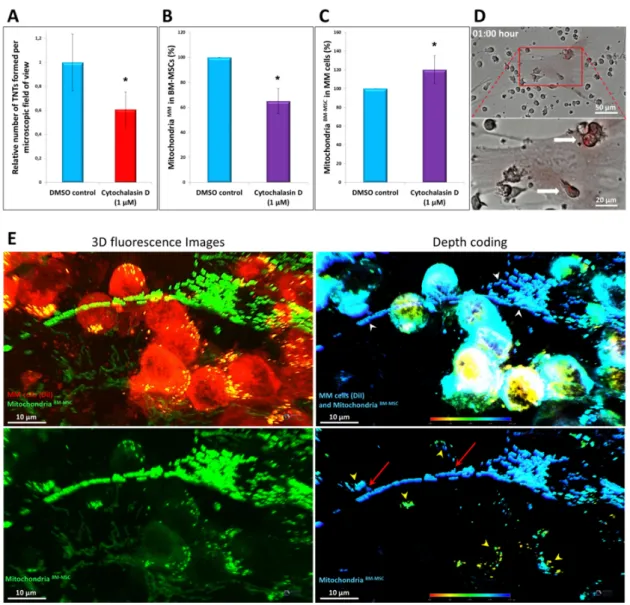
According to the literature, the exclusive role of TNTs in mediating bidirectional mitochondrial transfer has not yet been clearly demonstrated. Therefore, cytochalasin D, an inhibitor of actin polymerization, was used to block TNT formation between the stromal cells and MMs. Cytochalasin D significantly inhibited mitochondrial transfer from MMs to BM-MSCs by an average of 35% (Figure7B) and also significantly impeded TNT formation since it reduced the number of TNTs linking BM-MSCs and myeloma cells by up to 40%
on average (Figure7A). However, mitochondrial delivery from BM-MSCs to MMs was not affected by this compound. Consequently, cytochalasin D was shown to inhibit TNTs, but, importantly, while it inhibited MT from MMs to BM-MSC, it did not block MT from BM-MSC to MMs (Figure7C).
These results indicated that MT may differ in its mechanism depending on its di- rection. Therefore, other inhibitors, colcemid, dynasore, EIPA, 18-α-GA, defibrotide, and metformin, affecting cell shape, cell–cell interaction junctions, microvesicle endocytosis, macropinocytosis, and cell metabolism, were used to analyze the mechanism of MT in one direction (from BM-MSC to MM) or the other (from MM to BM-MSC) (see details in Table2). Mitochondrial transfer between BM-MSCs and myeloma cells was not affected by any of these inhibitors because none of these compounds was able to reduce MT either from stromal cells to myeloma cells or vice versa in co-culture experiments. To under- stand the process of MT from BM-MSC to MMs, time-lapse imaging was carried out with a digital microscope system (high content screening). The images showed that within 1 h of the establishment of the co-cultures, myeloma cells tightly adhered to BM-MSCs, and some MMs contained stromal cell-derived mitochondria (Figure7D and Supplemen- tary Figure S5). Since 1 h is likely not sufficient for TNT formation, stabilization, and mitochondrial transfer through these membrane structures, we hypothesized that MT from BM-MSCs to MMs must use another transfer mechanism as well as that from MMs to BM-MSCs. The other possible mechanism of mitochondrial transfer from BM-MSCs to MMs may be cell-projection pumping: a mechanism possibly supported by a recent publication, where hydrodynamic cytoplasmic transfer and organelle transfer occurred between human fibroblasts and malignant cells via this pathway [34]. In order to confirm this hypothesis, 3D analysis of co-cultures with confocal scanning microscopy was carried out using transgenic BM-MSCs expressing the AcGFP1 fluorescence protein specifically tagged to the mitochondria.
These BM-MSCs were modified with a lentiviral transfection system (Supplementary Figure S7). As shown in Figure7E, the MT occurred at the tight adhesion areas between the stromal cell and the MMs indicated by red arrows. In the case of the MM cells indicated by red arrows, it can be seen how the membrane protrusions of the myeloma cell surround the long projection of the stromal cell where the BM-MSC-derived mitochondria enter the MM cell through these cytoplasmic protrusions. It was also possible to observe how the apical surface of the MM cell attaches to the projection of BM-MSC where the mitochondrial transfer appears towards the malignant cell.
In the final experiments, to exclude any possible technical problem with mitochondrial staining method, MT was analyzed on one selected autologous myeloma cell culture modified with the foregoing lentiviral transfection system. Primary BM-MSCs or MMs were transduced with lentiviral particles delivering sequences that expressed mitochondria- targeted fluorescent protein tags (AcGFP1), and then these cells were co-cultured with control recipient MMs or BM-MSCs, respectively. Similar tendencies of MT were detected in the transfer in both directions in the presence of chemotherapeutic drugs, therapeutical antibodies, and cytochalasin D to those obtained with Mitotracker Red FM (Supplementary Figure S6). These results validated our data regarding TNT and MT analysis.
Cancers2021,13, 3461 18 of 24
Cancers 2021, 13, x FOR PEER REVIEW 18 of 25
in mitochondrial delivery in both directions. In contrast, no organelle transfer was de- tected in either direction via BM-MSC-derived TNTs.
3.7. Effects of Different Inhibitors on Mitochondrial Transfer
According to the literature, the exclusive role of TNTs in mediating bidirectional mi- tochondrial transfer has not yet been clearly demonstrated. Therefore, cytochalasin D, an inhibitor of actin polymerization, was used to block TNT formation between the stromal cells and MMs. Cytochalasin D significantly inhibited mitochondrial transfer from MMs to BM-MSCs by an average of 35% (Figure 7B) and also significantly impeded TNT for- mation since it reduced the number of TNTs linking BM-MSCs and myeloma cells by up to 40% on average (Figure 7A). However, mitochondrial delivery from BM-MSCs to MMs was not affected by this compound. Consequently, cytochalasin D was shown to inhibit TNTs, but, importantly, while it inhibited MT from MMs to BM-MSC, it did not block MT from BM-MSC to MMs (Figure 7C).
Figure 7. High-resolution 3D analysis of mitochondrial transfer using confocal laser scanning microscopy and the effect of cytochalasin D on mitochondrial transfer and TNT formation. BM-MSCs were labeled with MitoTracker Red FM (A–
D); BM-MSCs were expressing mitochondrial-targeted AcGFP1 fluorescence protein (E). MMs were unlabeled (B,C) or were labeled with Vybrant DiI membrane-labeling dye (A,E). The cells were kept in co-cultures for 1 h (D) or 24 h (A–C,E) in the presence (A–C) or absence (D,E) of cytochalasin D. Mitochondrial transfer from BM-MSC to MMs was evaluated with a high-content screening method (D), flow cytometry (B,C), or confocal scanning microscopy (A,E), respectively. (A) Figure 7.High-resolution 3D analysis of mitochondrial transfer using confocal laser scanning microscopy and the effect of cytochalasin D on mitochondrial transfer and TNT formation. BM-MSCs were labeled with MitoTracker Red FM (A–D); BM- MSCs were expressing mitochondrial-targeted AcGFP1 fluorescence protein (E). MMs were unlabeled (B,C) or were labeled with Vybrant DiI membrane-labeling dye (A,E). The cells were kept in co-cultures for 1 h (D) or 24 h (A–C,E) in the presence (A–C) or absence (D,E) of cytochalasin D. Mitochondrial transfer from BM-MSC to MMs was evaluated with a high-content screening method (D), flow cytometry (B,C), or confocal scanning microscopy (A,E), respectively. (A) BM-MSCs (labeled with MitoTracker Red FM) and MMs (labeled with Vybrant DiI) were co-cultured in the absence (DMSO control) or presence of 1µM of cytochalasin D, and TNT quantitation was evaluated with confocal scanning microscopy counting the total number of TNTs between BM-MSCs and MMs per field of view using a 60x oil immersion objective. (B) Mitochondrial transfer from MMs to BM-MSCs was analyzed as described in Figure3in the presence or absence of cytochalasin D.
(C) Mitochondrial transfer from BM-MSCs to MMs was analyzed as described in Figure2in the presence or absence of cytochalasin D. (D) Mitotracker-labeled BM-MSCs were co-cultured with MMs for 1 h and analyzed with time-lapse imaging with an automated digital microscope system. (E) 3D analysis of mitochondrial transfer between the stromal cells and MMs using confocal laser scanning microscopy (63x oil immersion objective). BM-MSCs were expressing mitochondrial-targeted AcGFP1 fluorescence protein, while MMs were labeled with Vybrant DiI membrane-labeling dye. After 24 h of co-culture in the presence of 6 nM carfilzomib (in order to increase MT), cells were fixed with 4% PFA solution for 10 min at room temperature. White arrowheads indicate the Ac-GFP1-tagged mitochondria of BM-MSCs; yellow arrowheads indicate the BM-MSC-derived mitochondria inside the MMs (double positive in the fluorescence image). Red arrows indicate BM-MSC-derived mitochondria transferring into the MMs. The values are presented as the mean±standard deviation, andpvalues < 0.05 were considered significant (*) ((A–C): results are representative of three independent experiments for 1 patient).
4. Discussion
Recent studies have supported that one of the important mechanisms by which tumor cells are able to overcome the toxic effect of therapeutical cell-killing drugs is mitochondrial transport between stromal cells and tumor cells. As it has been shown, mitochondrial trans- fer is not unidirectional [7–10,13,21]. On one hand, damaged mitochondria released from dying tumor cells or from distressed adjacent cells can be incorporated by mesenchymal stromal cells. On the other hand, MSCs can promote the initiation of reparative processes in suffering cells by transferring functional mitochondria [35–39]. Although MT between tumor and stromal cells and its consequences has been intensively studied in a plethora of hematological tumors [7–11,20,21,40], we focused on studying MT between myeloma cells and BM-MSCs. Uniquely, primary myeloma and autologous stromal cells from patients suffering multiple myeloma were used in this work instead of cell lines. Mitochondrial transfer was examined in the presence of drugs and antibodies used for MM therapy.
Therapeutic antibodies Daratumumab, Isatuximab (anti-CD38), and Elotuzumab (anti- CD319/SLAMF7) were not toxic to MMs, BM-MSCs, or their co-cultures. According to this finding, none of these antibodies reduced mitochondrial transfer between MMs and BM-MSCs, except Daratumumab, which significantly inhibited the MT from MMs to BM- MSCs; importantly, it did not block MT from BM-MSC to MMs, which result is similar to cytochalasin D.
Marlein et al. argued [11] that CD38 antibody treatment resulted in significantly reduced MT. These inconsistencies are explained by the various experimental differences.
We used primary, autologous MMs, and BM-MSCs obtained from MM patients, while myeloma cell lines were used in the cited publication. On the other hand, we used anti- CD38 therapeutic antibodies regularly applied in the clinical practice, while Marlein and colleagues worked with an unknown type of anti-CD38 antibody, which may differ from Daratumumab or Isatuximab regarding the epitope specificity and characteristics.
Therapeutical drugs, the proteasome inhibitor carfilzomib, the BCL2 inhibitor veneto- clax, and the HDAC inhibitor Na-valproate were highly toxic to primary MMs but not to BM-MSCs. In the co-cultures of MMs and BM-MSCs, the stromal cells reduced the death of MMs, and, in parallel, the amount of BM-MSC-derived mitochondria increased in the surviving MMs. The transfer of functional mitochondria was accompanied with a rise in ATP level and a decrease in mitochondrial superoxide level in MMs.
The opposite direction, MT from MMs to BM-MSCs, was also analyzed. Long-term (48 h) co-culture of MMs and BM-MSCs in the presence of the used drugs resulted in a drug concentration-dependent increase in MT from MMs to BM-MSCs. The correlation between the increasing drug concentration, the number of dead MMs, and the level of incorporation of MM cell-derived mitochondria by BM-MSCs was also established. The more the MMs died, the more MM-mitochondria were adopted by BM-MSC. Accordingly, incorporation of damaged MM cell-derived mitochondria by BM-MSCs did not result in changes in ATP level, but mitochondrial superoxide levels in stomal cells were elevated.
An increasing number of recent studies show that oxidative phosphorylation activity is elevated in several tumor types including lymphomas and leukemias, the high OXPHOS subtype of melanoma, pancreatic ductal adenocarcinoma, and endometrial or ovarian carcinoma [16–18,41]. Moreover, conventional chemotherapeutic drugs increase the mito- chondrial transfer from stromal cells, and recipient tumor cells consistently show increased OXPHOS activity and ATP production and improved proliferative and migratory proper- ties [8,12,39,42–44]. As the inhibition of oxidative phosphorylation is an emerging target in cancer therapy [16,41,45,46] and the simultaneous inhibition of oxidative phosphorylation enhances the effect of antitumor agents [13], co-targeting MMs with chemotherapeutic drugs and the OXPHOS metabolism inhibitor could be an effective adjuvant strategy in multiple myeloma to influence BM-MSC support and the critical metabolic function of MMs. Therefore, we used the OXPHOS inhibitor metformin in combination with carfil- zomib, venetoclax, and Na-valproate on MM monocultures or MM–BM-MSC co-cultures.
Although metformin did not influence the mitochondrial transfer between BM-MSCs and