Cardiac consequences of metabolic
derangements: role of mitochondrial oxidative stress and autophagy
Ph.D. thesis
Gábor Koncsos, M.Sc.
Semmelweis University
Doctoral School of Pharmaceutical Sciences
Supervisor: Zoltán Giricz, Pharm.D., Ph.D.
Official reviewers: Gergő Szanda, M.D., Ph.D.
István Lekli, Pharm.D., Ph.D.
Head of the Final Examination Committee:
Éva Szökő, Pharm.D., Ph.D., D.Sc.
Members of the Final Examination Committee:
Zsuzsanna Miklós, M.D., Ph.D.
Árpád Márki, M.Sc., Ph.D.
Budapest
2018
1 Table of contents
1 Table of contents ... 1
2 List of Abbreviations ... 5
3 Introduction ... 9
3.1 Metabolic diseases in cardiovascular system ... 9
3.1.1 Hyperlipidemia ... 9
3.1.2 Diabetes and prediabetes ... 11
3.2 Molecular pathology of metabolc diseases in the heart ... 13
3.2.1 Cardiac mTOR activity ... 14
3.2.2 Cardiac autophagy ... 15
3.2.3 Cardiac cell death pathways ... 17
3.3 Cardiac mitochondria in metabolic diseases ... 19
3.3.1 Mitochondrial oxidative stress ... 19
3.3.2 Mitochondrial dynamics and quality control ... 20
3.3.3 Morphological and functional properties of mitochondrial subpopulations in the heart ... 23
3.3.4 Mitochondrial isolation with nagarse - methodological obstacles in cardiac mitochondrial studies ... 24
4 Aims ... 25
5 Materials and methods ... 26
5.1 Animal models and experimental designs ... 26
5.2 Assesment of sensory neuropathy ... 29
5.3 Evaluation of body fat content ... 29
5.4 Cardiac function by echocardiography ... 29
5.5 Hemodynamic measurements, left ventricular pressure-volume analysis ... 30
5.6 Adipokine array from rat plasma ... 31
5.7 Biochemical measurements ... 31
5.8 Histology ... 32
5.9 Nitrotyrosine immunostainig of left ventricular samples ... 32
5.10 Quantitative RT-PCR ... 33
5.11 Measurement of pancreatic insulin ... 33
5.12 Electron microscopy ... 33
5.13 Mitochondrial enzyme activity measurements ... 34
5.14 Preparation of isolated mitochondria ... 35
5.15 Measurement of mitochondrial respiration ... 37
5.16 Measurement of mitochondrial membrane potential ... 37
5.17 Detection of H2O2 formation in mitochondria ... 38
5.18 Measurement of Ca2+ - uptake in mitochondria ... 38
5.19 Western blot of left ventricle lysates and isolated mitochondria fractions ... 38
5.20 Statistical analysis ... 41
6 Results ... 42
6.1 Effect of high-cholesterol diet in Wistar rats ... 42
6.1.1 Elevated serum cholesterol level in hypercholesterolemic rats ... 42
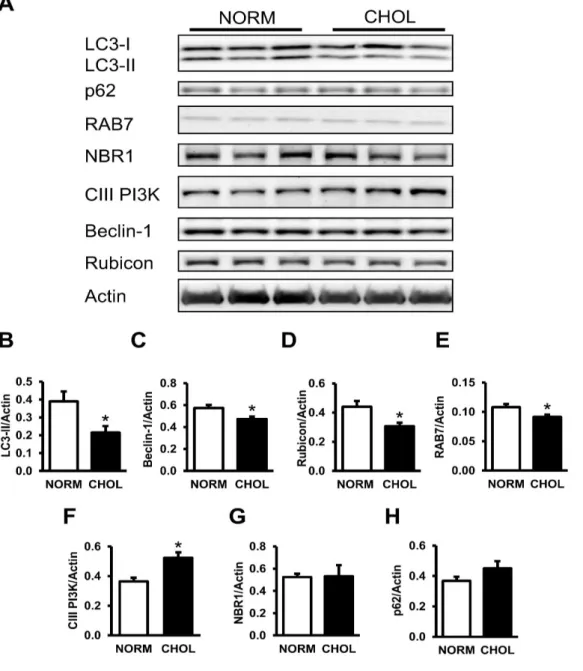
6.1.2 Hypercholesterolemia downregulates autophagy ... 42
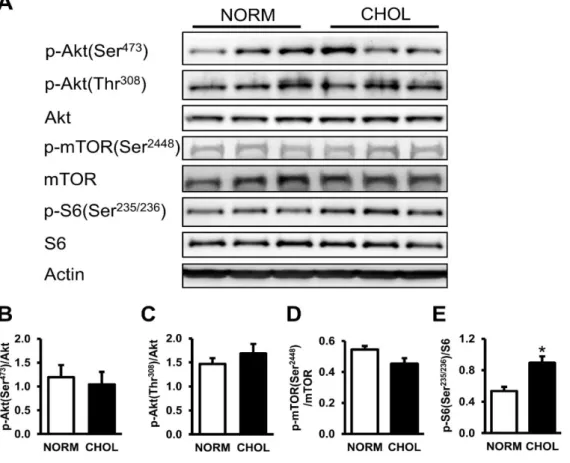
6.1.3 Hypercholesterolemia activates mTOR in the heart ... 44
6.1.4 Apoptosis but not necroptosis is elevated in hypercholesterolemia ... 45
6.2 Effect of high-fat diet and streptozotin treatment in Long-Evans rats ... 46
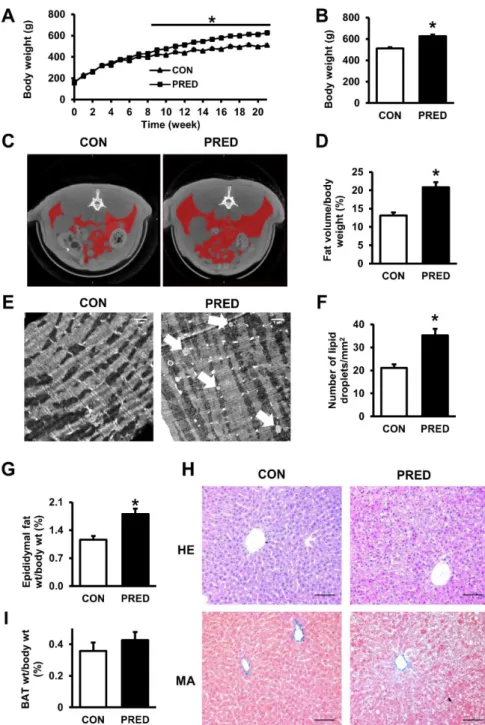
6.2.1 Moderately increased adiposity in prediabetic animals ... 46
6.2.2 Impaired glucose tolerance, insulin resistance, and sensory neuropathy evidence disturbed carbohydrate metabolism in prediabetes ... 48 6.2.3 Diastolic dysfunction and hypertrophy in prediabetes with no sign of fibrosis
50
6.2.4 Elevated reactive oxygen species formation in cardiac subsarcolemmal mitochondria in prediabetic rats ... 53 6.2.5 Alterations in cardiac mitofusin-2 expression and mitophagy in prediabetes 60 6.2.6 Expression of cardiac Bcl-2 decreases in prediabetes ... 64 6.2.7 No changes in cardiac HSPs in prediabetes ... 64 6.3 Detection and quantification of proteins in cardiac mitochondrial subpopulations
65
6.3.1 Differential amounts of proteins in mouse and rat cardiac SSM and IFM .... 65 6.3.2 Nagarse treatment influences protein signals in SSM and IFM from mouse hearts ... 70 6.3.3 Nagarse treatment has no effect on respiration of mitochondrial subfractions
72
7 Discussion ... 73 7.1 Hypercholesterolemia modulates cardiac mTOR and autophagy ... 73 7.1.1 Hypercholesterolemia increases mTOR activity and attenuates autophagy in rat heart ... 73 7.1.2 Hypercholesterolemia increases apoptosis, but not necroptosis in rat heart .. 74 7.2 Prediabetes induced diastolic dysfunction by mild mitochondrial oxidative stress and impaired mitophagy ... 76
7.2.1 Prediabetes induces mild diastolic dysfunction and hypertrophy without fibrosis ... 76 7.2.2 Prediabetes induces mild elevation of oxidative stress in cardiac
subsarcolemmal mitochondria ... 77 7.2.3 No changes in cardiac Ca2+ homeostasis in prediabetes ... 79 7.2.4 Apoptosis is not modulated by prediabetes in cardiomyocytes ... 80 7.2.5 Early sign of altered mitochondrial fusion and mitophagy in prediabetes .... 81 7.3 Detection of mitochondrial proteins is influenced by mitochondrial isolation with nagarse ... 83
7.4 Limitations ... 87
8 Conclusions ... 88
8.1 Hypercholesterolemia activates cardiac mTOR and apoptosis but downregulates autophagy ... 88
8.2 Prediabetes induces mild diastolic dysfunction and hypertrophy by elevated mitochondrial oxidative stress ... 88
8.3 Nagarse treatment of cardiac subsarcolemmal and interfibrillar mitochondria accounts for inaccurate quantification of proteins ... 89
9 Summary ... 90
10 Összefoglalás ... 91
11 References ... 92
12 List of own publications ... 120
12.1 Own publications involved in the current thesis ... 120
12.2 Own publications not involved in the current thesis ... 121
13 Acknowledgements ... 123
2 List of Abbreviations
4E-BP1 - eIF-4E binding protein 1 ACC - acetyl-CoA carboxylase
AMP/ADP/ATP - adenosine mono-/di-/triphosphate AMPKα - AMP-activated protein kinase α ANP - atrial natriuretic peptide
Atg - autophagy-related protein ATP5A - ATP synthase subunit alpha BAT - interscapular brown adipose tissue Bax - Bcl-2-associated X protein
BCA - bicinchoninic acid
Bcl-2 - B-cell lymphoma 2 protein
BID - BH3-interacting domain death agonist protein
BNIP3 - Bcl-2/adenovirus E1B 19 kDa protein-interacting protein 3 BNP - brain natriuretic peptide
BSA - bovine serum albumin CAD - coronary artery disease
CaMKIIδ - Ca2+/calmodulin-dependent protein kinase II;
CAT - carboxyatractyloside
CHOL - hypercholesterolemic group
Class-III PI3K - class-III phosphatidylinositol-3-kinase CO - cardiac output
COL1/3 - collagen type I and III
CON - control group
COX4 - cytochrome c oxidase subunit 4 isoform 1
CP - common protocol (of mitochondrial isolation from mouse/rat heart) CRP - C-reactive protein
CT - computed tomography
CVD - cardiovascular disease
Cx43 - connexin 43
DJ-1 (PARK7) - protein deglycase DJ-1 (Parkinson disease protein 7)
dP/dtmax - maximal slope of LV systolic pressure increment
dP/dtmin - maximal slope of LV diastolic pressure decrement; τ= time constant of LV pressure decay
DLP1 - dynamin-like protein 1
EDPVR - end-diastolic pressure-volume relationship EF - ejection fraction
ELISA - enzyme-linked immunosorbent assay ESPVR - end-systolic pressure-volume relationship FIS1 - mitochondrial fission 1 protein
FS% - fractional shortening %
GAPDH - glyceraldehyde 3-phosphate dehydrogenase GOT - glutamate oxaloacetate transaminase
GPT - glutamate pyruvate transaminase GSK3β - glycogen synthase kinase-3 beta HDL - high density lipoprotein
HE - hematoxylin-eosin
HR - heart rate
HSP - heat shock protein I/R - ischemia/reperfusion as
IDL - intermediate density lipoprotein IFM - interfibrillar mitochondria
IFM+N - interfibrillar mitochondria treated with nagarse
IFM+N+I - interfibrillar mitochondria treated with nagarse and protease inhibitor
IGF-1 - insulin-like growth factor-1 IPC - ischemic preconditioning ITT - insulin tolerance test
LC3 - microtubule-associated protein light chain 3 LDL - low density lipoprotein
LV mass - left ventricular mass
LVAWTs - left ventricular anterior wall thickness, diastolic LVAWTs - left ventricular anterior wall thickness, systolic
LVEDP - left ventricular end-diastolic pressure LVEDV - left ventricular end-diastolic volume LVESP - left ventricular end-systolic pressure LVESV - left ventricular end-systolic volume
LVPWTd - left ventricular posterior wall thickness, diastolic LVPWTs - left ventricular posterior wall thickness, systolic MA - Masson’s trichrome
MAP - mean arterial pressure MFN1/2 - mitofusin 1 and 2
MLKL - mixed lineage kinase domain-like protein MOPS - 3-[N-Morpholino]-propanesulfonic acid mPTP - mitochondrial permeability transition pore mTOR - mechanistic target of rapamycin
NBR1 - neighbor of BRCA1 gene 1 NO• - nitric oxide
NORM - normocholesterolemic group NRF1/2 - nuclear respiratory factor 1 and 2 OGTT - oral glucose tolerance test
OLETF - Otsuka Long-Evans Tokushima fatty (rat) OPA1 - optic atrophy 1
PARP - poly (ADP-ribose) polymerase
PGC-1α - peroxisome proliferator-activated receptor gamma coactivator
PLB - phospholamban
PMSF - phenylmethylsulfonyl fluoride PNM - perinuclear mitochondria PRED - prediabetic group
PRSW - preload recruitable stroke work PVDF - polyvinylidene fluoride
RAB7 - ras-related protein Rab-7a
Raptor - regulatory-associated protein of mTOR Rictor - rapamycin-insensitive companion of mTOR
RIP1/3 - receptor-interacting serine/threonine-protein kinase 1 and 3
RIPA - radioimmunoprecipitation assay ROS - reactive oxygen species
Rubicon - run domain Beclin-1-interacting and cysteine-rich domain containing protein
RV - right ventricle S6 - ribosomal S6 protein
S6K1 - S6 Kinase 1
SERCA2A - sarco/endoplasmic reticulum Ca2+ATPase II SOD - superoxide dismutase
SQSTM1/p62 - sequestosome 1
SSM - subsarcolemmal mitochondria
SSM+N - subsarcolemmal mitochondria treated with nagarse STZ - streptozotocin
SV - stroke volume
SW - stroke work
T1DM - Type 1 diabetes mellitus T2DM - Type 2 diabetes mellitus TBS-T - tris-buffered saline-Tween 20
TFAM - mitochondrial transcription factor A
TFBM - dimethyladenosine transferase 1, mitochondrial
TG - triglyceride
TIMP-1 - TIMP metallopeptidase inhibitor 1 Tm - oxidized tropomyosin
TNFα - tumor necrosis factor alpha TPR - total peripheral resistance ULK1 - unc-51-like kinase 1
VDAC - voltage-dependent anion-selective channel protein VLDL - very low density lipoprotein
Work; dP/dtmax-EDV - the slope of the dP/dtmax-end-diastolic volume relationship α-MHC - alpha-myosin heavy chain
β-MHC - beta-alpha-myosin heavy chain
3 Introduction
3.1 Metabolic diseases in cardiovascular system
There is an overall agreement in the scientific and clinical community that metabolic disorders including obesity, hyperlipidemia or diabetes can increase the incidence of cardiovascular diseases (CVDs) such as myocardial infarction or cardiomyopathies1 and they attenuate or inhibit the intrinsic adaptation mechanism of the heart to ischemic insult2. Furthermore, it was shown previously that these comorbidities also reduce or inhibit the effect of cardioprotective therapeutical interventions such as ischemic pre-3 or postconditioning4. Therefore, it is important to study the effect of metabolic diseases on the cardiovascular system to identify novel targets for future cardioprotective therapies.
3.1.1 Hyperlipidemia
Hyperlipidemia is a family of metabolic disorders, which can be defined by elevated cholesterol (hypercholesterolemia) and/or triglyceride (hypertriglyceridemia) levels in the blood. These lipids (or fats) are not soluble in the plasma, therefore, they are transported by lipoproteins in the circulation system. Based on the content, density and size of lipoproteins, they can be divided into different subpopulations including chylomicrons, very low‑density lipoprotein (VLDL), intermediate‑density lipoprotein (IDL), low‑density lipoprotein (LDL) and high-density lipoprotein (HDL), which have essential role in the transport of lipids among different organs5. LDL transports fats from the liver to the other tissues, while cholesterol is returned by HDL to the liver. Serum total cholesterol, LDL, HDL and triglyceride are the most common diagnostic markers of lipid homeostasis (Table 1). In hypercholesterolemia, decreased levels of HDL cholesterol and increased levels of LDL cholesterol are responsible for atherogenic conditions. Although both plasma triglyceride and cholesterol levels are increased in most forms of hyperlipidemias, the studying of changes in plasma cholesterol levels without altered plasma triglyceride level may also be important. Therefore, in this thesis, the focus is on the role of hypercholesterolemia without elevation of plasma triglyceride level.
The cause of hypercholesterolemia can be genetic (e.g. familial hypercholesterolemia via defect of LDL-receptor), unhealthy lifestyle, or both. Polygenic hypercholesterolemia
may also occur in healthy, but genetically susceptible individuals, however, its polygenic background is still not fully understood. Moreover, this phenotype may be aggravated by various factors including smoking, hypertension, atherogen diet (elevated cholesterol and saturated fat intake), obesity and diabetes6.
In the early 1950s, the Framingham heart study demonstrated for the first time that besides age, sex, and smoking, hypercholesterolemia is a major risk factor for developing coronary artery disease (CAD) due to altered LDL and HDL cholesterol levels7. Hypercholesterolemia have significant cardiac consequences, since they are among the major risk factors of CAD via atherosclerosis and sudden coronary death due to myocardial infarction8-10. The role of atherosclerosis is well studied in these pathologies;
however, myocardial effects of hypercholesterolemia are less understood.
Hypercholesterolemia was previously shown to worsen cardiac systolic and diastolic function in cholesterol-fed rabbits11. Furthermore, we have previously shown that cholesterol feeding leads to mild contractile dysfunction and cardiac oxidative stress12. These data suggest that cardiac metabolism may be affected by hypercholesterolemia well before or even without the development of atherosclerosis.
Ischemic conditioning (i.e., ischemic pre-, per- and postconditioning) of the heart performed by applying short cycles of ischemia/reperfusion (I/R) protects the myocardium against I/R injury2, 13. However, cardioprotective effects of ischemic conditioning are attenuated in the presence of cardiovascular risk factors such as aging14,
15, diabetes16, 17 and hypercholesterolemia as well18-20. Similarly, our previous studies demonstrated that cardioprotection by various forms of ischemic conditioning is impaired in cholesterol-fed rats4, 21-23.
Although cardioprotective signaling pathways are well established, it is still unclear which processes are responsible for the loss of cardioprotection in hypercholesterolemia.
Table 1. American Heart Association guidelines for cholesterol and triglycerides levels in adults.
LDL, low‑density lipoprotein; HDL, high-density lipoprotein; TG, triglyceride. Table was adapted from Phoebe et. al, 201024.
Total (mmol/L)
LDL (mmol/L)
HDL (mmol/L)
TG (mmol/L) Optimal/Near optimal < 5.2 2.6 - 3.3 1.0 - 1.6 < 1.7 Borderline high 5.2 - 6.2 3.3 - 4.1 - 1.7 - 2.2
High - 4.1 - 4.9 - 2.2 - 5.6
Very high > 6.2 > 4.9 < 1.0 > 5.6
3.1.2 Diabetes and prediabetes
Diabetes is characterized by elevated fasting (≥7.0 mmol/L) or non-fasting (≥11.1 mmol/L) blood glucose levels termed hyperglycemia, which leads to defects in insulin secretion, insulin action, or both25. Chronic hyperglycemia could lead to long-term damage and failure of different organs and tissues, such as the eyes, kidneys, nerves, blood vessels and the heart26. Diabetes can be divided into 2 main groups: type 1 and type 2 diabetes.
Type 1 diabetes mellitus (T1DM) is defined as a deficiency of insulin production due to the autoimmune destruction of pancreatic beta cells. T1DM can lead to absolute insulin deficiency and it can cause polyuria, thirst and weight loss with a propensity of ketosis.
Most commonly, T1DM occurs in young individuals and accounts for approximately 5–
10% of all cases of diabetes1, 26. Based on the significant pathological and therapeutic differences between type 1 and 2 diabetes, T1DM will not be further investigated in this thesis.
Type 2 diabetes mellitus (T2DM) is a common civilization disease, which is defined by an inadequate compensatory insulin secretory response to increased blood glucose level, and a combination of resistance to insulin action27. In the early stage of T2DM, cells become resistant to insulin. Insulin resistance can develop due to a deficiency of insulin receptors, a result of which is an elevated blood glucose level. Because of hyperglycemia, pancreatic beta cells produce more insulin to equilibrate the state of insulin resistance. Finally, this process leads to chronic production of insulin, which is responsible for the insufficient or exhausted beta cell activity26. T2DM is more frequent
(approximately 90-95% of all cases) than T1DM and it has growing prevalence worldwide. In most cases, T2DM is associated with obesity and sedentary lifestyle27, 28. It is well established that T2DM is an independent risk factor of CVDs such as heart failure and myocardial infarction as well as vascular complications, which contribute to their increased morbidity and mortality1, 29, 30. In the multiethnic Northern Manhattan Study cohort, presence of T2DM increased the risk of LV hypertrophy with approximately 1.5 fold31. Epidemiological studies have demonstrated that the incidence of both microvascular and macrovascular complications are directly associated with the degree of hyperglycemia32, 33, and that glucose control in patients with T2DM reduced macrovascular complications34, 35.
Since incidence of T2DM is growing in developing and developed societies, more people are influenced by its non-ischemic cardiac complications, for example, diabetic cardiomyopathy often develops. One of the most severe cardiovascular consequences of diabetes, diabetic cardiomyopathy is defined by diabetes-associated changes in the structure and function of the myocardium, which is not directly attributable to other confounding factors such as CAD or hypertension36. Pathological processes of diabetic cardiomyopathy include the presence of myocardial damage, reactive hypertrophy, and intermediary fibrosis, structural and functional changes of the small coronary vessels, disturbance of the management of the metabolic cardiovascular load. T2DM also leads to myocardial lipotoxicity that may contribute to cell death and thus to cardiac dysfunction37. These alterations make the diabetic heart susceptible to ischemia and less able to recover from an ischemic attack37.
Before the development of overt T2DM, a period of prediabetic state (i.e., impaired glucose and insulin tolerance, insulin and leptin resistance, oscillations of normo- and hyperglycemic states, hypertriglyceridemia, hypertension, mild to moderate obesity) occurs25, 38, which may also promote cardiovascular complications39-41. Although various organizations have attempted to define prediabetes, to date no consensus has been reached. The World Health Organization has defined prediabetes as a state of intermediate hyperglycemia based on two specific parameters: impaired fasting glucose, which is defined by fasting plasma glucose of 6.1-6.9 mmol/L and impaired glucose tolerance, which is defined by plasma glucose of 7.8-11.0 mmol/L after a 2 h oral glucose tolerance test (OGTT)42. The American Diabetes Association has the same cut-off value for OGTT
(7.8-11.0 mmol/L), but this organization defined a lower cut-off value for fasting plasma glucose (5.5-6.9 mmol/L), and as an additional parameter, hemoglobin A1c (HbA1c) is taken into account, with a range of 5.7% to 6.4%26. However, the range of these glucose parameters are lower than in diabetes (see above).
In 2011, the Centers for Disease Control estimated that 79 million Americans had prediabetes, which were 35% of people over the age of 20. Moreover, based on data from the National Health and Nutrition Examination Survey, worldwide prevalence of prediabetes may currently approach 840 million43. Although it was previously shown that people with prediabetes in general have approximately 20% risk of CVDs44, 45, other studies showed conflicting results46, 47. Based on these investigations, incidence of prediabetes shows a growing tendency, which could also increase the risk of cardiovascular complications similarly to as seen in T2DM.
Although cardiac pathophysiological alterations are relatively well characterized in fully developed diabetes (i.e., diabetic cardiomyopathy), information about prediabetes is quite limited. Moreover, development of diabetes leads to systemic sensory neuropathy that has been shown to result in diastolic dysfunction in the rat heart48, 49, Although it was previously demonstrated that prediabetes promote sensory neuropathy in C57BL/6J mice50, it is still unclear, whether prediabetic sensory neuropathy occurs in other species such as rats. Since more people are influenced by prediabetes, the examination of its molecular background is also important. In Wistar rats, high caloric diet resulted in obesity-induced prediabetes, which impaired mitochondrial function and reduced basal contractile function and tolerance to acute oxygen deprivation51. Furthermore, it has been reported that prediabetes induced mild diastolic dysfunction in Otsuka Long-Evans Tokushima fatty (OLETF) rats, which is a genetic model for spontaneous long-term hyperglycemia52, however, cardiac consequences of prediabetes and their molecular mechanism is unknown in non-genetic prediabetic settings.
3.2 Molecular pathology of metabolic diseases in the heart
A disturbed metabolic status due to diabetes or hyperlipidemia may result in altered signaling pathways in cardiac cells. In diabetes-induced hyperglycemia, different molecular mechanisms may change such as insulin signaling via PI-3K pathway53, 54, formation of advanced glycation end products, activation of protein kinase C, increased
glucose flux through the hexosamine pathway54, activation of the 12/15-lipoxygenase pathway55 which finally lead to superoxide production54. Additionally, diabetes could lead to impaired Ca2+ handling due to glucose-dependent modifications of Ca2+/calmodulin-dependent protein kinase II (CAMKIIδ), which leads to diabetic cardiomyopathy via contractile dysfunction. Furthermore, metabolic diseases could be associated with other altered cellular and molecular mechanisms such as autophagy/mitophagy or necroptosis, which are still not well-characterized in metabolic cardiac dysfunctions.
Therefore, this thesis focuses on the molecular aspects of cardiac function in metabolic diseases including hypercholesterolemia and diabetes/prediabetes.
3.2.1 Cardiac mTOR activity
The mechanistic target of rapamycin (mTOR) is a serine/threonine protein kinase, which plays a central role in cellular growth and metabolism. It exists in two complexes:
mTORC1 with regulatory-associated protein of mTOR (Raptor) and mTORC2 with rapamycin-insensitive companion of mTOR (Rictor). It is well-established that mTORC1 can be activated by various upstream regulators such as amino acids, growth factors as well as elevated glucose and oxygen levels56, 57. This complex is highly connected with insulin-like growth factor-1 (IGF-1) and Akt/PKB signaling. Regulation of mTORC1 by the IGF-1/Akt pathway occurs through phosphorylation of the TSC1/2 (hamartin-tuberin) complex, which leads to its inhibition and subsequent activation of mTORC158, 59. Furthermore, it was also demonstrated that rapamycin can inhibit mTORC1, but not mTORC2, however, prolonged treatment with rapamycin could inhibit mTORC2 activity60. Although it has been shown that mTORC2 activity has important role in ischemic preconditioning (IPC)-induced cardioprotection via ribosomal S6 signaling61, it is even unclear which signals can modulate the activity of mTORC2. The main substrates of mTORC1 activity are S6 Kinase 1 (S6K1) and eIF-4E binding protein 1 (4E-BP1)60. S6K1 is a positive regulator of translation, initiation and elongation when it is phosphorylated by mTORC1 via its ability to phosphorylate multiple substrates including ribosomal S6 protein or 4E-BP160.
Previous studies demonstrated that chronically activated cardiac mTOR suppresses insulin receptor substrate 1 (an important protein of insulin signaling) in diabetes62 and
cardiac autophagy in obesity63. However, the role of cardiac mTOR is still unclear in hypercholesterolemia and prediabetes.
3.2.2 Cardiac autophagy
Autophagy is a ubiquitous cellular housekeeping process64-66, which is involved in protein quality control and cardiac cytoprotection67-69.
It has 3 different types: macro-, micro and chaperone-mediated autophagy. Moreover, macroautophagy has further cargo-selective subtypes such as macrophagy (removal of protein macromolecules), mitophagy (removal of damaged or senescent mitochondria) or glycophagy (removal of glycogen macromolecules)70. In macroautophagy (hereafter referred to as autophagy) the cytoplasmic contents are sequestered within double membrane vacuoles called autophagosomes and subsequently delivered to the lysosome for degradation. In the beginning of autophagosomal formation, a pre-autophagosomal structure is formed intracellularly, which is also called isolation membrane or phagophore. The activity of class III phosphatidylinositol 3-kinase (PI3K), Vps34, Beclin-1 and autophagy-related (Atg) proteins (e.g. Atg12-Atg5-Atg16L) play an essential role in the early stages of the autophagosome formation. During sequestration and elongation processes, sequestome 1 or ubiquitin-binding protein p62 (SQSTM1/p62), which is the key autophagy adaptor is activated by lipidation and mediates protein cargo into forming phagophore. Then, SQSTM1/p62 complexes with the Atg homologue microtubule-associated protein light chain 3 (LC3) protein, which is converted from cytosolic LC3-I to LC3-II by Atg7 and Atg3, and targeted to the elongating autophagosome membrane. Detection of both SQSTM1/p62 and LC3-I/II are used experimentally to investigate cardiac autophagy in cells and tissues. Then, isolation membranes fuse and engulf damaged organelles and protein aggregates and formed autophagosome. In degradation step, autophagosomes fuse with lysosomes, which contains permeases and acid hydrolases and forming autophagolysosomes. Finally, this structure leads the degradation of intra-autophagosomal content due to acid hydrolases and permeases of lysosome70-72 (Figure 1). Autophagy occurs constitutively at low levels under normal conditions in most cells, including cardiomyocytes. Defective autophagy results in the accumulation of protein aggregates and abnormal organelles which are toxic to the cell and lead to cell death73. However, it is known that autophagy is elevated under
nutrient and oxidative stress in I/R injury74. Number of known cardioprotective treatments have been shown to trigger autophagy including statins75, lipopolysaccharide76, resrevatrol69 and sevoflurane77. Our research group previously have shown that IPC induces autophagy under normal conditions in adult rat hearts and that autophagy is necessary for cardioprotection by IPC78. Similarly, Rohailla et al. showed that remote IPC increased autophagy and decreased the expression of proteins related to mTOR in mice79. It is well established that activity of mTOR pathway modulates autophagy80. Starvation induces autophagy via inhibition of mTORC1 and it is suppressed in energy rich conditions, which is adaptive and accurately regulated. Nutrients and growth factors have a stimulating effect on mTORC1, which inhibits unc-51-like kinase 1 (ULK1), thereby suppressing autophagy81 (Figure 1). During energy depletion, adenosine monophosphate (AMP) accumulates in the cell, which stimulates autophagy through AMP-activated protein kinase (AMPK) activation82, 83. Previous data suggests that mTOR signaling might be elevated while autophagy is diminished in the hearts of hyperlipidemic Yucatan pigs84, and we have shown that in mice diet-induced obesity results in disturbed cardiac autophagy which is accompanied by increased myocardial injury after I/R85.
Cardiac autophagy could be activated by various signals such as protein kinase C86, reactive oxygen species (ROS)72, 87, nitric oxide (NO•)88 and it was shown that suppressed cardiac autophagy plays an important role in type 2 diabetes and in its complications89, however, its effect on prediabetes and hypercholesterolemia has not been well-studied yet.
Figure 1. Schematic representation of autophagic process.
Starvation or AMPK activation inhibits mTOR and induces isolation membrane (termed phagophore) formation via ULK1 and Beclin-1 complexes. During the nucleation and elongation steps of autophagy, senescent and/or dysfunctional intracellular materials are engulfed into phagophore, which grows to autophagosome. Formation of Atg5/Atg12/Atg16L1 complex, and then LC3-I/LC3-II transformation have a pivotal role in the development of autophagosome. Finally, autophagosome fuses with lysosome to generate autolysosome, where its contents are degraded by lysosomal enzymes such as acid hydrolases and permeases. AMPK, AMP-activated protein kinase; ULK1, unc-51-like kinase 1; mTOR, mechanistic target of rapamycin; Atg, autophagy-related protein; Class- III PI3K, class-III phosphatidylinositol-3-kinase; LC3, microtubule-associated protein light chain 3; PE, phosphatidylethanolamine. Figure was adopted from Mei et al. 201571.
3.2.3 Cardiac cell death pathways
Insufficient autophagy can promote programmed cell death, for example apoptosis72,
90, which results in cardiac damage91. Apoptosis is an evolutionary conserved and highly regulated process of programmed cell death, which plays a key role in the maintenance of the balance between cell proliferation and cell death under physiological conditions via activation of caspases91, 92.
Furthermore, apoptosis changes in different pathologies such as cancer93, neurodegenerative diseases for instance Alzheimer’s disease92 or I/R injury of the heart94.
Necrosis is another type of cell death, which is characterized by loss of plasma membrane integrity, and reduced adenosine triphosphate (ATP) levels in cells95. Apoptosis and necrosis can be divided into two main pathways: the extrinsic pathway involves cell surface death receptors while the intrinsic pathway utilizes the mitochondria and endoplasmic reticulum, which is regulated by Bcl-2 family95.
Besides apoptosis and necrosis, necroptosis (programmed necrosis) is another type of programmed cell death process, which occurs upon stimulation of death receptors in the absence of caspase-8 activation96, 97. Disturbances in cellular energetics, excessive reactive oxygen species production or metabolic changes have been shown to elicit necroptosis and apoptosis (Figure 2)97-100. It has been shown that apoptosis is upregulated in the hearts of hamsters on hypercholesterolemic diet98. Furthermore, it was also demonstrated that tumor necrosis factor alpha (TNFα)-induced oxidative stress increased necroptosis in parallel with autophagy101 and that suppression of autophagy flux contributes to RIP1-RIP3 interaction and necroptosis of cardiomyocytes102. However, there is no information about hyperlipidemia-induced necroptosis and its connection with apoptotic and autophagic processes in the heart. Therefore, we hypothesized that hypercholesterolemia may also increase activation of pro-death pathways such as apoptosis and necroptosis in the rat heart.
In fully developed diabetes, increased level of cardiac apoptosis has been found103. It was also demonstrated that apoptosis and necrosis was increased in ischemic and non- ischemic human diabetic myocardium104.
It has been shown that activated apoptosis has an important role in diabetes105, 106, which could be connected to an impaired mitochondrial function107 and autophagy105, 108. Moreover, apoptosis can lead to an imbalance in the calcium homeostasis, which could mediate contractile dysfunction in diabetic cardiomyopathy109, however, the role of cardiac apoptosis and necroptosis in hypercholesterolemia and prediabetes is still unclear.
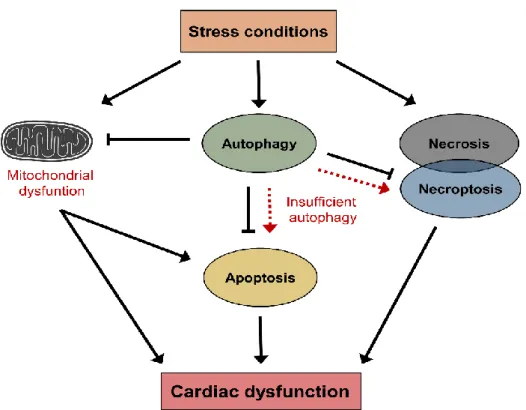
Figure 2. Schematic representation of stress-induced cell responses.
Stress conditions such as ischemia or nutrition stress can lead to cellular damage through the induction of mitochondrial dysfunction and activation of cell death pathways (i.e., necrosis). During stress conditions, autophagy can also be activated which prevents further cellular damages by the elimination of damaged organelles. However, insufficient autophagy may lead to cell death through the induction of cardiac apoptosis or necroptosis, which could be associated with cardiac dysfunction.
3.3 Cardiac mitochondria in metabolic diseases
3.3.1 Mitochondrial oxidative stress
It is well-established that mitochondria are “cellular engines”, which are responsible for normal energy status and homeostasis of the heart. However, stress stimuli such as I/R-induced oxidative stress and Ca2+ signal open mitochondrial permeability transition pore (mPTP) and activates the intrinsic pathway of cell death95. Therefore, oxidative metabolism of mitochondria has an important role in both physiological and pathophysiological processes110, 111.
In the myocardium, the number and size of the mitochondria are very high due to the high demand of ATP. The ATP is formed by oxidative phosphorylation. During the oxidative phosphorylation, ROS or reactive nitrogen species (RNS) are also formed,
which are toxic byproducts of mitochondria. The most common forms of free radicals are identified in the human heart including superoxide anion (O2•-
), the hydroxyl radical (OH•), hydrogen peroxide (H2O2), singlet oxygen, peroxynitrite (ONOO−) and NO•112. Mitochondria is a major source of ROS in I/R113. In cellular stress, ROS can be formed by mitochondrial electron transport damage and uncoupling, nicotinamide adenine dinucleotide phosphate (NADPH) oxidase, uncoupled nitric oxide synthase (NOS), xanthine oxidase, cytochrome P450 monooxygenase, and cyclooxygenase, while activities of endogenous free radical scavenging enzymes such as superoxide dismutase (SOD), glutathione peroxidase GPx and catalase (CAT) are lower in the mitochondria114. The highly reactive radicals damage mitochondrial and cellular DNA, proteins, lipids, which could lead to mitochondrial dysfunction.
Reactive oxygen and nitrogen species production are increased in metabolic derangements such as obesity115, hyperglycemia, hyperlipidemia, hyperinsulinemia, and insulin resistance which characterize type 2 diabetes112. Thus, mitochondria have pivotal role in these metabolic disorders including obesity and type 2 diabetes110, 116-119, however, their status and effect is less understood in prediabetes.
3.3.2 Mitochondrial dynamics and quality control
Mitochondria are highly dynamic and interconnected organelles, their morphology and size change continuously. To adapt to changes in the intracellular environment due to stress conditions (i.e., ischemic insult)120, mitochondria are constantly undergo fusion and fission, which is termed mitochondrial dynamics121. Mitochondrial turnover, including mitochondrial dynamics, biogenesis, and mitophagy has essential role in mitochondrial quality control, shape, connectivity, cellular redox state and cell death (Figure 3)121.
Mitochondrial biogenesis results in increased individual mitochondrial mass and copy number of mitochondria. The process is influenced by various factors such as caloric restriction, low temperature, oxidative stress and cell division116, 122. Peroxisome proliferator-activated receptor gamma coactivator 1-alpha (PGC-1α) is the master regulator of mitochondrial biogenesis, which activates various transcription factors, including nuclear respiratory factor 1 and 2 (NRF1-2), mitochondrial transcription factor A (TFAM) and dimethyladenosine transferase 1 (TFBM)122, 123. It was demonstrated that
mitochondrial biogenesis was impaired in diabetes124 and obesity125 due to decreased expression of PGC-1α. Furthermore, testicular level of PGC-1α was also decreased, while NRF1 and NRF2 was not altered in prediabetic rats126.
Fusion results in interconnected mitochondrial network and leads to the elongation of mitochondria. This process needs mitochondrial fusion proteins including mitofusin 1 (MFN1) and 2 (MFN2) which are localized in the outer mitochondrial membrane and optic atrophy 1 protein (OPA1), which is localized in the inner mitochondrial membrane120. It was shown previously that lack of MFN1 and MFN2 resulted in a rapid lethal cardiac failure in MFN1/MFN2 double knockout mice, suggesting that the mitochondrial fusion events have essential role in cardiac homeostasis127.
During fission mitochondria become smaller and more fragmented. Fission has an important role in increased number of mitochondria, translocation of mitochondria to daughter cells during mitosis as well as if damaged mitochondria needs to be removed by mitophagy128. As the first step of fission, dynamin-related protein 1 (DRP1) is recruited from cytosol to the outer mitochondrial membrane. Then, DRP1 translocation leads to formation of smaller, fragmented daughter mitochondria and the sequestration of damaged parts129. Furthermore, mitochondrial fission 1 protein (FIS1) has also important role in fission, which anchors to the outer mitochondrial membrane as a receptor for DRP1130.
It was evidenced that stress conditions like ischemia131, depolarization132 or highly elevated production of ROS133 can trigger mitochondrial fission, due to depolarization of mitochondrial membrane. Since the healthy daughter mitochondria with normal membrane potential can merge by mitochondrial fusion, the survival of interconnected mitochondrial network is ensured120.
Impaired daughter mitochondria can be eliminated by mitophagy after mitochondrial fission. Mitophagy is a specific form of autophagy, which eliminates damaged or senescent mitochondria from the cell134. It was evidenced that MFN2 has important role to recruit Parkin to the outer mitochondrial membrane and induce Parkin-, LC3-, and SQSTM1/p62-mediated mitophagy135. Since mitochondrial function is heavily influenced by mitochondrial dynamics including mitochondrial biogenesis, fusion, fission, and autophagy-mitophagy (Figure 3), and since these processes have been linked to the development of diabetic cardiomyopathy105, 106, 108, 136, we hypothesized that altered
mitochondrial dynamics might be involved in the mechanism of deteriorated cardiac functions in prediabetes.
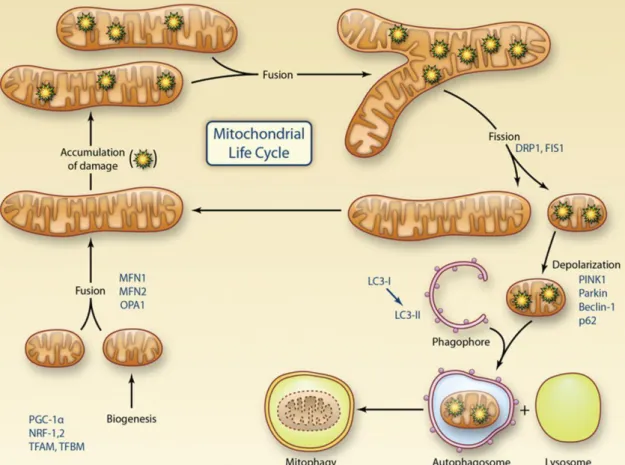
Figure 3. Representation of the mitochondrial life cycle including the role of mitochondrial dynamics and mitophagy in quality control.
Mitochondrial biogenesis is regulated by PGC-1α, which activates transcriptional factors including NRF-1 and 2, TFAM and TFBM. Mitochondria undergo cycles of fusion (mediated by MFN1, MFN2, and OPA1) to form elongated mitochondrial networks and fission (mediated by DRP1 and FIS1) to form smaller individual organelles. After the fission, isolated and damaged components are eliminated by mitophagy. In the activation of mitophagy, PINK1, Parkin, Beclin-1, SQSTM1/p62 and LC3 play an important role to remove damaged mitochondria from the cell. PGC-1α, peroxisome proliferator-activated receptor gamma coactivator 1-alpha; NRF1-2, nuclear respiratory factor 1 and 2; TFAM, mitochondrial transcription factor A; TFBM, dimethyladenosine transferase 1; MFN 1-2, mitofusin 1 and 2; OPA1, optic atrophy 1 protein; DRP1, dynamin-related protein 1; FIS1, mitochondrial fission 1 protein; SQSTM1/p62, sequestosome 1. Figure was adapted from Kluge et al. 2013137.
3.3.3 Morphological and functional properties of mitochondrial subpopulations in the heart
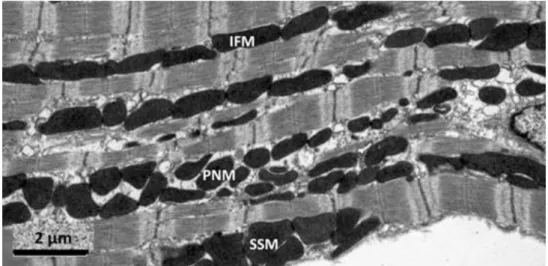
There are three distinct fractions of cardiac and skeletal muscle mitochondria according to their subcellular localization. Subsarcolemmal mitochondria (SSM), which are located near the sarcolemma, interfibrillar mitochondria (IFM), which are situated among myofibrils, and perinuclear mitochondria (PNM), which are clustered around the nucleus (Figure 4)138. It was previously shown that these fractions are different in morphology: SSM have lamelliform cristae while most of IFM show tubular cristae139. Additionally, it has been described in transmission electron microscopic studies that IFM and PNM have similar size and distribution in cardiomyocytes140, 141. Furthermore, SSM and IFM are different in respiratory rates and mitochondrial enzyme activities142, 143. In contrast, functional or proteomics data on PNM have not been published to date. SSM and IFM differ in function under pathophysiological conditions. For example, aging decreases the rate of oxidative phosphorylation only in IFM144, and functional differences between SSM and IFM have been shown with high-fat diet145 and diabetes146.
Although functional properties of SSM and IFM are well-described, differences in their protein constitution are less studied. Previously, we showed that connexin 43 (Cx43) is located predominantly in SSM147, and mitofilin level is higher in IFM148. Furthermore, the rate of mitochondrial protein synthesis is different in SSM and IFM148, 149. Despite these reports, the biology behind the proteomic differences is largely unknown, and a specific protein marker that allows the identification of mitochondrial subfractions has not been identified yet.
Figure 4. Representative electron micrograph of mitochondrial subfractions from murine heart. SSM, subsarcolemmal mitochondria; IFM, interfibrillar mitochondria, PNM, perinuclear mitochondria. Figure was adapted from Ong et al. 2013150.
3.3.4 Mitochondrial isolation with nagarse - methodological obstacles in cardiac mitochondrial studies
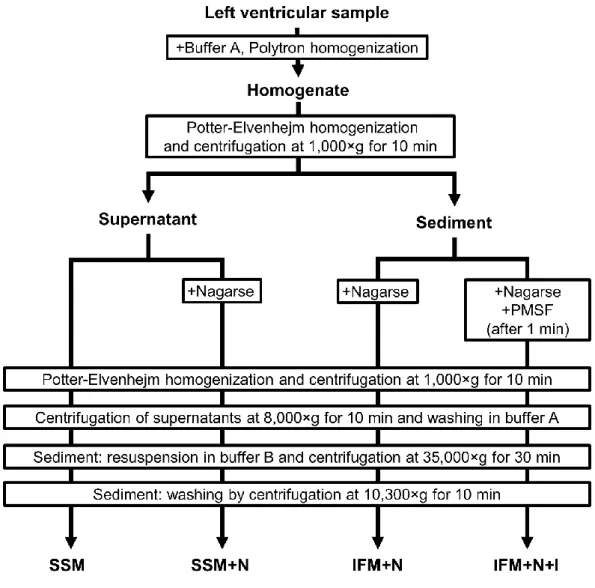
Differentiation between IFM and SSM in biochemical assays depends on the use of different isolation methods. Palmer and colleagues demonstrated first that SSM could be isolated via homogenization by a Polytron method, while IFM could be extracted from cardiac tissue only with additional protease treatment. For the release of IFM from the myofibrils, trypsin145, 146, proteinase K151, 152, or most commonly nagarse144, 147, 153, 154
treatments are used. Nagarse is a bacterial serine-type endopeptidase (EC: 3.4.21.62), which is a member of the subtilisin family155, 156 with practically no substrate specificity.
Other than enzymatic digestion, a method with mechanical disruption has also been described for the isolation of SSM, however, it is rarely referenced157, 158.
Although the use of proteases is necessary for the isolation of IFM by the most widely accepted method, enzymatic digestion with bacterial proteases might influence the mitochondrial protein content and/or mitochondrial function. It was recently shown that nagarse treatment significantly influenced mitochondrial respiration and enzyme activity of SSM isolated from mouse skeletal muscle156, however, the effect of nagarse on cardiac mitochondrial proteins has not been studied in detail. Thus, one of the goals of this thesis was to examine, whether the nagarse-based method for the isolation of IFM affects the detection of mitochondrial proteins in cardiac mitochondrial subfractions.
4 Aims
The role of hypercholesterolemia and prediabetes including their molecular aspects in cardiovascular system is still not well-investigated. Furthermore, we hypothesized that nagarse treatment may influence the quantification of specific mitochondrial proteins in our animal models. Therefore, our aims were the follows:
To investigate the status of autophagy and mTOR and examine apoptosis and necroptosis pathways in a hypercholesterolemic rat model.
To characterize functional, morphological and molecular features of a diet-induced prediabetes model in rats.
To investigate the effect of prediabetes on the cardiovascular system.
To examine whether the nagarse-based method for the isolation of IFM affect the detection of mitochondrial proteins in cardiac mitochondrial subfractions.
5 Materials and methods
These studies conform to the Guide for the Care and Use of Laboratory Animals published by the US National Institutes of Health (NIH publication No. 85–23, revised 1996) and was approved by the animal ethics committee of the Semmelweis University, Budapest, Hungary (registration numbers: XIV-I-001/450-6/2012) or animal welfare office of the Justus-Liebig University, Giessen, Germany. Chemicals were purchased from Sigma, St. Louis, MO, USA unless otherwise noted.
5.1 Animal models and experimental designs
5.1.1 Animal model of hypercholesterolemia
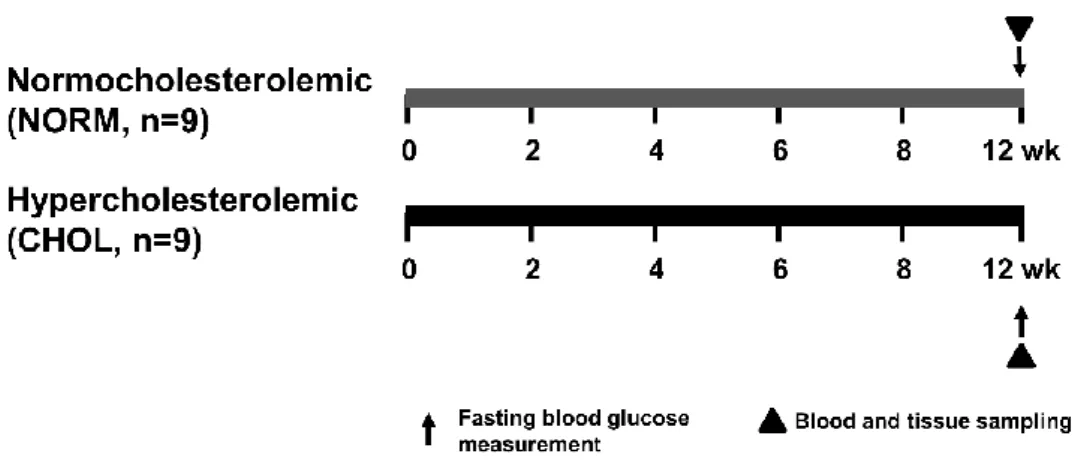
To investigate the effect of hypercholesterolemia, six-weeks-old male Wistar rats (Crl:WI Strain Code: 003; Charles River Laboratories) were fed with control chow (NORM; n=9) or chow enriched with 2% cholesterol and 0.25% cholic acid (CHOL; n=9) for 12 weeks (Figure 5). Animals were allowed to food and water ad libitum and chow was changed daily. After the feeding period, body weight of animals were measured and they were anesthetized with diethyl ether and given 500 U/kg heparin i.v. Blood sample (500 µL) was taken from tail vein for further experiments. Hearts were excised and perfused with Krebs-Henseleit buffer according to Langendorff at 37 °C for 10 min as previously described159. Hearts were taken and snap-frozen for further biochemical assays.
Figure 5. Experimental protocol for assessing the effect of hypercholesterolemia in vivo.
Fasting blood glucose, TG and cholesterol were measured at week 12. Tissue sampling was performed after terminal procedures. NORM, normocholesterolemic; CHOL, hypercholesterolemic.
5.1.2 Animal model of prediabetes
To characterize a prediabetic animal model, male Long-Evans rats of 5-7 weeks of age were purchased from Charles River Laboratories. Animals were housed in a room maintained at 12 h light-dark cycles and constant temperature of 21 °C. Animals were allowed to food and water ad libitum. After one week of acclimatization rats were divided into two groups: control (CON; n=20) and prediabetic group (PRED; n=20) (Figure 6).
The control group was fed control chow, while the prediabetic group was fed a chow supplemented with 40% lard as a high-fat diet. Body weights were measured weekly.
Blood was taken and fasting blood glucose levels were measured from the saphenous vein every second week with a blood glucose monitoring system (Accu-Check, Roche). To facilitate the development of prediabetes and, animals on high-fat diet received 20 mg/kg streptozotocin (STZ, Santa Cruz Biotechnology) intraperitoneally (i.p.) at the fourth week of the diet according to Mansor et al.160, while the control group was treated with same volume of ice-cold citrate buffer as vehicle. At the 20th week oral glucose tolerance test (OGTT) was performed in overnight fasted rats with per os administration of 1.5 g/kg glucose and measurements of plasma glucose levels at 15, 30, 60 and 120 minutes. Insulin tolerance test (ITT) was also performed at week 20 in overnight fasted rats. Insulin (0.5 IU/kg, Humulin R, Ely Lilly) was injected i.p. and plasma glucose levels were checked at 15, 30, 45, 60, 90 and 120 minutes. At week 21 of the diet, animals were anesthetized
with pentobarbital (60 mg/kg, i.p., Euthasol, Produlab Pharma). Echocardiography and cardiac catheterization were performed, then hearts were excised, shortly perfused with oxygenated Krebs-Henseleit buffer in Langendorff mode as described earlier and heart weights were measured. Epididymal and interscapular brown fat tissue, which are the markers of adiposity161, 162, were isolated and their weights were measured. Blood and tissue samples were collected and stored at -80 °C.
Figure 6. Experimental protocol for assessing the effect of prediabetes in vivo.
Long-Evans rats were fed with either CON diet for 21 weeks, or with high-fat diet and treated with 20 mg/kg STZ at week 4 to induce prediabetes (PRED). Body weights were measured weekly and blood samples were taken from the saphenic vein every second week.
Sensory neuropathy was measured at week 15. OGTT, ITT and CT were performed at week 20. Echocardiography, hemodynamic analysis and parameters of mitochondrial function were measured at week 21 of diet. Tissue sampling was performed after terminal procedures. CON, control; PRED, prediabetic; STZ, streptozotocin; OGTT, oral glucose tolerance test; ITT, insulin tolerance test; CT, computer tomography.
5.1.3 Animal model to investigate the effect of nagarse on mitochondrial subfractions
To investigate the effect of nagarse on cardiac mitochondrial subfractions, 10-12 weeks old male C57Bl6J mice (25-30 g, Janvier, Le Genest-Saint-Isles, France) and 8-10 weeks old male Wistar Han rats (300-350 g, Janvier) were used. Animals were kept in dark/light cycles of 12 h each and had free access to standard chow and drinking water.
Mice were anaesthetized with 5% isoflurane and sacrificed by cervical dislocation. Rats were anaesthetized with 4% isoflurane, subsequently hearts were removed, and cardiac tissue was collected.
5.2 Assessment of sensory neuropathy
To test if sensory neuropathy develops in prediabetes, plantar Von Frey test was performed on Long-Evans rats. At week 15 of the diet, rats were placed in a plastic cage having a wire mesh bottom to allow full access to the paws. After 5-10 min acclimation time, mechanical hind paw withdrawal thresholds were measured by a dynamic plantar aesthesiometer (UGO-Basile) as previously described163.
5.3 Evaluation of body fat content
At week 20 of the diet, computer tomography (CT) measurements were performed on NanoSPECT/CT PLUS (Mediso) on Long-Evans rats. The semicircular CT scanning was acquired with 55 kV tube voltage, 500 ms of exposure time, 1:4 binning and 360 projections in 18 minutes 7s. During the acquisitions, rats were placed in prone position in a dedicated rat bed, and were anesthetized with 2% isoflurane in oxygen. Temperature of the animals was kept at 37.2±0.3 °C during imaging. In the reconstruction, 0.24 mm in-plane resolution and slice thickness were set and Butterworth filter was applied (volume size: 76.8*76.8*190 mm). Images were further analyzed with VivoQuant (inviCRO LLC) dedicated image analysis software products by placing appropriate Volume-of-Interests (VOI) on the whole body fat of animals. The aim of segmentation was to separate the fat from other tissues. The connected threshold method helped to choose the adequate attenuated pixels for fat tissue analysis, then the isolated points were detected by erode 4 voxel and dilate 4 voxel steps. After the measurements animals recovered from anesthesia.
5.4 Cardiac function by echocardiography
Before euthanasia, to measure cardiac function on Long-Evans rats, echocardiography was performed as previously described164, 165. Briefly, anesthetized animals were placed on a controlled heating pad, and the core temperature, measured via rectal probe, was maintained at 37 °C. Transthoracic echocardiography was performed in supine position by one investigator blinded to the experimental groups. Two dimensional and M-mode echocardiographic images of long and short (mid-papillary muscle level) axis were
recorded, using a 13 MHz linear transducer (GE 12L-RS, GE Healthcare), connected to an echocardiographic imaging unit (Vivid I, GE Healthcare). The digital images were analyzed by a blinded investigator using an image analysis software (EchoPac, GE Healthcare). On two dimensional recordings of the short-axis at the mid-papillary level, left ventricular (LV) anterior (LVAWT) and posterior (LVPWT) wall thickness in diastole (index: d) and systole (index: s), left ventricular end-diastolic (LVEDD) and end- systolic diameter (LVESD) were measured. In addition, end-diastolic and end-systolic LV areas were planimetered from short and long axis two dimensional recordings. End- systole was defined as the time point of minimal left ventricular dimensions, and end- diastole as the time point of maximal dimensions. All values were averaged over three consecutive cycles. The following parameters were derived from these measurements166. Fractional shortening (FS) was calculated as ((LVEDD-LVESD)/LVEDD)×100. LV mass was calculated according to the following formula:
[LVmass=(LVEDD+AWTd+PWTd)3-LVEDD3×]1.04×0.8+0.14.
5.5 Hemodynamic measurements, left ventricular pressure-volume analysis
After echocardiographic measurements, hemodynamic measurement was performed on Long-Evans rats as previously described167, 168. Briefly, rats were tracheotomized, intubated and ventilated, while core temperature was maintained at 37 °C. A median laparotomy was performed. A polyethylene catheter was inserted into the left external jugular vein. A 2-Fr microtip pressure-conductance catheter (SPR-838, Millar Instruments) was inserted into the right carotid artery and advanced into the ascending aorta. After stabilization for 5 min, mean arterial blood pressure (MAP) was recorded.
After that, the catheter was advanced into the LV under pressure control. After stabilization for 5 min, signals were continuously recorded at a sampling rate of 1,000/s using a Pressure-Volume (P-V) conductance system (MPVS-Ultra, Millar Instruments) connected to the PowerLab 16/30 data acquisition system (AD Instruments), stored and displayed on a personal computer by the LabChart5 Software System (AD Instruments).
After positioning the catheter baseline P-V loops were registered. With the use of a special P-V analysis program (PVAN, Millar Instruments), LV end-systolic pressure (LVESP),
LV end-diastolic pressure (LVEDP), the maximal slope of LV systolic pressure increment (dP/dtmax) and diastolic pressure decrement (dP/dtmin), time constant of LV pressure decay (τ; according to the Glantz method), ejection fraction (EF) stroke work (SW) and LV maximal power were computed and calculated. Stroke volume (SV) and cardiac output (CO) were calculated and corrected according to in vitro and in vivo volume calibrations using the PVAN software. Total peripheral resistance (TPR) was calculated by the following equation: TPR=MAP/CO. In addition to the above parameters, P-V loops recorded at different preloads can be used to derive other useful systolic function indexes that are less influenced by loading conditions and cardiac mass169, 170. Therefore, LV P-V relations were measured by transiently compressing the inferior vena cava (reducing preload) under the diaphragm with a cotton-tipped applicator. The slope of the LV end-systolic P-V relationship (ESPVR; according to the parabolic curvilinear model), preload recruitable stroke work (PRSW), and the slope of the dP/dtmax - end-diastolic volume relationship (dP/dtmax-EDV) were calculated as load-independent indexes of LV contractility. The slope of the LV end-diastolic P-V relationship (EDPVR) was calculated as a reliable index of LV stiffness170. At the end of each experiment, 100 µL of hypertonic saline were injected intravenously, and from the shift of P-V relations, parallel conductance volume was calculated by the software and used for the correction of the cardiac mass volume. The volume calibration of the conductance system was performed as previously described170.
5.6 Adipokine array from rat plasma
Adipokine array was performed from 1 mL plasma from Long-Evans rats according to manufacturer’s instructions (Proteome Profiler Rat Adipokine Array Kit, R&D Systems).
5.7 Biochemical measurements
Serum cholesterol, high density lipoprotein (HDL) and triglyceride levels were measured in Long-Evans rats and glucose, cholesterol and triglyceride levels were measured from plasma of NORM and CHOL Wistar rats by colorimetric assays (Diagnosticum) as previously described171. Plasma leptin (Invitrogen), TIMP
metallopeptidase inhibitor 1 (TIMP-1; R&D System) and angiotensin-II (Phoenix pharmaceuticals) were measured by enzyme-linked immunosorbent assay (ELISA) according to manufacturer’s instructions. Urea, glutamate oxaloacetate transaminase (GOT), glutamate pyruvate transaminase (GPT), low density lipoprotein (LDL), C- reactive protein (CRP), cholesterol, uric acid and creatinine were measured by automated clinical laboratory assays (Diagnosticum).
5.8 Histology
Heart, liver and pancreas samples from Long-Evans rats were fixed in 4% neutral- buffered formalin. After 24 hours, samples were washed with phosphate buffered saline (PBS) and stored in 70% ethanol in PBS until embedded in paraffin. Samples were stained with hematoxylin-eosin (HE) and Masson’s trichrome (MA) staining. Left ventricle samples were analyzed to examine histopathological differences and evaluate cardiomyocyte hypertrophy and fibrosis. The level of fibrosis was measured on MA- stained LV sections, and transverse transnuclear width (cardiomyocyte diameter) was assessed on longitudinally oriented cardiomyocytes on HE-stained LV sections by a Zeiss microscope (Carl Zeiss). Digital images were acquired using an imaging software (QCapture Pro 6.0, QImaging) at 20× magnification. Quantification of cardiomyocyte diameter and fibrosis was performed with ImageJ Software (v1.48, NIH, Bethesda). Liver samples were evaluated for hepatic steatosis/fibrosis and scored as previously described
172.
5.9 Nitrotyrosine immunostainig of left ventricular samples
Nitrotyrosine levels were also investigated from Long-Evans rat left ventricles. After embedding and cutting 5 μm thick sections, heat-induced antigen epitope retrieval was performed (95 °C, 10 min, in citrate buffer with a pH of 6.0). Sections were stained with rabbit polyclonal anti-nitrotyrosine antibody (5 µg/mL, Cayman Chemical) by using the ABC-kit of Vector Laboratories (Burlingame) according to the manufacturer’s protocol.
Nitrotyrosine-stained sections were counterstained with hematoxylin. Specific staining was visualized and images were acquired using a BX-41 microscope (Olympus).
5.10 Quantitative RT-PCR
Total RNA was isolated from Long-Evans rat LV tissue with ReliaprepTM RNA Tissue Miniprep kit (Promega) according to the manufacturer’s instructions. cDNA was synthesized using Tetro cDNA Synthesis Kit (Bioline) according to the manufacturer’s protocol. PCR reaction was performed with iQ SYBR Green Supermix (Bio-Rad), or TaqMan Universal PCR MasterMix (Thermo Fisher Scientific) and 3 nM forward and reverse primers for collagen type 1 and 3 (COL1 and COL3), atrial natriuretic peptide (ANP), brain natriuretic peptide (BNP) (Integrated DNA Technologies), assay mixes for α-myosin heavy chain (α-MHC, assay ID: Rn00691721_g1), β-myosin heavy chain (β- MHC, assay ID: Rn00568328_m1), TNF-α (assay ID: Rn99999017_m1) and interleukin- 6 (IL-6, assay ID: Rn01410330_m1, Thermo Fisher Scientific) were used. Beta-2 microglobulin (B2M) or glyceraldehyde-3-phosphate dehydrogenase (GAPDH;
reference gene; assay ID: Rn01775763_g1) were used as reference genes. Quantitative real-time PCR was performed with the StepOnePlus Real-Time PCR System (Thermo Fisher Scientific). Expression levels were calculated using the cycle threshold (CT) comparative method (2-ΔCT).
5.11 Measurement of pancreatic insulin
Freeze clamped and pulverized pancreas samples from Long-Evans rats were used to determine pancreatic insulin content. Analysis was performed with Insulin (I-125) IRMA Kit (Izotop Kft) according to the manufacturer’s instructions.
5.12 Electron microscopy
Left ventricular tissue samples (1×1 mm) from Long-Evans rats were placed in modified Kranovsky fixative (2% paraformaldehyde, 2.5 % glutaraldehyde, 0.1 M Na- cacodylate buffer, pH 7.4 and 3mM CaCl2). After washing in cacodylate buffer, samples were incubated in 1% osmium tetroxide in 0.1 M PBS for 35 min. Then samples were washed in buffer several times for 10 minutes and dehydrated in an ascending ethanol series, including a step of uranyl acetate (1%) solution in 70% ethanol to increase contrast.
Dehydrated blocks were transferred to propylene oxide before being placed into
Durcupan resin. Blocks were placed in thermostat for 48 h at 56 °C. From the embedded blocks, 1 µm-thick semithin and serial ultrathin sections (70 nm) were cut with a Leica ultramicrotome, and mounted either on mesh, or on Collodion-coated (Parlodion, Electron Microscopy Sciences) single-slot copper grids. Additional contrast was provided to these sections with uranyl acetate and lead citrate solutions, and they were examined with a JEOL1200EX-II electron microscope. Areas of subsarcolemmal (SSM), interfibrillar mitochondria (IFM) and lipid droplets were measured by free hand polygon selection in iTEM Imaging Platform.
5.13 Mitochondrial enzyme activity measurements
Fresh myocardial samples were homogenized from Long-Evans rats in 1/30 weight per volume Chappel-Perry buffer (100 mM KCl, 5 mM MgCl2, 1 mM EDTA, 50 mM Tris, pH: 7.5) supplemented with 15 mg/L trypsine-inhibitor, 15.5 mg/L benzamidine, 5 mg/L leupeptin and 7 mg/L pepstatin A. All enzyme activities were measured as duplicates with a photometer (Cary 50 Scan UV-Visible Spectrophotometer, Varian).
Before adding substrate or cofactor, the reaction mix was incubated at 30 °C for 10 min (except for cytochrome c oxidase). Enzyme activities were expressed relative to citrate synthase activity or total protein levels (measured with Bicinchoninic Acid assay). The activity of rotenone-sensitive NADH:ubiquinone-oxidoreductase (Complex I) was measured at 340 nm in the presence of 1 mM EDTA, 2.5 mM KCN, 1 µM antimycin A and 20 µM rotenone after adding coenzyme Q and NADH to a final concentration of 60 µM. The activity of NADH:cytochrome c-oxidoreductase (Complex I+III) was measured at 550 nm as the antimycin A- and rotenone-sensitive fraction of total NADH-cytochrome c oxidoreductase in the presence of 0.1 mM EDTA, 3 mM KCN and 0.1% cytochrome c after adding NADH to a final concentration of 0.2 mM. The activity of succinate:cytochrome c-oxidoreductase (Complex II+III) was measured at 550 nm in the presence of 0.1 mM EDTA, 2.5 mM KCN, 0.1% bovine serum albumin and 4 mM succinate after adding cytochrome c to a final concentration of 0.1%. The activity of succinate-dehydrogenase was measured at 600 nm in the presence of 0.1 mM EDTA, 2.5 mM KCN, 0.1% bovine serum albumin and 2 mM succinate after adding 2,6- dichloroindophenol and phenazine-methosulfate to a final concentration of 34.9 µM and 1.625 mM, respectively. The activity of cytochrome c-oxidase was measured at 550 nm