Exacerbated Responses to Oxidative Stress by an Na
ⴙLoad in Isolated Nerve Terminals: the Role of ATP Depletion and
Rise of [Ca
2ⴙ]
iChristos Chinopoulos, Laszlo Tretter, Adrienn Rozsa, and Vera Adam-Vizi
Department of Medical Biochemistry, Neurochemical Group, Semmelweis University of Medicine, Budapest H-1444, Hungary
We have explored the consequences of a [Na⫹]i load and oxidative stress in isolated nerve terminals. The Na⫹load was achieved by veratridine (5–40M), which allows Na⫹entry via a voltage-operated Na⫹ channel, and oxidative stress was induced by hydrogen peroxide (0.1–0.5 mM). Remarkably, nei- ther the [Na⫹]iload nor exposure to H2O2had any major effect on [Ca2⫹]i, mitochondrial membrane potential (⌬m), or ATP level. However, the combination of an Na⫹load and oxidative stress caused ATP depletion, a collapse of ⌬m, and a pro- gressive deregulation of [Ca2⫹]i and [Na⫹]i homeostasis. The decrease in the ATP level was unrelated to an increase in [Ca2⫹]iand paralleled the rise in [Na⫹]i. The loss of⌬m was prevented in the absence of Ca2⫹but unaltered in the presence of cyclosporin A. We conclude that the increased ATP con-
sumption by the Na,K–ATPase that results from a modest [Na⫹]iload places an additional demand on mitochondria met- abolically compromised by an oxidative stress, which are un- able to produce a sufficient amount of ATP to fuel the ATP- driven ion pumps. This results in a deregulation of [Na⫹]iand [Ca2⫹]i, and as a result of the latter, collapse of ⌬m. The vicious cycle generated in the combined presence of Na⫹load and oxidative stress could be an important factor in the neuro- nal injury produced by ischemia or excitotoxicity, in which the oxidative insult is superimposed on a disturbed Na⫹ homeostasis.
Key words: oxidative stress; Na⫹load; mitochondrial mem- brane potential; ATP depletion; Na⫹ deregulation; Ca2⫹
deregulation
Oxidative stress has been associated with neuronal death ob- served in a variety of neurodegenerative diseases and in ischemia (Schmidley, 1990; Phillis, 1994) (see also Beal, 1995). Hydrogen peroxide is a convenient means to model oxidative stress, because the insult is relatively mild compared with that induced by other reactive oxygen species (Zoccarato et al., 1995; Tretter and Adam-Vizi, 1996), thus enabling the resolution of early alter- ations in cellular functions. It has been suggested that excessive production of this oxidant contributes to the pathogenesis of Parkinson’s disease (Schapira, 1994) and cellular damage occur- ring during reperfusion (Turrens et al., 1991; Hyslop et al., 1995).
The dysfunctions developing in nerve terminals during acute exposure to the oxidant include depolarization of the plasma membrane, a small increase in resting [Ca2⫹]i (Tretter and Adam-Vizi, 1996), and a decrease in the ATP level and [ATP]/
[ADP] ratio (Zoccarato et al., 1995; Tretter et al., 1997). Al- though these changes are modest, the oxidant applied at small concentrations (⬍1 mM) is able to induce delayed cytotoxicity (Whittemore et al., 1995; Desagher et al., 1996; Gardner et al., 1997; Hoyt et al., 1997).
It appears that it could also be acutely more harmful when the oxidative stress is combined with other burdens. An implication
for this has been provided by a recent observation that the membrane potential ofin situmitochondria (⌬m) is maintained in the presence of H2O2, but when complex I or theF0F1-ATPase are also inhibited, themselves without effect on⌬m, mitochon- drial membrane potential collapses (Chinopoulos et al., 1999). It has also been reported that H2O2potentiates a decrease in⌬m induced by glutamate excitotoxicity (Scanlon and Reynolds, 1998).
Oxidative stress is a condition thatin vivooften occurs concur- rently with other disruptions. In this study we specifically exam- ined the energy state, mitochondrial function, and ion homeosta- sis in nerve terminals during H2O2-induced oxidative stress superimposed on a disruption in Na⫹homeostasis. The impor- tance of this question is indicated by the observations showing that Na⫹entry is a critical factor in the cellular injury produced by ischemia/reperfusion (Waxman et al., 1994; Weber and Tay- lor, 1994; Probert et al., 1997; Stys and Lopachin, 1998; Zhang and Lipton, 1999) (see also Urenjak and Obrenovitch, 1996).
Furthermore, it has been reported that disruption in [Na⫹]i
homeostasis developing during ischemia is worsened during reperfusion (Rose et al., 1998; Taylor et al., 1999). The mecha- nism of the exacerbated deregulation of ions is poorly under- stood. Injury induced by reperfusion is generally thought to be associated with increased production of reactive oxygen species (Cao et al., 1988; Halliwell, 1992; Siesjo¨ et al., 1995).
Glutamate excitotoxicity is another condition involving both increase in [Na⫹]iand oxidative stress. Excessive stimulation of NMDA receptors leads to an increase in [Na⫹]i(Kiedrowski et al., 1994a,b) and has also been demonstrated to result in an overproduction of reactive oxygen species (Coyle and Putt- farcken, 1993; Lafon-Cazal et al., 1993; Patel et al., 1996).
Received July 14, 1999; revised Dec. 21, 1999; accepted Dec. 27, 1999.
This work was supported by grants to V. A.-V. from Orszagos Tudomanyos Kutatasi Alap, Egeszsegugyi Tudomanyos Tanacs, Oktatasi Miniszterium, and Magyar Tudomanyos Akademia. We thank Dr. Michael Duchen for helpful sug- gestions during preparation of this manuscript. Thanks are expressed to K. Taka´cs and K. Zo¨lde for excellent technical assistance.
Correspondence should be addressed to Dr. Vera Adam-Vizi, Department of Medical Biochemistry, Semmelweis University of Medicine, Budapest, H-1444, P.O.
Box 262, Hungary. E-mail: AV@puskin.sote.hu.
Copyright © 2000 Society for Neuroscience 0270-6474/00/202094-10$15.00/0
Our study, which is the first to address directly the role of Na⫹ load in the acute cellular responses to oxidative stress, might aid in understanding the factors and mechanisms contributing to cellular injury and death in response to an oxidative insult.
MATERIALS AND METHODS
Preparation of synaptosomes.Isolated nerve terminals (synaptosomes) were prepared from brain cortex of guinea pigs by a method detailed previously (Adam-Vizi and Ligeti, 1984). Synaptosomes obtained from an 0.8Msucrose gradient were diluted with ice-cold distilled water to a concentration of 0.32Mand then centrifuged at 20,000⫻gfor 20 min.
The pellet was suspended in 0.32Msucrose (20 mg/ml protein) and kept on ice, and 50l aliquots, for further manipulation, were incubated in a standard medium (in mM: 140 NaCl; 3 KCl; 2 MgCl2; 2 CaCl2; 10 PIPES, pH 7.38, and 10 glucose) at 37°C.
Determination of⌬m.Membrane potential ofin situmitochondria was determined by 5,5⬘, 6,6⬘-tetrachloro-1,1,3,3⬘-tetraethylbenzimidazolyl- carbocyanine iodide (JC-1), a fluorescence probe that accumulates in mitochondria and forms J-aggregates from monomers. It has been dem- onstrated that both the fluorescence of J-aggregate at 590 nm (Reers et al., 1991) and that of the monomer at 530 nm (DiLisa et al., 1995) reflect
⌬m. Synaptosomes suspended in Ca2⫹-free standard medium were loaded with JC-1 (30M) for 15 min at 37°C. After sedimentation and washing, synaptosomes were resuspended (8 mg/ml), and for fluores- cence measurements, 50l aliquots were diluted in 2 ml of standard medium. Fluorescence intensity was determined at 37°C in a PTI (Mon- mouth Junction, NJ) Deltascan fluorescence spectrophotometer. We have previously shown (Chinopoulos et al., 1999) that H2O2causes a nonspecific decrease in the signal at 595 nm that is unrelated to⌬m, however fluorescence at 535 nm reliably reflects changes in⌬m, there- fore we have used only the emission from the monomer recorded at 535 nm in the present study.
Determination of [Na⫹]i. Synaptosomes were loaded with sodium- binding benzofuran isophthalate (SBFI; 10 M) by incubation in a standard medium, in which sodium had been iso-osmotically replaced with sucrose and Pluronic acid (0.3%) was added for 60 min at 37°C. As described previously (Deri and Adam-Vizi, 1993) the use of Na⫹-free medium enables the monitoring of the dye accumulation in synaptosomes during the loading period. After sedimentation and washing, the pellet was resuspended (8 mg/ml), and 50l aliquots were used in a cuvette containing 1.5 ml of standard medium. The fluorescence of intrasynap- tosomally trapped SBFI was measured using 340/380 nm excitation and 510 nm emission wavelengths in a PTI Deltascan fluorescence spectro- photometer at 37°C. A calibration curve to quantify [Na⫹]iin millimolar concentration was constructed in the presence of 3Mgramicidin in a medium containing different concentrations of Na⫹, as described previ- ously (Deri and Adam-Vizi, 1993).
Determination of [Ca2⫹]i. Nerve terminals were loaded with fura-2 by incubation in the standard medium containing 8Mfura-2 AM at 37°C (4 mg/ml) for 60 min. After sedimentation and washing synaptosomes were resuspended in the standard medium to give an 8 mg/ml protein concentration, and 50l aliquots in 2 ml medium were used for deter- mination. Fluorescence intensity was measured in a PTI Deltascan fluorescence spectrophotometer using 340/380 nm excitation and 510 nm emission wavelengths. [Ca2⫹]iwas calculated using the ratio calibration approach described by Grynkiewicz et al. (1985).
ATP and ADP measurement.ATP and ADP levels were determined according to the luciferin–luciferase method as described by Kauppinen and Nicholls (1986) and detailed previously (Tretter et al., 1997). Biolu- minescence was detected with an LKB (Turku, Finland) Luminometer 1251. Results are expressed as nanomoles of ATP per milligram of synaptosomal protein and as [ATP]/[ADP] ratio.
Materials. Standard laboratory chemicals were obtained from Sigma (St. Louis, MO). Fura-2 and SBFI were purchased from Calbiochem (San Diego, CA), JC-1 was obtained from Molecular Probes (Eugene, OR).
Statistics. Results are expressed as mean ⫾ SE values. Statistical significance was calculated using a one-way ANOVA followed by Dun- nett’s test. Differences were considered significant at a level ofp⬍0.05.
RESULTS
The effect of oxidative stress combined with a Naⴙ load on [Naⴙ]ihomeostasis
To investigate [Na⫹]ihomeostasis in nerve terminals, a Na⫹load was induced by veratridine, which blocks the inactivation of voltage-dependent Na⫹channels and shifts the activation to more negative membrane potential, thereby causing persistent channel activation (Catterall, 1980). By allowing Na⫹ entry via these channels, veratridine enhances [Na⫹ ]i (Deri and Adam-Vizi, 1993) and induces depolarization and Ca2⫹influx in nerve ter- minals (Adam-Vizi and Ligeti, 1986). Resting [Na⫹]i in nerve terminals was 12⫾2.4 mM(n⫽36), and Figure 1aindicates that with the addition of 40Mveratridine [Na⫹]istarted to increase and attained a stable elevated level within a few minutes. [Na⫹]i
at the end of a 20 min incubation period with 40Mveratridine was 43⫾3.1 mM(n⫽1 4). Oxidative stress induced by H2O2(0.1 mM) alone caused only a slow and relatively small increase in [Na⫹]ireaching 21⫾1.3 mM(n⫽1 4) over an incubation period of 20 min (Fig. 1a, trace a) (see also Tretter and Adam-Vizi, Figure 1. [Na⫹]imeasured in nerve terminals loaded with SBFI.a,H2O2
(0.1 mM) was added at 300 sec without previous treatment (trace a) or 200 sec after stimulation with 40Mveratridine (trace c).Trace bshows the effect of veratridine applied as indicated, without subsequent addition of H2O2.b,Veratridine was added at 100 sec in 5 (trace a), 10 (trace b), 20 (trace c), or 40Mconcentration (trace d), then H2O2was given in 0.1 mM
concentration. Traces are representative of four independent experi- ments. Basal [Na⫹]iwas 12⫾2.4 mM(n⫽36). Quantitative data of these experiments are included in Figure 3.
1996). When H2O2 was applied subsequently to veratridine, a large additional increase in [Na⫹]iwas induced, which was con- tinuous, and no new [Na⫹]i equilibrium was attained. It is re- markable that a modest initial [Na⫹]iload was sufficient for the subsequent oxidative stress to induce a large additional increase in [Na⫹]i (Fig. 1b). When [Na⫹]i was higher by only a few millimolar concentration (18⫾2 mM;n⫽1 4) at the time of the oxidant application (in the presence of 5Mveratridine), [Na⫹]i
was greatly enhanced by 0.1 mMoxidant and reached 58⫾5 mM (n⫽1 4) by the end of a 20 min recording period (Fig. 1b), and the higher the initial [Na⫹]i, the larger was the extent of the oxidant-induced [Na⫹]i.
It has been reported that under exposure to veratridine mito- chondrial respiration is accelerated to produce sufficient amount of ATP for the Na,K–ATPase (Pastuszko et al., 1981), enabling a new [Na⫹]iequilibrium at an elevated level to be sustained. The question arises whether an additional [Na⫹]irise in the presence of the oxidant could be the result of an impaired extrusion of Na⫹ from the cytosol by the Na,K–ATPase. This was examined by the application of tetrodotoxin (TTX; 1M) at different time points to block Na⫹ entry via voltage-operated Na channels (Fig. 2).
After addition of TTX subsequent to stimulation with veratri- dine, [Na⫹]istarted to decrease from an elevated level (38⫾3 mM;n⫽6) and returned close to the baseline level (18⫾2.3 mM; n ⫽ 6; measured 5 min after addition of TTX), reflecting the restoration of the normal Na⫹equilibrium caused by extrusion of Na⫹ by the Na,K–ATPase (Fig. 2, trace a). When TTX was applied together with the oxidant (Fig. 2,trace b), [Na⫹]iwas only slightly decreased immediately after the application of TTX, but then remained at an elevated level (37⫾3.1 mM;n⫽6; measured 5 min after addition of TTX). Likewise, TTX given 200 sec after the oxidative challenge, at an even higher [Na⫹]i(65⫾4 mM;n⫽ 6) (Fig. 2, trace c), prevented further increase in [Na⫹]i, but [Na⫹]i showed no tendency of returning to the baseline level (64 ⫾ 3.7 mM; n ⫽ 6; measured at the end of the 20 min incubation). These results indicate the inability of the Na,K–
ATPase to reestablish normal [Na⫹]i from an elevated level during exposure to an oxidative insult.
ATP depletion caused by a combined action of H2O2- induced oxidative stress and [Naⴙ]irise: correlation between ATP depletion and deregulation of [Naⴙ]i
Next we wanted to examine whether an insufficient ATP supply could be responsible for the failure of the Na,K–ATPase in the combined presence of oxidative stress and a [Na⫹]iload.
It has been reported that incubation of synaptosomes with veratridine leads to a decrease in the ATP content attributable to stimulation of the Na,K–ATPase caused by an increase in [Na⫹]i
(Erecinska and Dagani, 1990; Erecinska et al., 1996). We have shown recently that H2O2 decreases NADH production in the citric acid cycle, thus limiting the respiratory capacity in nerve terminals (Chinopoulos et al., 1999), and, consistent with this, decreasing the ATP content (Tretter et al., 1997). The possibility emerges from these observations that mitochondria with an im- paired respiratory capacity during oxidative stress may not be able to generate a sufficient amount of ATP to fuel the Na,K–
ATPase under an increased demand created by a small rise in [Na⫹]i. Table 1 indicates that indeed there was a drastic fall in the ATP content and [ATP]/[ADP] ratio when nerve terminals were challenged with H2O2during stimulation with veratridine. The control ATP content corresponds to 1.56 mMATP concentration in the synaptoplasm (calculated with a cytosolic volume of 2.4
l/mg protein; Adam-Vizi and Ligeti, 1984) being in good agree- ment with data previously reported for this preparation (Kaup- pinen and Nicholls, 1986) (see also Erecinska et al., 1996). It should be mentioned that this ATP level and [ATP]/[ADP] ratio is somewhat smaller than those measured in cultured cells (Silver et al., 1997) or different tissues (Erecinska and Wilson, 1982), although great variations can occur in the [ATP]/[ADP] ratio depending on the activity of the tissues (Erecinska and Wilson, 1982). The low ATP level (0.52⫾0.03 nmol/mg; corresponding to 216Min the synaptoplasm), reached 7 min after application of the oxidative insult, was stable, and no further decrease was seen over an incubation for 20 min (data not shown). The obser- vation that veratridine itself induces a⬃25% decrease in ATP Figure 2. The effect of TTX on [Na⫹]i given after veratridine in the
absence or presence of H2O2. Veratridine (40M) was applied at 100 sec, then 1MTTX (trace a) or TTX⫹0.5 mMH2O2(b) was applied at 300 sec. Fortrace c, TTX was applied at 500 sec. Fortrace d, veratridine and H2O2were added as indicated without TTX. Traces are representative of three independent experiments made in duplicate.
Table 1. ATP and [ATP]/[ADP] ratio in the presence of H2O2and veratridine
ATP nmol/mg [ATP]/[ADP]
Control 3.76⫾0.003 7.3 ⫾0.23
Veratridine 2.95⫾0.13* 6.7 ⫾0.26
H2O2 2.4 ⫾0.09* 3.77⫾0.09*
Veratridine⫹H2O2 0.52⫾0.03*a 0.87⫾0.06*a Veratridine⫹H2O2(no Ca2⫹) 0.48⫾0.04* 0.86⫾0.04*
Ouabain 3.70⫾0.05 7.24⫾0.17
Ouabain⫹H2O2 1.77⫾0.09*a 3.09⫾0.20*a Veratridine⫹ouabain 3.7 ⫾0.03 8.19⫾0.15*
Veratridine⫹H2O2⫹ouabain 1.24⫾0.04*b 2.72⫾0.18*b Synaptosomes were incubated for 12 min in standard medium, and ATP level and [ATP]/[ADP] ratio were determined at the end of the incubation. Additions were as described for Figure 1. H2O2(0.5 mM) was applied at 300 sec after addition of veratridine (40M) at 100 sec, where indicated. Ouabain (500M) was given at 50 sec. “No Ca2⫹” indicates that the experiment was performed in a medium contain- ing no added Ca2⫹ and 100M EGTA. The control ATP level (without any addition) measured in a Ca2⫹-free medium was not significantly different (3.85⫾ 0.04 nmol/mg;n⫽4) from the control shown in the Table. Data are the average of four experiments⫾SE (n⫽4).
*Significantly different compared with the respective control values.
aSignificantly different compared with values obtained with veratridine or H2O2
alone.
bSignificantly different compared with the value obtained with veratridine⫹H2O2
(p⬍0.001).
level, which could be prevented by preincubation with ouabain, agrees with the findings of Erecinska and Dagani (1990). It is important to note that the ATP depletion induced by H2O2and veratridine was independent of extracellular [Ca2⫹] as in the absence of Ca2⫹a similar, very low level of ATP (0.48 ⫾0.04 nmol/mg;n⫽4) was measured. It is also demonstrated in Table 1 that ouabain, which could prevent the excessive utilization of ATP by the Na,K–ATPase, significantly attenuated both the ATP loss (1.24 ⫾ 0.04 vs 0.52 ⫾ 0.03 nmol/mg protein) and the decrease in the [ATP]/[ADP] ratio (2.72⫾0.18 vs 0.87 ⫾0.06 nmol/mg) induced by veratridine plus H2O2. The restoration of ATP under this condition was significant, but ouabain failed to fully protect ATP to the level seen with H2O2alone. This may be related to the effect of ouabain on the ATP level in the presence of H2O2 (1.77 ⫾ 0.09 nmol/mg). The mechanism for this is unclear but may be the result of an altered [Na⫹]i and [K⫹]i, which, together with an inhibition of the TCA cycle by H2O2
(Chinopoulos et al., 1999), could result in a larger decrease in the ATP level.
These results strongly suggest that compromised mitochondria under oxidative stress are unable to balance an increased ATP demand created by the stimulation of the Na⫹pump caused by an increase in [Na⫹]i. Therefore, the sustained Na⫹ load, which itself results in a stable [Na⫹]irise, when it has an oxidative insult superimposed on it, could produce a vicious cycle in which the initial [Na⫹]iload, by stimulating the Na,K–ATPase, leads to an ATP depletion which, in turn, restricts extrusion of Na⫹, leading to an additional increase in [Na⫹]i. Data shown in Figure 3 appear to reinforce this interpretation. The rise in [Na⫹]i in- duced by H2O2 in veratridine-treated nerve terminals was re- markably parallel with a decrease in the ATP level (Fig. 3). In agreement with a previous report (Erecinska and Dagani, 1990), veratridine itself (5–40M) caused only a small change in the ATP level; in fact, significant decrease was only observed in the presence of 40Mveratridine (Fig. 3b). However, the addition of H2O2(0.1 or 0.5 mM) induced a large decrease in the ATP level and, parallel with this, higher increases in [Na⫹]i(Fig. 3).
Collapse of⌬m in the presence of veratridine and H2O2
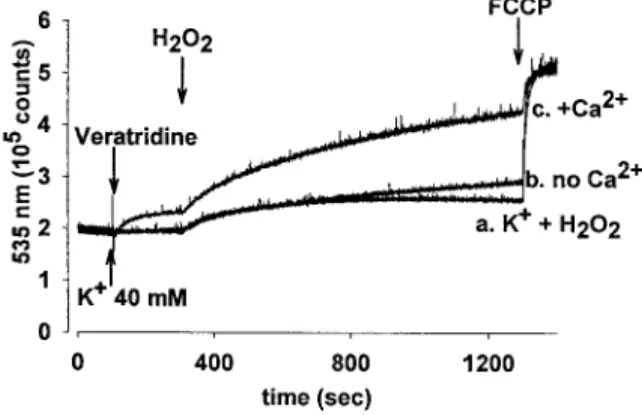
Given the ATP depletion caused by the combined presence of oxidative stress and a [Na⫹]iload, we wanted to investigate the state of mitochondria under this condition. For this, ⌬m was measuredin situby monitoring the fluorescence of JC-1 at 535 nm. Figure 4, trace b, shows that JC-1 monomer fluorescence was only marginally and transiently increased in the presence of 40
Mveratridine, indicating that plasma membrane depolarization and an increase in [Na⫹]ihave no significant influence on⌬m.
Application of veratridine in higher concentrations (up to 80M) gave essentially the same result (data not shown). We have reported recently that H2O2itself has no effect on⌬m (Chino- poulos et al., 1999), which is also demonstrated in Figure 4, trace a. However, when H2O2 (0.1–0.5 mM) was applied to nerve terminals depolarized previously by veratridine (40M), an in- crease in the monomer fluorescence was observed that was pro- portional to the concentrations of H2O2 (Fig. 4, traces c–e). A concentration of 0.5 mM H2O2 applied after veratridine nearly completely collapsed⌬m over an incubation period of 20 min.
The effect of H2O2 on ⌬m was dependent on Ca2⫹; in the absence of extracellular Ca2⫹(no added Ca2⫹⫹100MEGTA present in the medium), addition of H2O2subsequent to veratri- dine produced a significantly attenuated change in⌬m (Fig. 5),
suggesting that the effect of H2O2on⌬m was associated with a rise in [Ca2⫹]i. Pretreatment of synaptosomes with 10Mcyclo- sporin A had no influence on the collapse of ⌬m induced by veratridine and H2O2(data not shown).
We addressed the question whether depolarization of the plasma membrane, or alternatively an increase in [Na⫹]iinduced by veratridine, plays a role in the loss of⌬m by H2O2 when added after veratridine. To resolve this, we applied an alternative means to depolarize nerve terminals, using high [K⫹], which activates voltage-operated calcium channels (VOCCs), giving rise to a [Ca2⫹]isignal (Ashley et al., 1984) without inducing any change in [Na⫹]i (Deri and Adam-Vizi, 1993). Figure 5 shows that 40 mM[K⫹] itself did not influence⌬m, and H2O2(0.5 mM) added 200 sec after K⫹ had only a marginal effect. This is in marked contrast to what was observed when H2O2 was added after veratridine, in spite of a larger depolarization induced by 40 mMK⫹(⬃43 mV) than that caused by 40Mveratridine (⬃28 mV; Adam-Vizi and Ligeti, 1984). These results suggest that plasma membrane depolarization, even when sustained for 20 min, has no influence on⌬m; in contrast, an increase in [Na⫹]i
Figure 3. H2O2 induced increase in [Na⫹]i and decrease in [ATP].
Additions were as described for Figure 1. Veratridine was given in different concentrations without further addition (Œ) or followed by treatment with H2O2at 300 sec in 0.1 mM(f) or 0.5 mM(F) concentra- tions. [Na⫹]i (a) and ATP level (b) measured at 720 sec in parallel samples are shown as a function of veratridine concentrations. Data are the average of four determinations⫾SE. SE is not shown where it is smaller than the symbol. *Significantly different from data obtained with veratridine alone.
appears to have a great impact on the state of mitochondria subsequently exposed to an oxidative insult. It is important to note that increase in [Na⫹]i itself, in the absence of oxidative stress, has no effect on⌬m; even very high [Na⫹]ialone, in the presence of 500Mouabain and 40Mveratridine (⬃70–80 mM), was without significant effect on⌬m (data not shown).
A statistical summary of the results shown in Figures 4 and 5 is given in Table 2, indicating that H2O2 in combination with veratridine significantly increased the fluorescence of JC-1 at 535 nm. A large part of this required the presence of Ca2⫹in the medium; in the absence of Ca2⫹the increase in the fluorescence, although statistically significant, was marginal.
[Ca2ⴙ]irise in the presence of veratridine and H2O2is parallel with a decrease in⌬m
The question arises why ⌬m collapses under oxidative stress when combined with a [Na⫹]iload and what is reflected in the Ca2⫹-dependent character of the loss of⌬m.
To determine whether oxidative stress could enhance the veratridine-evoked [Ca2⫹]iincrease accounting for the collapse of⌬m, [Ca2⫹]iwas measured under identical conditions to those Figure 6. [Ca2⫹]imeasured in synaptosomes loaded with fura-2. Nerve terminals were depolarized by 40 mMK⫹(traces b–d) or 40Mveratri- dine (traces e–g) applied at 100 sec, then H2O2was added in 0.1, 0.2, or 0.5 mMconcentrations as indicated.Trace ashows the effect of 0.5 mMH2O2
given at 100 sec. Traces are representative of four determinations.
Table 3. [Ca2ⴙ]i5 or 15 min after addition of H2O2in the presence of veratridine
[Ca2⫹]inM
5 min 15 min
Control 280⫾41 307⫾36
Veratridine 40M 450⫾45 475⫾30
⫹H2O20.1 mM 770⫾53* 1353⫾156*a
⫹H2O20.2 mM 911⫾85*a 1549⫾130*a
⫹H2O20.5 mM 1118⫾44*a 2100⫾61*a
Experimental conditions were as described for Figure 6. Veratridine was added at 100 sec, followed by addition of H2O2at 300 sec. [Ca2⫹]ivalues obtained at 600 or 1200 sec (5 or 15 min after application of H2O2) are shown. Values (⫾SE) are average of four independent determinations (n⫽4).
*Significantly different from the respective control values.
aSignificantly different from the value obtained with veratridine alone (p⬍0.001).
Figure 4. Fluorescence of JC-1 at 535 nm in the presence of veratridine and H2O2. Synaptosomes loaded with JC-1 were incubated in a standard medium (0.2 mg/ml). Veratridine (40M) was added at 100 sec followed by addition of H2O2at 300 sec in 0.1 mM(trace c), 0.2 mM(trace d), or 0.5 mMconcentrations (trace e).Traces aandbshow the effects of 0.5 mM
H2O2(a) and 40Mveratridine (b), respectively, given at 300 sec. Traces are representative of four independent experiments. A 1Mconcentra- tion of FCCP was added at the end of each experiment to generate a signal representing the total collapse of⌬m. Quantitative data of these experiments are included in Table 2.
Figure 5. The combined effect of veratridine and H2O2 on ⌬m is dependent on the presence of Ca2⫹in the medium. JC-1 fluorescence at 535 nm in response to veratridine (40 M) and H2O2 (0.5 mM) was measured in synaptosomes in the presence of 2 mMCa2⫹(trace c) or when Ca2⫹was lacking in the medium (no Ca2⫹was added, and 100M EGTA was present) (trace b).Trace ashows the effect of 0.5 mMH2O2
(300 sec) added subsequent to 40 mMK⫹(100 sec). Traces are represen- tative of three experiments. Quantitative data of these experiments are included in Table 2.
Table 2. Statistical analysis of data on fluorescence of JC-1 at 535 nm in the presence of veratridine and H2O2
No H2O2 H2O2
Control 2.07⫾0.04 2.11⫾0.01 (0.5 mM)
Veratridine 2.20⫾0.03 3.57⫾0.02 (0.1 mM)*
Veratridine 2.20⫾0.03 3.95⫾0.02 (0.2 mM)*
Veratridine 2.20⫾0.03 4.30⫾0.01 (0.5 mM)*a Veratridine (no Ca2⫹) 2.30⫾0.05 2.75⫾0.02 (0.5 mM)*a
K⫹ 2.10⫾0.02 2.35⫾0.05 (0.5 mM)*
Values of relative fluorescence (105counts) monitored in the experiments presented in Figures 4 and 5 at 1000 sec are shown. Veratridine (40M) or KCl (40 mM) was added at 100 sec without further addition, or H2O2 was given at 300 sec at concentrations indicated in parentheses. Data are average⫾SE values of three (for K⫹and “no Ca2⫹”) or four experiments.
*Significantly different compared with the control value (p⬍0.001).
aSignificantly different compared with one another (p⬍0.001).
used in the experiments for monitoring⌬m. We found (Fig. 6, Table 3) that veratridine (40 M) induced a moderate rise in [Ca2⫹]iand, similarly, H2O2itself caused only a slow and small increase in [Ca2⫹]i(White and Clarke, 1988) (see also Tretter and Adam-Vizi 1996). However, after addition of H2O2(0.1–0.5 mM) 200 sec after stimulation with veratridine, [Ca2⫹]istarted to increase further, and by the end of an incubation for 20 min [Ca2⫹]ireached 2100⫾61 nMin the presence of 0.5 mMH2O2
(Fig. 6,traces e–g, Table 3). This is likely to be an underestimated value, given the lowKmof fura-2 for Ca2⫹(Hyrc et al., 1997).
The rise in [Ca2⫹]i induced by H2O2 and [Na⫹]i load was unaltered by pretreatment with 10M cyclosporin A (data not shown). The rate of change of [Ca2⫹]iin the presence of vera- tridine and H2O2is very similar to that of⌬m shown in Figure 4. This, and the Ca2⫹ dependency of the decrease in ⌬m by H2O2shown in Figure 5, suggest that depolarization of mitochon- dria is related to an enhanced [Ca2⫹]irise induced by the oxidant in Na⫹-loaded nerve terminals. Consistent with this, H2O2ap- plied 200 sec after plasma membrane depolarization by 40 mM
K⫹, a condition resulting in no change of⌬m (Fig. 5,trace a), failed to induce a significant increase in [Ca2⫹]i(Fig. 6).
The correlation between an enhanced [Ca2⫹]irise and a fall in
⌬m was reinforced by the effect of TTX. Addition of TTX (1
M) to inhibit voltage-dependent Na⫹ channels 200 sec after imposition of the oxidative stress (Fig. 7) significantly attenuated the H2O2-induced [Ca2⫹]irise; [Ca2⫹]iincreased from 820⫾30
to 1110⫾50 nM(n⫽3) during the incubation period with TTX, whereas over a same period of incubation without TTX [Ca2⫹]i
reached 1910⫾70 nM(n⫽3). Parallel with changes in [Ca2⫹]i, the decrease in⌬m induced by H2O2 was also attenuated by TTX (Fig. 7b). This also indicates that Na⫹ entry is a critical factor both in the large increase of [Ca2⫹]iand in the mitochon- drial depolarization occurring in the combined presence of vera- tridine and H2O2. These results suggest that the collapse of⌬m is very likely to result from a large increase in [Ca2⫹]ioccurring when oxidative stress is superimposed on a [Na⫹]iload.
Basis for increase in [Ca2ⴙ]i
Figure 6 and Table 3 indicate that oxidative stress and [Na⫹]i
load initiate a large increase in Ca2⫹, which does not attain a new equilibrium, but rather exhibits the tendency of a continuous, uncontrolled [Ca2⫹]irise. The question arises as to what the underlying mechanism for this apparent Ca2⫹ deregulation could be.
Entry via VOCCs
The [Ca2⫹]isignal after depolarization by high [K⫹] is the result of activation of VOCCs followed by a rapid inactivation (Ashley et al., 1984; Alvarez Maubecin et al., 1995), thus the lack of effect of H2O2 on [Ca2⫹]iapplied after K depolarization shows that H2O2has no effect on VOCCs under these conditions. This was also indicated by the results that both [Ca2⫹]irise and mitochon- drial depolarization elicited by H2O2 in Na⫹-loaded synapto- somes were unaltered by pretreatment with inhibitors of N-, P-, Q- or L-type Ca2⫹ channels (-conotoxin, 1 M; -agatoxin IVA, 50 nM;-conotoxin MVIIC, 1M; and tai-conotoxin, 160 nM, respectively;n⫽3; data not shown). When nerve terminals incubated in Ca2⫹-free medium were challenged with veratridine plus the oxidant, no change in [Ca2⫹]iwas produced (data not shown). These results indicate that extracellular Ca2⫹is involved in the oxidant-induced [Ca2⫹]irise, but no Ca2⫹entry is likely to be mediated by VOCCs.
This latter finding requires a comment, because it has been shown recently that [Ca2⫹]isignal is enhanced when high [K⫹] is applied in the presence of the oxidant (Tretter et al., 1997), and consistent with this, H2O2has been reported to enhance Ca2⫹
influx via VOCCs (Li et al., 1998). The lack of effect of the oxidant on [Ca2⫹]iapplied after the depolarizing stimulus in this study might indicate that oxidative conditions should be present at the onset of the activation of VOCCs for the Ca2⫹influx to be enhanced, and addition of H2O2after the stimulus, even during a sustained depolarization, is no longer able to influence Ca2⫹
influx.
Activation of glutamate receptors
We also considered whether glutamate, which is assumed to be released from nerve terminals when stimulated with veratridine and H2O2, could contribute to the increase in [Ca2⫹]i, but neither the NMDA receptor antagonist MK 801 (10 M) nor GYKI 52466 (50M), blocker of the AMPA receptors had any influence on the [Ca2⫹]irise induced by 40 M veratridine and 0.5 mM H2O2(data not shown).
Effect of mitochondrial depolarization
Collapse of⌬m in many cells gives rise to an elevated [Ca2⫹]i
owing to an impaired buffering of Ca2⫹by mitochondria (Budd and Nicholls, 1996; Wang and Thayer, 1996; White and Reynolds, 1996). In nerve terminals no change in [Ca2⫹]icould be observed Figure 7. [Ca2⫹]irise and depolarization of⌬m induced by H2O2(0.5
mM) and veratridine (40 M) is diminished after addition of TTX.
Veratridine and H2O2were added as indicated, then 200 sec after H2O2, TTX (1M) was applied, and [Ca2⫹]i(a) and JC-1 fluorescence (b) were measured in parallel samples loaded with fura-2 or JC-1. Traces are representative of three independent experiments.
after dissipation of⌬m by rotenone (2M)/oligomycin (10M) either in the presence or in the absence of extracellular Ca2⫹
(data not shown), thus it is unlikely that [Ca2⫹]irise induced by veratridine and H2O2could be secondary to a loss of⌬m.
Inhibition of plasmalemmal Ca2⫹–ATPase
Given the severe ATP depletion induced by H2O2in the presence of veratridine, it is possible to propose that the large increase in [Ca2⫹]i under this condition results from an impaired ATP- dependent Ca2⫹removal, primarily by the plasmalemmal Ca2⫹– ATPase. This prediction was supported by experiments with ouabain, which is able to preserve a significant part of ATP during stimulation with veratridine and H2O2(Table 1). Figure 8 shows that in the simultaneous presence of ouabain (500M) and veratridine (40M), [Ca2⫹]iincreased to a slightly higher level compared to that observed with veratridine alone. This is in agreement with a higher [Na⫹]ipossibly driving more Ca2⫹into the terminals via the Na⫹–Ca2⫹exchanger known to be present in the plasma membrane of nerve terminals (Gill, 1982; Sanchez- Armass and Blaustein, 1987). The presence of ouabain along with veratridine attenuated the H2O2-induced increase in [Ca2⫹]i
(Fig. 8). The data in Table 4 show that ouabain attenuated [Ca2⫹]irise induced by H2O2 in Na⫹-loaded synaptosomes by
⬃50%. The remarkable correlation between the fall in [ATP] and the rise in [Ca2⫹]isuggests that inhibition of the ATP-dependent removal of [Ca2⫹]iby the Ca2⫹–ATPase in the plasmalemma is the cause of the increased [Ca2⫹]i. The evidence argues against the involvement of Ca2⫹entry via reversal of the plasmalemma Na⫹–Ca2⫹ exchanger. Although 40 M veratridine⫹ 500 M ouabain increased [Na⫹]i to 70–80 mM within a few minutes (data not shown), the Ca2⫹rise was only slightly higher than that caused by veratridine alone, where [Na⫹]i rose only to 40 mM
(Fig. 8). However, even this result does not entirely rule out the possibility that when the ATP level is also reduced simulta- neously, as observed with veratridine plus H2O2 (but not with veratridine plus ouabain), the reverse function of the Na⫹–Ca2⫹
exchanger could become significant. Unfortunately experiments with inhibitors of the Na⫹–Ca2⫹ exchanger (Bepridil, 10 M; 3⬘,4⬘-dichlorobenzamil; 10M) gave ambiguous results as Bepridil appears to interfere with Na⫹channels and prevent the effect of veratridine on [Na⫹]i, and 3⬘,4⬘-dichlorobenzamil gives fluores-
cent signals at the wavelengths used for measuring [Ca2⫹]iand [Na⫹]i(data not shown).
DISCUSSION
The major observation in the present study is that when oxidative stress occurs together with a Na⫹ load, the damaging effect of oxidative stress is greatly exacerbated. A key element in the dysfunction is a large fall in [ATP] in the combined presence of H2O2and Na⫹load. The basis for this is an increased utilization of ATP by the Na⫹pump activated by a Na⫹entry coupled with the inability of mitochondria to respond adequately with increas- ing ATP production because of limitation of the respiratory capacity by H2O2. This leads to a vicious cycle in which the [Na⫹]i
increase augments the decrease in [ATP], which, in turn, further inhibits the Na⫹pump, enhancing the [Na⫹]iincrease. The large fall in ATP gives rise to the inability to remove cytosolic Ca2⫹via the plasmalemmal ATPase. The resulting Ca2⫹ accumulation then leads to a collapse of⌬m.
A crucial effect of H2O2in the early stage of the oxidative insult appears to be the inhibition of ␣-ketoglutarate dehydrogenase and, as a consequence, a decrease in the mitochondrial NADH production (Chinopoulos et al., 1999). The ATP level under this condition, although decreased (Tretter et al., 1997), is still ade- quate to secure a resting function of the ATP-driven ion pumps in the plasma membrane, thus, the Na⫹and Ca2⫹electrochem- ical gradients are only slightly decreased (Tretter and Adam-Vizi, 1996), and⌬m is maintained (Chinopoulos et al., 1999).
When oxidative stress is imposed on nerve terminals in which [Na⫹]iis increased, a complex dysfunction develops with (1) a drastic fall in the ATP level, (2) a deregulation of [Na⫹]iand [Ca2⫹]i, and (3) the loss of⌬m. In the interpretation of these observations, the following questions have to be addressed: (1) what are the underlying mechanisms and the sequence of these changes?, and (2) what is their relevance to pathological condi- tions in which oxidative stress is assumed to have a pivotal role?
Fall in the ATP level
H2O2when given alone, produces not more than⬃30% decrease in the ATP level after incubation for 7 min (Table 1; Tretter et al., 1997). However, owing to a combined effect of oxidative stress and Na⫹load, the energy resources of nerve terminals are almost completely drained (Table 1, Fig. 3). The most obvious explana- tion for the development of the severe energy deficit is that mitochondria working with a limited respiratory capacity under oxidative stress (Chinopoulos et al., 1999) are unable to produce sufficient amount of ATP when an additional demand presents itself because of stimulation of the Na,K–ATPase by an increased [Na⫹]i. Preliminary experiments using different mitochondrial inhibitors together with a Na⫹load appear to be consistent with this interpretation (data not shown).
It is important to note that the energy deficit brought about by H2O2 when applied at an elevated [Na⫹]i is unrelated to an increase in [Ca2⫹]i(Fig. 6, Table 1). This strongly suggests that the decrease in ATP level is upstream from the large increase in [Ca2⫹]i. Since, in the absence of Ca2⫹, oxidative stress together with a Na⫹load deplete ATP at a sustained⌬m, the loss of ATP should be also upstream from the collapse of⌬m.
Dissipation of [Naⴙ] and [Ca2ⴙ] gradients
H2O2, when applied after veratridine, at an elevated [Na⫹]i, induced a large additional increase in [Na⫹]i (Fig. 1a,b). It appears most likely that, owing to the initial rise in [Na⫹]i
Figure 8. [Ca2⫹]irise induced by veratridine and H2O2in the presence or absence of ouabain. Veratridine (40M) and H2O2(0.2 mM) were added as indicated (a), and [Ca2⫹]iwas measured in fura-2-loaded nerve terminals. Ouabain (500M) was given 50 sec before veratridine (b), as indicated by thearrow. Traces are representative of three experiments.
Quantitative data are given in Table 4.
produced by veratridine, the Na,K–ATPase is already stimulated at the onset of the application of oxidative stress, but as a result of the effect of the oxidant on the mitochondria, as discussed above, ATP production becomes insufficient. This, in turn, would limit the function of the Na,K–ATPase, resulting in an additional gradual rise in [Na⫹]i. At an ATP level of 0.52⫾0.03 nmol/mg (216M) and with an [ATP]/[ADP] ratio reduced to 10% of the control (Table 1), Na⫹extrusion by the Na,K–ATPase should be severely impaired (Km for ATP is 200–400M; Erecinska and Dagani, 1990), accounting for the gradual collapse of the [Na⫹] gradient. Therefore the picture of a vicious cycle emerges, in which a relatively small Na⫹load aggravates the effect of oxida- tive stress creating gradually an energy deficit, which in turn leads to [Na⫹]ideregulation.
To this picture, another element, a large increase in [Ca2⫹]i
induced by the combination of oxidative stress and [Na⫹]iload should also be added (Fig. 6, Table 3). The increase is not caused by activation of VOCCs or glutamate receptors because antago- nists to these pathways did not affect [Ca2⫹] rise (data not shown).
It has been suggested that Ca2⫹ entry into rat optic nerves during anoxia is mediated by a reverse Na⫹–Ca2⫹ exchange (Stys et al., 1992). This seems unlikely to be the mechanism for the [Ca2⫹]i increase in this study because when [Na⫹]i was increased to 70–80 mM by the combination of ouabain and veratridine there was only a very small rise in [Ca2⫹]i. A caveat here is that the large fall in [ATP] when H2O2and veratridine are used may in some way activate Ca2⫹entry via this pathway. Such an effect of ATP has been described for the Na⫹–H⫹exchanger, which has a decreased affinity to H⫹when the level of ATP is decreased (Orlowski and Grinstein, 1997).
A possible interpretation consistent with our observations is that [Ca2⫹]ideregulation is related to the ATP depletion evolv- ing from the combined effects of oxidative stress and Na⫹load. It is expected that, similarly to that of the Na,K–ATPase, the function of the Ca2⫹–ATPase in the plasma membrane becomes also severely limited because of an insufficient ATP supply. The slow pattern of the [Ca2⫹]i rise (Fig. 6) is consistent with a [Ca2⫹]ideregulation caused by an impaired Ca2⫹extrusion by the Ca2⫹–ATPase. This interpretation is reinforced by the result that ouabain, which partly prevents the loss of ATP (Table 1), significantly attenuates the [Ca2⫹]i rise under this condition (Fig. 8).
Loss of⌬m
The gradual depolarization of mitochondria in response to H2O2
in Na⫹-loaded nerve terminals is clearly a Ca2⫹-dependent pro-
cess (Fig. 5) and occurs parallel with increases in [Ca2⫹]i(Fig. 7).
It could be expected that when [Ca2⫹]i is in the micromolar range, the mitochondrial permeability transition would be in- duced (Duchen et al., 1993), but we obtained no evidence for the involvement of a cyclosporin A-sensitive permeability transition in the collapse of⌬m. This is in contrast with the glutamate- induced mitochondrial depolarization, which is sensitive to cy- closporin A (Schinder et al., 1996; White and Reynolds, 1996).
Because⌬m is the driving force for Ca2⫹uptake by mitochon- dria, Ca2⫹uptake itself could discharge⌬m if not balanced by H⫹extrusion (Nicholls, 1985). This is the most likely mechanism for the Ca2⫹-dependent loss of ⌬m observed in the present study, given the limited capacity of the respiratory chain to maintain⌬m in the presence of the oxidant (Chinopoulos et al., 1999).
The increased [Na⫹]imight also potentiate the effect of Ca2⫹
on mitochondria by accelerating Ca2⫹efflux via the Na⫹–Ca2⫹
exchanger present in the mitochondria of excitable cells (Cromp- ton et al., 1978), contributing to a futile Ca2⫹cycling. In addition, reestablishing the Na⫹gradient across the mitochondrial inner membrane by the mitochondrial Na⫹–H⫹ exchange against a large [Na⫹]icould also be a contributing factor in the collapse of
⌬m.
Relevance to pathological conditions
A small Na⫹ load appears to be sufficient to exacerbate the condition created by oxidative stress, which could be an important contributing factor in the dysfunction developing during exces- sive stimulation of NMDA receptors or during reperfusion after an anoxic period, when the oxidative insult is superimposed on a disturbed [Na⫹] homeostasis.
It has been demonstrated that in NMDA-stimulated cells (1) [Na⫹]iis increased (Kiedrowski et al., 1994a, b), (2)⌬m is lost (Budd and Nicholls, 1996; Isaev et al., 1996; Schinder et al., 1996;
White and Reynolds, 1996), and (3) reactive oxygen species are produced (Lafon-Cazal et al., 1993; Dugan et al., 1995; Reynolds and Hastings, 1995; Patel et al., 1996). In the light of our obser- vations presented here, it could be assumed that the cytoplasmic Na⫹elevation, in addition to hampering Ca2⫹extrusion via the Na⫹–Ca2⫹exchanger (Kiedrowski et al., 1994a), could contrib- ute to cell death by aggravating the damage caused by the oxida- tive component of the excitotoxic stimulus. Consistent with this could be a recent report by Scanlon and Reynolds (1998) that exposure of forebrain neurons to hydrogen peroxide potentiated the mitochondrial depolarization caused by glutamate and that by Strijbos et al. (1996) suggesting that a TTX-sensitive Na⫹entry is Table 4. Comparison of the effect of H2O2on [Ca2ⴙ]iin the presence of veratridine with or
without ouabain
5 min 15 min
[Ca2⫹]inM ⌬[Ca2⫹]inM [Ca2⫹]inM ⌬[Ca2⫹]inM
Veratridine 418⫾39 430⫾41
⫹H2O2 866⫾51 448⫾31* 1466⫾102 1036⫾62a
Veratridine⫹Ouabain 530⫾10 550⫾25
⫹H2O2 733⫾11 203⫾20* 1000⫾70 450⫾60a Experimental conditions were as described for Figure 8. Veratridine (40M) was added at 100 sec, without further treatment (not shown in Fig. 5), or followed by addition of H2O2(0.2 mM) at 300 sec. Ouabain (500M) was given 50 sec before veratridine where indicated. [Ca2⫹]ivalues (⫾SE) obtained at 600 or 1200 sec (5 or 15 min after application of H2O2) in three independent experiment are shown (n⫽3). Basal [Ca2⫹]iwas 260⫾25 nM.
*aSignificantly different as compared with one another (p⬍0.001).
part of a vicious cycle that leads to neurodegeneration after stimulation of NMDA receptors.
It is well documented that oxygen–glucose deprivation induces [Na⫹]ideregulation (Hansen, 1985; Stys et al., 1992; Waxman et al., 1994; for review, see Urenjak and Obrenovitch, 1996), which further worsens during reperfusion (Rose et al., 1998; Taylor et al., 1999). Reperfusion injury is generally thought to be associ- ated with an increased production of reactive oxygen species (Cao et al., 1988; Halliwell, 1992), and consistent with this, presence of H2O2at a concentration of 0.1 mMhas been demon- strated in the striatum during reperfusion (Hyslop et al., 1995).
The severe energy deficit, the complex Na⫹and Ca2⫹deregula- tion, and the loss of⌬m induced by H2O2in Na⫹-loaded nerve terminals demonstrated in this study could indicate a mechanism by which cellular injury initiated during ischemia could be further augmented during reperfusion, preventing the restoration of nor- mal cellular functions.
REFERENCES
Adam-Vizi V, Ligeti E (1984) Release of acetylcholine from rat brain synaptosomes by various agents in the absence of external calcium ions.
J Physiol (Lond) 353:505–521.
Adam-Vizi V, Ligeti E (1986) Calcium uptake of synaptosomes as a function of membrane potential under different depolarizing condi- tions. J Physiol (Lond) 372:363–377.
Alvarez Maubecin V, Sanchez V N, Rosato Siri MD, Cherksey BD, Sugimori M, Llinas R, Uchitel OD (1995) Pharmacological character- ization of the voltage-dependent Ca2⫹ channels present in synapto- somes from rat and chicken central nervous system. J Neurochem 64:2544–2551.
Ashley RH, Brammer MJ, Marchbanks RM (1984) Measurement of intrasynaptosomal free calcium by using the fluorescence indicator Quin2. Biochem J 219:149–158.
Beal MF (1995) Aging, energy and oxidative stress in neurodegenerative diseases. Ann Neurol 38:357–366.
Budd SL, Nicholls DG (1996) A reevaluation of the role of mitochondria in neuronal Ca2⫹homeostasis. J Neurochem 66:403–411.
Cao W, Carney JM, Duchon A, Floyd RA, Chevion M (1988) Oxygen free radical involvement in ischemia and reperfusion injury to brain.
Neurosci Lett 88:233–238.
Catterall WA (1980) Neurotoxins that act on voltage-sensitive sodium channels in excitable membranes. Annu Rev Pharmacol Toxicol 20:15–43.
Chinopoulos C, Tretter L, Adam-Vizi V (1999) Reduced mitochondrial membrane potential in intact nerve terminals due to oxidative stress induced by hydrogen peroxide. J Neurochem 73:220–228.
Coyle JT, Puttfarcken PS (1993) Oxidative stress, glutamate and neuro- degenerative disorders. Science 262:689–695.
Crompton M, Moser R, Ludi H, Carafoli E (1978) The interrelations between the transport of sodium and calcium in mitochondria of vari- ous mammalian tissues. Eur J Biochem 82:25–31.
Desagher S, Glowinski J, Premont J (1996) Astrocytes protect neurons from hydrogen peroxide toxicity. J Neurosci 16:2553–2562.
Deri Z, Adam-Vizi V (1993) Detection of intracellular free Na⫹ con- centration of synaptosomes by a fluorescent indicator, Na⫹-binding benzofuran isophthalate: the effect of veratridine, ouabain, and
␣-latrotoxin. J Neurochem 61:818–825.
Di Lisa F, Blank PS, Colonna R, Gambassi G, Silverman H, Stern MD, Hansford RG (1995) Mitochondrial membrane potential in single liv- ing adult rat cardiac myocytes exposed to anoxia or metabolic inhibi- tion. J Physiol (Lond) 486:1–13.
Duchen MR, McGuinness O, Brown L, Crompton M (1993) The role of the cyclosporin-A sensitive mitochondrial pore in myocardial reperfu- sion injury. Cardiovasc Res 27:1790–1794.
Dugan LL, Sensi SL, Canyoniero LMT, Handran SD, Rothman SM, Lin T-S, Goldberg MP, Choi DW (1995) Mitochondrial production of reactive oxygen species in cortical neurons following exposure to N-methyl-D-aspartate. J Neurosci 15:6377–6388.
Erecinska M, Dagani F (1990) Relationships between the neuronal so- dium/potassium pump and energy metabolism. J Gen Physiol 95:591–616.
Erecinska M, Wilson DF (1982) Regulation of cellular energy metabo- lism. J Membr Biol 70:1–14.
Erecinska M, Nelson D, Silver IA (1996) Metabolic and energetic prop- erties of isolated nerve ending particles (synaptosomes). Biochim Bio- phys Acta 1277:13–34.
Gardner AM, Xu F-H, Fady C, Jacoby FJ, Duffey DC, Tu Y, Lichtenstein A (1997) Apoptotic versus nonapoptotic cytotoxicity induced by hy- drogen peroxide. Free Radic Biol Med 22:73–83.
Gill DL (1982) Sodium channel, sodium pump, and sodium-calcium ex- change activities in synaptosomal plasma membrane vesicles. J Biol Chem 257:10986–10990.
Grynkiewicz G, Poenie M, Tsien RY (1985) A new generation of Ca2⫹
indicators with greatly improved fluorescence properties. J Biol Chem 260:3440–3450.
Halliwell B (1992) Reactive oxygen species and the central nervous system. J Neurochem 59:1609–1623.
Hansen AJ (1985) Effect of anoxia on ion distribution in brain. Physiol Rev 65:101–148.
Hoyt KR, Gallagher AJ, Hastings TG, Reynolds IJ (1997) Character- ization of hydrogen peroxide toxicity in cultured rat forebrain neurons.
Neurochem Res 22:333–340.
Hyrc K, Handran SD, Rothman SM, Goldberg MP (1997) Ionized in- tracellular calcium concentration predicts excitotoxic neuronal death:
observations with low-affinity fluorescent calcium indicators. J Neurosci 17:6669–6677.
Hyslop PA, Yhang Y, Pearson DV, Phebus LA (1995) Measurement of striatal H2O2by microdialysis following global forebrain ischemia and reperfusion in the rat: correlation with the cytotoxic potential of H2O2
in vitro. Brain Res 671:181–186.
Isaev NK, Yorov DB, Stelmashook EV, Uybekov RE, Kozhemyakin MB, Victorov IV (1996) Neurotoxic glutamate treatment of cultured cere- bellar granule cells induces Ca2⫹-dependent collapse of mitochondrial membrane potential and ultrastructural alterations of mitochondria.
FEBS Lett 392:143–147.
Kauppinen RA, Nicholls DG (1986) Failure to maintain glycolysis in anoxic nerve terminals. J Neurochem 47:1864–1869.
Kiedrowski L, Brooker G, Costa E, Wroblewski JT (1994a) Glutamate impairs neuronal calcium extrusion while reducing sodium gradient.
Neuron 12:295–300.
Kiedrowski L, Wroblewski JT, Costa E (1994b) Intracellular sodium concentration in cultured cerebellar granule cells challenged with glu- tamate. Mol Pharmacol 45:1050–1054.
Lafon-Cazal M, Pietri S, Culcasi M, Bockaert J (1993) NMDA- dependent superoxide production and neurotoxicity. Nature 364:524–538.
Li A, Se´gui J, Heinemann SH, Hoshi T (1998) Oxidation regulates cloned neuronal voltage-dependent Ca2⫹channels expressed inXeno- pusoocytes. J Neurosci 18:6740–6747.
Nicholls DG (1985) A role for the mitochondrion in the protection of cells against calcium overload? (Kogure K, Hossmann KA, Siesjo¨ BK, Welsh FA, eds). Prog Brain Res 63:97–106.
Orlowski J, Grinstein S (1997) Na⫹/H⫹exchanger of mammalian cells.
J Biol Chem 272:22373–22376.
Pastuszko A, Wilson DF, Erecinska M, Silver IA (1981) Effects of in vitro hypoxia and lowered pH on potassium fluxes and energy metab- olism in rat brain synaptosomes. J Neurochem 36:116–123.
Patel M, Day BJ, Crapo JD, Fridovich I, McNamara JO (1996) Require- ment for superoxide in excitotoxic cell death. Neuron 16:345–355.
Phillis JW (1994) A “radical” view of cerebral ischemic injury. Prog Neurobiol 42:441–448.
Probert AW, Borosky S, Marcoux FW, Taylor CP (1997) Sodium chan- nel modulators prevent oxygen and glucose deprivation injury and glutamate release in rat neocortical cultures. Neuropharmacology 1031–1038.
Reers M, Smith TW, Chen LB (1991) J-aggregate formation of a carbo- cyanine as a quantitative fluorescent indicator of membrane potential.
Biochemistry 30:4480–4486.
Reynolds IJ, Hastings TG (1995) Glutamate induces the production of reactive oxygen species in cultured forebrain neurons following NMDA receptor activation. J Neurosci 15:3318–3327.
Rose CR, Waxman SG, Ransom BR (1998) Effects of glucose depriva- tion, chemical hypoxia, and simulated ischemia on Na⫹homeostasis in rat spinal cord astrocytes. J Neurosci 18:3554–3562.
Sanchez-Armass S, Blaustein MP (1987) Role of sodium-calcium ex-
![Table 1. ATP and [ATP]/[ADP] ratio in the presence of H 2 O 2 and veratridine](https://thumb-eu.123doks.com/thumbv2/9dokorg/1365492.111490/3.907.83.419.91.344/table-atp-atp-adp-ratio-presence-h-veratridine.webp)
![Figure 3. H 2 O 2 induced increase in [Na ⫹ ] i and decrease in [ATP].](https://thumb-eu.123doks.com/thumbv2/9dokorg/1365492.111490/4.907.528.780.94.619/figure-h-o-induced-increase-na-decrease-atp.webp)
![Figure 6 and Table 3 indicate that oxidative stress and [Na ⫹ ] i](https://thumb-eu.123doks.com/thumbv2/9dokorg/1365492.111490/6.907.95.404.95.559/figure-table-indicate-oxidative-stress-na-i.webp)
![Figure 8. [Ca 2⫹ ] i rise induced by veratridine and H 2 O 2 in the presence or absence of ouabain](https://thumb-eu.123doks.com/thumbv2/9dokorg/1365492.111490/7.907.97.406.93.301/figure-ca-rise-induced-veratridine-presence-absence-ouabain.webp)
