The investigation of lymphocyte activation using flow cytometry
PhD thesis
Gergő Mészáros, MD
Semmelweis University
Doctoral School of Clinical Medicine
Supervisor:
Barna Vásárhelyi, MD, DSc
Opponents:
Zsófia Szabó, PhD Zsombor Lacza, MD, PhD
Chairman of the Examination Committee:
Csaba Szalai, MD, DSc
Members of the Examination Committee:
György Nagy, MD, PhD Éva Pállinger, MD, PhD
Budapest
2015.
2 1. INTRODUCTION
Calcium. Membrane potential. Mitochondrial function. Reactive oxygen species.
Principal characteristics of cell physiology which play central role in the regulation and change of cellular function.
By taking advantage of the equipment of our laboratory we aimed to establish new flow cytometry (FCM) assays that might be useful for characterization of the above mentioned cellular processes. The present methodology provides an opportunity for monitoring and characterizing the effects of immunmodulatory molecules ex vivo which might be used in preclinical drug development. We aimed to test this assays with neonatal cord blood samples.
Clinical experience and experimental data support that neonates are more susceptible for bacterial and viral infections than adults. However, the contribution of the activation of T-cells, responsible for adaptive immune response, to this susceptibility is unknown.
During the work presented in my thesis we collected blood samples form neonates and adult controls and after the isolation of T-cell populations, short term T-cell activation characteristics were analyzed.
Our experimental results indicate that our flow cytometry approach, in addition to previously used cytoplasmic calcium measurement, is suitable for the analysis of plasma membrane potential, mitochondrial calcium metabolism, mitochondrial potential and generation of reactive oxygen species. Our data showed significant differences in the changes of intracellular milieu upon T-cell activation between neonates and adults.
3 2. AIMS
In the first phase of our work we aimed to establish flow cytometry approaches which enable us the monitoring, the analysis and the objective comparison of changes of intracellular processes. For this purpose the development of flow cytometry assays was needed.
In the second phase of our work we aimed to test our methodology within the presence of two known molecules, an aspecific activator of lymphocytes (phytohemagglutinin) and a mitochondrial I. complex inhibitor (rotenone).
In the third phase of our work we aimed to apply the methodology in a clinical study.
We analyzed whether neonates’ T cell signaling is different from adults’.
4 3. METHODS
3.1. ESTABLISHMENT OF NEW EXPERIMENTAL SYSTEM: MONITORING INRACELLULAR PROCESSES IN T-CELLS
Following the development of a mathematic algorithm to characterize objectively the distribution of data and kinetic changes, we created new FCM assays which enable to monitor different intracellular processes in two different cell types. With these assays cytoplasmic calcium levels ([Ca2+]c), membrane potential, mitochondrial calcium metabolism ([Ca2+]m), mitochondrial membrane potentials (ΔΨm) and the generation of reactive oxygen species can be analyzed.
3.1.1. Simultaneous measurement of cytoplasmic Ca2+ signal and plasma membrane potential
Cytoplasmic free Ca2+ level was detected by loading the cells with Fluo-3-AM (emission maximum, 526 nm, recorded with a 530/30 nm band pass filter (BP filter)).
Cells were loaded with 2.6 M Fluo-3-AM and 0.02% Pluronic F-127 for 20 minutes at 37oC. Cells were washed once before measurements.
For the analysis of membrane potential, the fluorescent oxonol dye di-BA-C4-(5) was used (emission maximum, 616 nm, recorded with 610/20 nm BP filter). Cells were loaded with 300 nM di-BA-C4-(5) for 8 minutes at 37oC.
3.1.2. Measurement of mitochondrial Ca2+ levels
Mitochondrial Ca2+ levels were monitored using Rhod2/AM (emission maximum, 581 nm, recorded with a 575/26 nm BP filter). Cells were loaded with 2.5 M Rhod2/AM and 0.02% Pluronic F-127 for 20 minutes at 30oC and washed once before measurements.
3.1.3. Measurement of mitochondrial membrane potential
Mitochondrial membrane potential was estimated by staining with TMRM (emission maximum, 567 nm recorded with 575/26 nm BP filter) in quench/dequench mode. Cells
5
were loaded with 1 M TMRM for 20 min at 37oC in the dark and washed once before measurement.
3.1.4. Measurement of superoxide (O2-
) generation
Dihydroethidium (DHE), a redox-sensitive probe reacts with superoxide and results in the formation of a fluorescent dye (emission maximum, 605 nm, recorded with 610/20 nm BP filter). Cells were loaded with 1 M DHE for 18 minutes at 37oC.
3.2. METHODS FOR THE CLINICAL STUDY 3.2.1. Patients
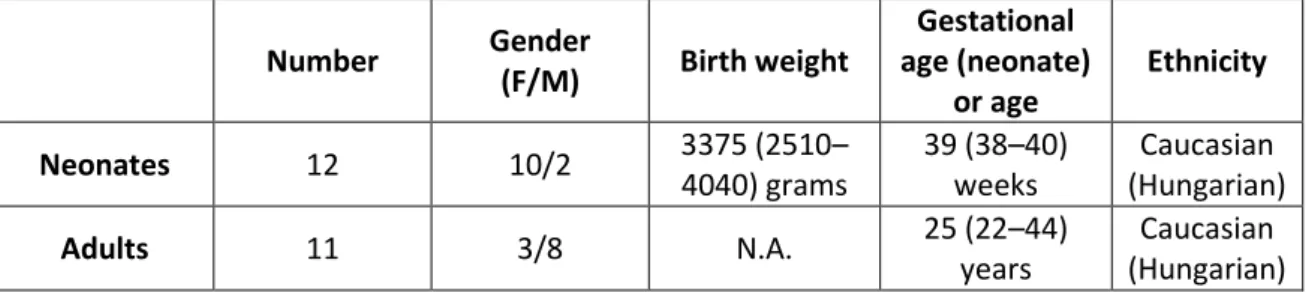
We used cord blood samples of twelve healthy term neonates [10 girls and 2 boys, gestational age: 39 (38–40) weeks, median (range), birth weight: 3375 (2510–4040) grams, median (range)] and peripheral blood samples of 11 healthy adults [3 women and 8 men, age: 25 (22–44) years, median (range)] (Table 1).
Table 1. Clinical data and patient characteristics. Data are expressed as median (range).
Number Gender
(F/M) Birth weight
Gestational age (neonate)
or age
Ethnicity
Neonates 12 10/2 3375 (2510–
4040) grams
39 (38–40) weeks
Caucasian (Hungarian)
Adults 11 3/8 N.A. 25 (22–44)
years
Caucasian (Hungarian)
3.2.2. Isolation of mononuclear cells
Peripheral blood mononuclear cells (PBMC) and cord blood mononuclear cells (CBMC) were separated by a standard density gradient centrifugation with Ficoll Paque (27 min, 400 g, 22oC) from freshly drawn blood collected in lithium heparin-treated tubes. This cell suspensions were washed twice in PBS. From then on, cells were kept throughout staining with fluorescent markers and measurement on flow cytometer in a modified RPMI medium. The Ca2+ concentration of the modified RPMI medium was set to 2 mM by addition of crystalline CaCl2.
6 3.2.3. Surface staining
For surface marker staining, PBMCs and CBMCs were incubated with anti-CD4 PE- Cy7 and anti-CD8 APC-Cy7 anti-human conjugated mAbs according to the manufacturers’ instructions.
3.2.4. Cell activation
At the beginning of each measurement 2 min baseline was recorded. T-cell activation was initiated by phytohemagglutinin (15 g/ml in final concentration). In each experiment fluorescence emission of sequentially measured cells was monitored for 12 minutes. In average, about 1 x 10⁶ cells were measured.
3.2.5Analysis of kinetic flow cytometry data
Data acquired from the measurements were evaluated with specific software developed at our laboratory (http://facskin.bitbucket.org/index.html). The core of this software is an improved version of an algorithm based on fitting of linear, logistic or double logistic functions to each recording. The linear and logistic function was used to characterize continuously increasing fluorescence values, while the double logistic function was used to describe measurements that have an increasing phase, a peak and a decreasing phase as time passes. The software also calculates parameter values describing each function, such as the maximum value (Max), the time to reach maximum value (tmax), slope at 50% of maximum (Slope), ending value (End) and the area under the curve (AUC). One unit (U) of the AUC value is defined as one relative intensity value in 1 s, where relative intensity values are the rate of actual intensity values divided by intensity values at 0 s.
3.2.5. Statistical analysis
For the analysis of the data Microsoft Excel, R software (R Development Core Team, R Foundation for Statistical Computing, Vienna, Austria) softwares were used. For the comparison of the groups Hettmannsperger-Norton trend test, Mann-Whitney and Kruskal-Wallis tests as well as Student’s T-test were used. p values less than 0.05 were
considered significant.
7 4. RESULTS
4.1. PHYTOHEMAGGLUTININ AND ROTENON INDUCED RESPONSES IN JURKAT-CELLS
4.1.1. Phytohemagglutinin induced activation in Jurkat cells
We stimulated Jurkat cells with increasing doses of PHA (an aspecific T lymphocyte activator) and monitored the fluorescence emission of sequentially measured cells for 12 minutes. In the first experiment Jurkat-cells were stimulated with increasing concentrations of PHA (0, 2,5, 5, 10, 15 g/ml) (n=5 for each concentration of PHA).
For [Ca2+]c and [Ca2+]m measurements double logistic functions resulted in the best fit.
Trend analysis revealed a significant relationship between AUC, Max and Slope parameters, respectively, and PHA dose. Even at the lowest PHA doses significant alterations in [Ca2+]c and [Ca2+]m kinetics were observed in both cases in AUC and Max compared with untreated cells.
Plasma membrane potential was described by logistic functions. Trend analysis detected a significant association between AUC and Ending value parameters and PHA dose.
Higher AUC and Ending values were measured in cells treated with ≥5 µg/ml PHA compared to untreated cells.
No effect of PHA on superoxide generation was observed 4.1.2. Mitochondrial effects of rotenone
Therefore, in order to determine the suitability of our method for the monitoring of superoxide generation we used rotenone (in 0, 0.002, 0.02, 0.2, 2, 20, and 200 M final concentration), a known inhibitor of complex I in mitochondria. . In this case, the logistic function was fitted to the data. Trend analysis detected a significant association between AUC and Ending values parameters and rotenone dose.
Beyond that, the effects of 15 minutes rotenone pretreatment on mitochondrial Ca2+
sequestration were investigated. Jurkat-cells were treated with 10 nM, 100 nM, 1 M, 10 M, 100 M concentrations of rotenon followed by an activation with 25 g/ml phytohemagglutinin (n=3 for each concentrations). Trend analysis revealed a significant relationship between rotenon concentrations and mitochondrial Ca2+ uptake. Rotenone decreased mitochondrial Ca2+ levels (for Max values p<0.05).
8
4.2. ACTIVATION OF NEONATAL AND ADULT T-CELLS
4.2.1. Lower mitochondrial mass in neonatal T-cells
To examine the mitochondrial mass in resting CD4+ and CD8+ T-cell populations isolated from newborn cord blood and adult peripheral-blood, we measured the whole cell fluorescent intensity of MitoTracker Green, a mitochondrial specific fluorescent dye. Mitochondrial mass was significantly decreased in the neonatal CD4+ T-cell populations compared to the adult CD4+ T-cells, while the difference in the CD8+ T- lymphocytes was not significant
4.2.2Baseline [Ca2+]c, [Ca2+]m and ΔΨm
4.2.2.1. Lower cytoplasmic [Ca2+]c in neonatal CD4+ T-cells
In order to compare the cytoplasmic Ca2+-levels of unstimulated adult peripheral and neonatal cord blood CD4+ and CD8+ T-cells, T-cells were loaded with Fluo-3-AM, a calcium sensitive fluorescent dye. Baseline cytoplasmic Ca2+-levels of neonatal CD4+ T –cells were lower compared to adult CD4+ lymphocytes whereas no difference was observed between the 2 groups in CD8+ T-cells. The addition of the calcium ionophore ionomycin indicating that the capacity for pharmacologically induced calcium flux in neonatal CD4+ T cell was reduced compared to adult CD4+ T-cells, while it was comparable in neonatal and adult CD8+ T-cells.
4.2.2.2. Comparable basal [Ca2+]m and ΔΨm in neonatal and adult CD4+ and CD8+ T- cells
While mitochondria have an important role in the role [Ca2+]c regulation and Ca2+ has an impact on mitochondrial functions, [Ca2+]m and ΔΨm were investigated.
Mitochondrial Ca2+-levels of unstimulated neonatal and adult CD4+ or CD8+ T-cells were comparable. Similarly, mitochondrial membrane potentials of resting CD4+ or CD8+ T-cells were equivalent in the two analyzed groups.
9
4.2.3. PHA induced activation in neonatal and adult T-cells
4.2.3.1. Decreased cytoplasmic Ca2+-levels in neonatal CD8+ cells
We stimulated T-cells with PHA and monitored the initial fluctuation of cytoplasmic Ca2+ levels. AUC, Max or End and Slope parameters values were calculated of the fitted functions and compared between the two groups. During short-term activation cytoplasmic Ca2+-response (in term of parameters AUC and Slope) was lower in neonatal than in adult CD8+ T-cells while no difference was observed in neonatal and adult CD4+ T-cells.
4.2.3.2. Elevated mitochondrial Ca2+-levels in neonatal CD4+ cells
The extent and kinetics of mitochondrial Ca2+-uptake induced by PHA addition (characterized by AUC, Slope and End) was increased in CD4+ T cells obtained from neonates compared to adults, while neonatal CD8+ cells contained less Ca2+ than adult CD8+ T-cells at the end of the measurement (End value).
4.2.3.3Increased mitochondrial depolarization in neonatal CD4+ and decreased in CD8+ T-cell
The baseline Ψm were comparable between the CD4+ and CD8+ T-cell subpopulations of neonatal and adult samples. However, in parallel to mitochondrial calcium uptake, mitochondrial membrane potential showed similar alterations following PHA stimulation: increased depolarization (AUC and Max) in neonatal CD4+ T-cells compared to adult and reduced depolarization in CD8+ neonatal T-lymphocytes compared to that one of adult (AUC, Slope and Max).
4.2.3.4. Increased O2- generation in neonatal CD4+ T-cells
To see whether these changes in mitochondrial calcium metabolism and function affect the mitochondrial superoxide generation, we measured the fluorescent intensity changes of DHE after PHA stimulation. Surprisingly superoxide generation was also higher (based on AUC parameter) in neonatal than in adult CD4+ T-cells whereas no differences were observed between neonatal and adult CD8+ T-cells.
10 5. CONCLUSIONS
1. A clear advantage of flow cytometry over single cell methods is that flow cytometry can efficiently handle a large number of different cell types simultaneously. The experiments performed for the validation of our methodology indicate that our flow cytometry approach, in addition to previously used [Ca2+]c measurement (Flou-3 AM), is suitable for the analysis of plasma membrane potential (di-BA-C4-(5)), mitochondrial Ca2+ metabolism (Rhod2/AM), mitochondrial potential (TMRM) and generation of reactive oxygen species (DHE).
2. Jurkat T-cells were used as model system to establish the methods and we characterized the kinetics of the above mentioned intracellular processes in these cells after PHA induced T-cell activation.
3. For the further investigation of O2-
generation, the well-known mitochondrial I.
complex inhibitor rotenone was used. This molecule induced dose dependent increase in mitochondrial O2- production.
4. By using our FCM assays we were investigating the possible differences in the previously mentioned cell physiological processes in neonatal and adult CD4+
and CD8+ T-cell subpopulations. The rationale behind this aim is previous observation demonstrating immaturity of the adaptive immune response in neonates and so the higher exposure to infections. Beside the lower cytoplasmic Ca2+-signal lower mitochondrial mass was observed in neonatal CD4+ T-cells.
5. PHA induced mitochondrial Ca2+-sequestration and mitochondrial depolarization were increased in CD4+ neonatal T-cells while decreased in CD8+ neonatal T- cells compared to adults. All these alterations in mitochondrial function might contribute to the elevated O2- production and ROS signaling in neonatal CD4+
T-cells. Our data suggest that the complex regulation of T-cell activation shows important differences between adults and neonates. These findings indicate that intracellular machinery in its complexity presents different features between
11
neonatal and adult T-cells that may contribute to the immaturity of adaptive immunity of the neonate.
1. figure: Schematic representation of neonatal CD4+ T-cell activation. Schematic representation of CD4+ T-cell activation showing the parameters altered in neonate compared to adult. In addition to reduced cytoplasmic Ca2+ signaling the mitochondrial mass is decreased in neonatal CD4+ T-cells. Decreased mitochondrial mass is responsible for the elevated mitochondrial Ca2+ sequestration and mitochondrial depolarization which contribute to the elevated O2- production. All these changes might contribute to reduced NFAT-associated gene expression in neonatal CD4+ T-cells.
12 6. PUBLICATIONS
6.1. PUBLICATIONS RELATED TO THE THESIS
1. Mészáros G, Szalay B, Toldi G, Kaposi A, Vásárhelyi B, Treszl A. (2012) Kinetic measurements using flow cytometry: new methods for monitoring intracellular processes. Assay Drug Dev Technol, 10:97-104.
2. Mészáros G, Rónai K, Toldi G, Kaposi A, Vásárhelyi B, Treszl A. (2008) Sejtélettani folyamatok jellemzése „real-time" áramlási citometriás módszerrel.
Magyar Immunológia, 7:22-29.
3. Kaposi A, Toldi G, Mészáros G, Szalay B, Veress G, Vásárhelyi B. (2012) Experimental Conditions and Mathematical Analysis of Kinetic Measurements Using Flow Cytometry – The FacsKin Method. In Schmid I (szerk.): Flow Cytometry - Recent Perspectives. InTech. ISBN 979-953-307-355-1, 2012: 299- 324.
4. Szalay B, Mészáros G, Cseh Á, Ács L, Deák M, Kovács L, Vásárhelyi B, Balog A. (2012) Adaptive immunity in ankylosing spondylitis: phenotype and functional alterations of T-cells before and during infliximab therapy. Clin Dev Immunol, 2012:808724.
5. Szalay B, Cseh Á, Mészáros G, Kovács L, Balog A, Vásárhelyi B. (2014) The Impact of DMARD and Anti-TNF Therapy on Functional Characterization of Short-Term T-Cell Activation in Patients with Rheumatoid Arthritis - A Follow- Up Study. PloS One 9:e104298.
6. Toldi G, Vásárhelyi B, Kaposi A, Mészáros G, Pánczél P, Hosszúfalusi N, Tulassay T, Treszl A. (2010) Lymphocyte activation in type 1 diabetes mellitus:
the increased significance of Kv1.3 potassium channels. Immunol Lett, 133:35- 41.
7. Toldi G, Folyovich A, Simon Z, Zsiga K, Kaposi A, Mészáros G, Tulassay T, Vásárhelyi B. (2011) Lymphocyte calcium influx kinetics in multiple sclerosis treated without or with interferon β. J Neuroimmunol, 237:80-86.
13
6.2. PUBLICATIONS NOT RELATED TO THE THESIS
1. Dunai G, Vásárhelyi B, Szabó M, Hajdú J, Mészáros G, Tulassay T, Treszl A.
(2008) Published genetic variants in retinopathy of prematurity: Random forest analysis suggests a negligible contribution to risk and severity. Curr Eye Res, 33:501-505.
2. Mácsai E, Cseh Á, Budai G, Mészáros G, Vásárhelyi B, Fischer K, Szabó A, Treszl A. (2009) Effect of 3 Months of Doxazosin Therapy on T-cell Subsets in Type 2 Diabetic Patients. J Int Med Res, 37:1982-1987.
3. Mészáros G, Szalay B, Toldi G, Mezei G, Tamási L, Vásárhelyi B, Cserháti E, Treszl A. (2009) FoxP3(+) Regulatory T cells in Childhood Allergic Rhinitis and Asthma. J Investig Allergol Clin Immunol, 19:238-240.
4. Toldi G, Svec P, Vásárhelyi B, Mészáros G, Rigó J, Tulassay T, Treszl A.
(2008) Decreased number of FoxP3+ regulatory T cells in preeclampsia. Acta Obstet Gynecol Scand, 87:1229-1233.
5. Treszl A, Mészáros G, Toldi G, Vásárhelyi B. Histone deacetylases and autoimmunity. In The Epigenetics of Autoimmune Diseases (Zouali, M., ed), John Wiley & Sons, Chichester, UK, 2009: 385-402.