INTRODUCTION
Unlike normal healthy fibroblasts, aged or senescent fibroblasts are pro-tumorigenic [1]. Cellular damage, which is widely considered to be the general cause of aging, occasionally may provide cells with abnormal advantages that can eventually give rise to cancer. Thus, cancer and aging are two different faces of the same underlying process: the accumulation of cellular damage in cells and tissues over the years, which eventually become senescent. Indeed, accumulation of
Research Paper
senescent cells has been detected after examination of aged tissues, and it contributes to tissue degeneration during aging [1]. Whether senescence of the stroma is sufficient to initiate tumorigenesis still remains unclear.
However, senescent cells can have profound effects on the surrounding microenvironment, through the expression and secretion of a range of pro-inflammatory factors, which is known as the senescence-associated secretory phenotype (SASP). The onset of SASP may help explain the increased tumor incidence observed in aged individuals [2].
www.impactaging.com AGING, October 20 15 , Vol 7 No 1 0
Proteomic identification of prognostic tumour biomarkers, using chemotherapy‐induced cancer‐associated fibroblasts
Maria Peiris‐Pagès
1,2, Duncan L. Smith
3, Balázs Győrffy
4,5, Federica Sotgia
1,2, and Michael P.
Lisanti
1,2
1 The Breast Cancer Now Research Unit, Institute of Cancer Sciences, University of Manchester, UK;
2 The Manchester Centre for Cellular Metabolism (MCCM), Institute of Cancer Sciences, University of Manchester, UK;
3
The Cancer Research UK Manchester Institute, University of Manchester, UK;
4 MTA TTK Lendület Cancer Biomarker Research Group, Budapest, Hungary;
5 Semmelweis University 2nd Dept. of Pediatrics, Budapest, Hungary.
Key words: chemotherapy, metabolism, catabolism, cancer‐associated fibroblasts, second primary tumours, tumour microenvironment, quantitative proteomics, markers, cancer survival
Abbreviations: AZA, azathioprine; TAX, taxol; CAF, cancer‐associated fibroblast; MCT4, monocarboxylate transporter 4; IL6, interleukin 6; ROS, reactive oxygen species; αSMA, α‐smooth muscle actin
Received: 08/13/15; Accepted: 09/12/15; Published: 10/23/15
Correspondence to: Michael Lisanti, PhD; E‐mail: Michael.Lisanti@ics.manchester.ac.uk
Copyright: Peiris‐Pagès et al. This is an open‐access article distributed under the terms of the Creative Commons Attribution License, which permits unrestricted use, distribution, and reproduction in any medium, provided the original author and source are credited
Abstract:
Cancer cells grow in highly complex stromal microenvironments, which through metabolic remodelling, catabolism, autophagy and inflammation nurture them and are able to facilitate metastasis and resistance to therapy.However, these changes in the metabolic profile of stromal cancer‐associated fibroblasts and their impact on cancer initiation, progression and metastasis are not well‐known. This is the first study to provide a comprehensive proteomic portrait of the azathioprine and taxol‐induced catabolic state on human stromal fibroblasts, which comprises changes in the expression of metabolic enzymes, myofibroblastic differentiation markers, antioxidants, proteins involved in autophagy, senescence, vesicle trafficking and protein degradation, and inducers of inflammation. Interestingly, many of these features are major contributors to the aging process. A catabolic stroma signature, generated with proteins found differentially up‐regulated in taxol‐treated fibroblasts, strikingly correlates with recurrence, metastasis and poor patient survival in several solid malignancies. We therefore suggest the inhibition of the catabolic state in healthy cells as a novel approach to improve current chemotherapy efficacies and possibly avoid future carcinogenic processes.
The tumour stroma comprises the majority of the neoplastic mass and is mainly composed of fibroblasts [3]. Nevertheless, our comprehension of the tumour microenvironment is rather limited in comparison with that of cancer cells. The emergence of a reactive microenvironment via metabolic stress and inflammation fuels cancer cells, enables tumour growth and invasion, and leads to treatment failure [3-10].
However, the mechanisms by which the metabolic remodelling of cancer-associated stromal fibroblasts (CAFs) regulates the evolution of malignancy or even may control the susceptibility of incompletely transformed cells to become fully malignant are not fully understood.
We have previously established that exposure to anti- cancer agents independently drives metabolic stress and catabolism, autophagy, senescence, myofibroblastic differentiation and production of the pro-inflammatory cytokine Interleukin 6 (IL6) in human stromal fibroblasts in vitro (Figure 1) [11]. Thus, according to our model, chemotherapy promotes the same effects in stromal fibroblasts as their interaction with cancer cells, the so-called catabolic tumour stroma phenotype, which creates an energy-rich, pro-inflammatory niche ideal for cancer development and possibly initiation.
Despite the significant number of markers and secreted proteins already related to CAFs, there is little evidence of the contribution of chemotherapy-induced CAF transformation to metastasis or the growth of a second primary tumour after therapy. Indeed, only one report links secretion of factors associated with inflammation and cancer progression in therapy-damaged senescent fibroblasts with de novo tumorigenesis [12]. Thus, novel biomarkers are required to improve the prediction of recurrence, metastasis and, in particular, the prediction of therapy-related carcinogenesis. So far, there is one study investigating transcriptomic changes in stromal fibroblasts upon chemotherapeutic treatment, but none investigating phenotypic changes by proteomics [11]. Azathioprine and taxol (paclitaxel) are drugs widely used in chemotherapy for a variety of cancers and in particular taxol is used as the first-line chemotherapeutic agent for ovarian cancer [13-15]. In this study, we describe a strategy based on a label-free quantitative proteomic profiling of fibroblasts obtained after treatment with azathioprine or taxol, which allows us to measure numerous markers of the CAF phenotype.
Likewise, the data presented here attempt to identify novel biomarkers of the catabolic remodelling in human stromal fibroblasts that are associated with chemoresistance, metastasis and second primary tumours by reporting their impact on cancer survival.
The expression of several over-expressed proteins found
in taxol-treated fibroblasts that are involved in metabolism, antioxidant response, autophagy, vesicle trafficking, protein degradation and myofibroblastic transformation correlate with poor prognosis in chemotherapy-treated breast, lung, gastric and ovarian cancer patients. We conclude that a strategy that targets constituents of the tumour microenvironment in combination with conventional chemotherapy may help improving treatment efficacy and avoiding the growth of future malignancies.
RESULTS
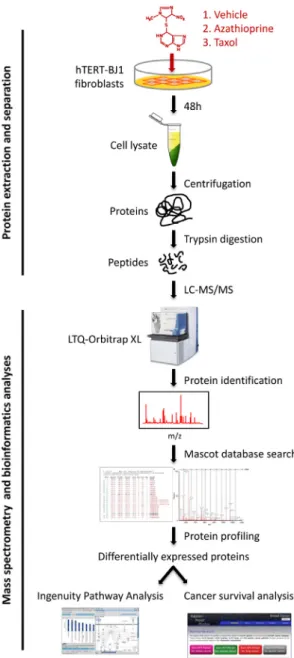
To identify differentially regulated proteins upon chemotherapeutic treatment, hTERT-BJ1 fibroblasts were exposed for 48 h to either vehicle or sub-lethal concentrations of azathioprine (100 µM) or taxol (100 nM) (Figure S1), and cell lysates were subject to label- free quantitative proteomics. Following protein digestion with trypsin, peptide fractions were processed on an LTQ-Orbitrap XL mass spectrometer. The experimental workflow used for the present study is depicted in Figure 2. Those peptides identified were further analyzed to find proteomic changes between chemotherapy-treated and vehicle-treated fibroblasts.
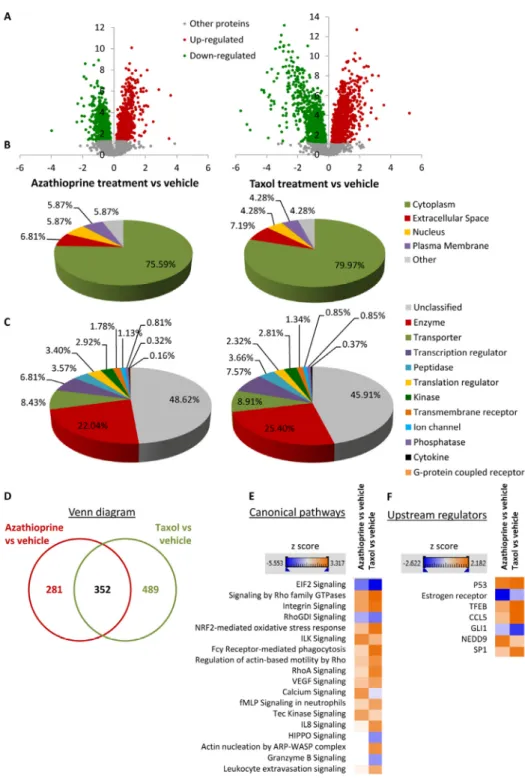
To define differential regulation, those identified proteins that showed a fold change difference of 1.15 or higher, and p values of <0.05 (ANOVA) compared to vehicle were considered. In the azathioprine-treated fibroblasts, 1640 proteins were identified as differentially expressed, from which 779 were up- regulated and 861, down-regulated. In the taxol treatments, 2967 proteins were found as differentially expressed compared to vehicle, from which 1624 were up-regulated and 1343, down-regulated (Figure 3A).
To obtain additional functional insights into pathways that are differentially regulated in stromal fibroblasts upon treatment, bioinformatics analyses of our proteomics datasets were conducted. All differentially expressed proteins were analysed using Ingenuity Pathway Analysis (IPA) to seek altered canonical pathways and toxicity functions. IPA was able to analyse 633 proteins out of 1640 in the azathioprine- treated fibroblasts, and 841 out of 2967 proteins in the taxol-treated fibroblasts. We further examined the subcellular distribution and the nature of these differentially regulated proteins in azathioprine and taxol-treated fibroblasts. Over 80% of all proteins analyzed were intracellular, in particular cytoplasmic proteins (Figure 3B). Likewise, the largest portion of classified proteins, accounting for one fourth of all analysed proteins, were enzymes, over 8% of all proteins were transporter proteins, and over 7% were transcription regulators (Figure 3C). Finally, a comparison
ww.impactaging.com
817 AGING,
October 2015, Vol.7No.10analysis revealed that 352 proteins were differentially regulated in both treatment conditions compared to vehicle (Figure 3D).
Cellular pathways affected by chemotherapy in stromal fibroblasts
1. Metabolism
One of the major contributors to the aging process is mitochondrial dysfunction, which involves a decrease in the oxidative phosphorylation efficacy and an increase in the electron leakage resulting in reduced ATP generation [17]. Similarly, one of the hallmarks of the catabolic tumour stroma is the induction of metabolic stress that favours glycolysis to the detriment of mitochondrial metabolism. We have showed in a previous study that several chemotherapeutic agents, including azathioprine and taxol were able to stimulate stromal fibroblasts to consume more glucose and produce more lactate, which was released via enhanced MCT4 expression, hence increasing extracellular acidification (Figure 1). The cellular ATP content was also minor upon treatment suggesting a decrease in mitochondrial respiration [11].
Figure 2. Workflow for the comparative proteome analysis of hTERT‐BJ1 fibroblasts treated with azathioprine, taxol or vehicle. Protein lysates were obtained from hTERT‐BJ1 fibroblasts after 48 h treatment with azathioprine, taxol or vehicle. Peptides obtained after trypsin digestion were analysed via LC‐MS/MS on an LTQ‐Orbitrap XL mass spectrometer. Label‐free quantitative proteomics was used to detect changes in protein abundances across vehicle‐treated and drug‐treated fibroblast extracts. The proteomics data sets were further analysed using Ingenuity Pathway Analysis and a cancer survival analysis tool (kmplot.com).
Figure 1. Chemotherapy induces the catabolic tumour stroma phenotype. ROS production and DNA damage induced by chemotherapy generate oxidative stress to stromal cells, which in turn brings about several changes in them such as differentiation into CAFs, activation of HIF1α, NFkB, TGFβ, STAT3 or JNK/AP1 signalling pathways, switch to aerobic glycolysis and loss of functional mitochondria, acquisition of an autophagic and senescent phenotype, and release of pro‐inflammatory cytokines. Thus, these stromal fibroblasts acquire the catabolic tumour stroma phenotype.
Figure 3. Overview of proteins and pathways identified as differentially regulated in the lysates of azathioprine‐
treated and taxol‐treated fibroblasts relative to vehicle by Ingenuity Pathway Analysis. (A) Volcano plot representation of protein abundance changes in hTERT‐BJ1 fibroblasts upon treatment with azathioprine and taxol compared to vehicle treatment.
A total of 1640 differentially regulated proteins with fold changes ≥ 1.15 and p values < 0.05 were identified in azathioprine‐treated fibroblasts, and 2967 differentially regulated proteins in taxol‐treated fibroblasts. X axis represents log2(fold change). Y axis represents ‐log(p value). Non‐significantly regulated proteins are shown in grey, in green, significantly down‐regulated proteins and in red, significantly up‐regulated proteins. (B) Subcellular localization of differentially regulated proteins identified in azathioprine and taxol treatments compared to vehicle treatment. (C) Classification of differentially regulated proteins identified in azathioprine and taxol treatments by type. Cellular enzymes account for 22.04% and 25.40% of total differentially regulated proteins identified in azathioprine treatment and taxol treatment, respectively. (D) Overlap of differentially regulated proteins identified in azathioprine and taxol treatments compared to vehicle treatment. Of all proteins identified by quantitative proteomics, 352 were proteins the expression of which was found altered in both treatments compared to vehicle. (E) Canonical pathways and (F) upstream regulators identified or predicted as altered in both treatment conditions compared to vehicle. A positive z score is indicated in orange and points towards an activation of the pathway, and a negative z score, in blue, indicates an inhibition of the pathway.
www.impactaging.com
819 AGING,
October 2015, Vol. 7 No.10To validate that chemotherapy-induced glycolytic phenotype and to identify other cellular metabolic pathways potentially altered by chemotherapy, we searched the proteomic data for changes in the expres-
sion of metabolic enzymes. Of all differentially regulated proteins, 22.04% and 25.40% were actually enzymes in azathioprine-treated and taxol-treated fibroblasts, respectively (Figure 3C).
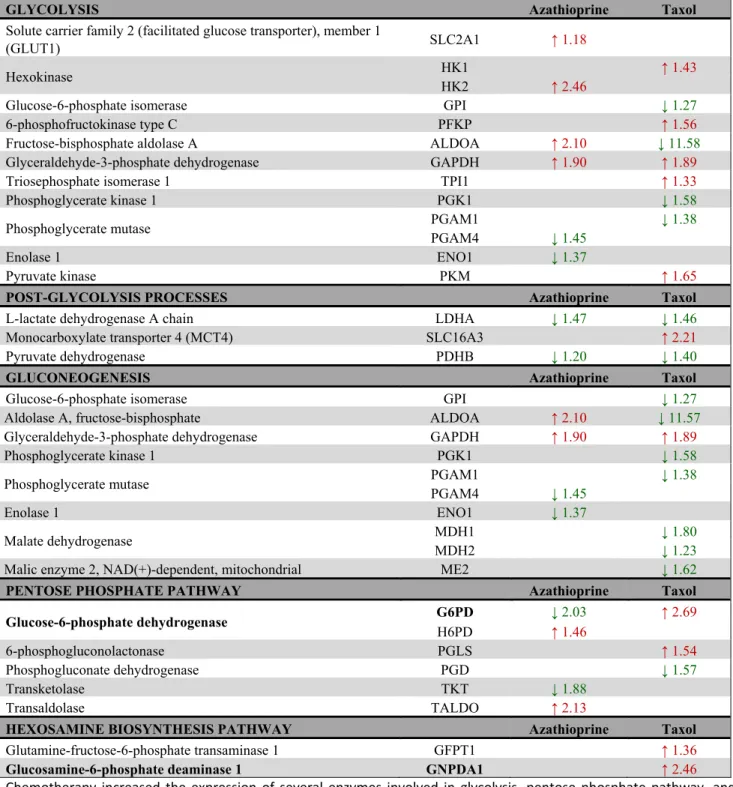
Table 1. Changes in the expression of enzymes involved in glucose metabolism after treatment with azathioprine and taxol for 48 h as measured by quantitative proteomics.
GLYCOLYSIS Azathioprine Taxol
Solute carrier family 2 (facilitated glucose transporter), member 1
(GLUT1) SLC2A1 ↑ 1.18
Hexokinase HK1 ↑ 1.43
HK2 ↑ 2.46
Glucose-6-phosphate isomerase GPI ↓ 1.27
6-phosphofructokinase type C PFKP ↑ 1.56
Fructose-bisphosphate aldolase A ALDOA ↑ 2.10 ↓ 11.58
Glyceraldehyde-3-phosphate dehydrogenase GAPDH ↑ 1.90 ↑ 1.89
Triosephosphate isomerase 1 TPI1 ↑ 1.33
Phosphoglycerate kinase 1 PGK1 ↓ 1.58
Phosphoglycerate mutase PGAM1 ↓ 1.38
PGAM4 ↓ 1.45
Enolase 1 ENO1 ↓ 1.37
Pyruvate kinase PKM ↑ 1.65
POST-GLYCOLYSIS PROCESSES Azathioprine Taxol
L-lactate dehydrogenase A chain LDHA ↓ 1.47 ↓ 1.46
Monocarboxylate transporter 4 (MCT4) SLC16A3 ↑ 2.21
Pyruvate dehydrogenase PDHB ↓ 1.20 ↓ 1.40
GLUCONEOGENESIS Azathioprine Taxol
Glucose-6-phosphate isomerase GPI ↓ 1.27
Aldolase A, fructose-bisphosphate ALDOA ↑ 2.10 ↓ 11.57
Glyceraldehyde-3-phosphate dehydrogenase GAPDH ↑ 1.90 ↑ 1.89
Phosphoglycerate kinase 1 PGK1 ↓ 1.58
Phosphoglycerate mutase PGAM1 ↓ 1.38
PGAM4 ↓ 1.45
Enolase 1 ENO1 ↓ 1.37
Malate dehydrogenase MDH1 ↓ 1.80
MDH2 ↓ 1.23
Malic enzyme 2, NAD(+)-dependent, mitochondrial ME2 ↓ 1.62
PENTOSE PHOSPHATE PATHWAY Azathioprine Taxol
Glucose-6-phosphate dehydrogenase G6PD ↓ 2.03 ↑ 2.69
H6PD ↑ 1.46
6-phosphogluconolactonase PGLS ↑ 1.54
Phosphogluconate dehydrogenase PGD ↓ 1.57
Transketolase TKT ↓ 1.88
Transaldolase TALDO ↑ 2.13
HEXOSAMINE BIOSYNTHESIS PATHWAY Azathioprine Taxol
Glutamine-fructose-6-phosphate transaminase 1 GFPT1 ↑ 1.36
Glucosamine-6-phosphate deaminase 1 GNPDA1 ↑ 2.46
Chemotherapy increased the expression of several enzymes involved in glycolysis, pentose phosphate pathway, and hexosamine biosynthesis. Enzymes that show amplified expression after treatment are shown in red, and enzymes that are decreased are shown in green. Number indicates the fold increase or fold decrease in protein expression in chemotherapy‐treated versus vehicle‐treated hTERT‐BJ1 fibroblasts.
The expression of most glycolytic enzymes was significantly altered (Table 1). Interestingly, most of the glycolytic enzymes that were found to be up-regulated are enzymes that perform an irreversible reaction in the glycolytic pathway and all down-regulated enzymes are reversible enzymes, able to perform the opposite re-
action, hence also involved in gluconeogenesis.
Curiously, LDHA, the enzyme involved in transforming pyruvate into lactate was found to be down-regulated in both treatments suggesting that pyruvate was further processed into the TCA cycle instead of being transformed into lactate.
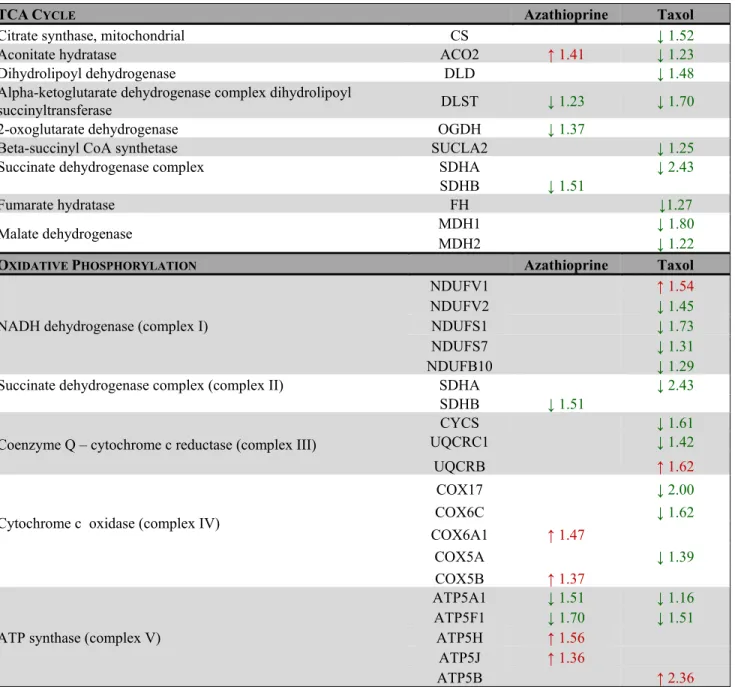
Table 2. Changes in the expression of enzymes involved in mitochondrial glucose metabolism after treatment with azathioprine and taxol for 48 h as measured by quantitative proteomics.
TCACYCLE Azathioprine Taxol
Citrate synthase, mitochondrial CS ↓ 1.52
Aconitate hydratase ACO2 ↑ 1.41 ↓ 1.23
Dihydrolipoyl dehydrogenase DLD ↓ 1.48
Alpha-ketoglutarate dehydrogenase complex dihydrolipoyl
succinyltransferase DLST ↓ 1.23 ↓ 1.70
2-oxoglutarate dehydrogenase OGDH ↓ 1.37
Beta-succinyl CoA synthetase SUCLA2 ↓ 1.25
Succinate dehydrogenase complex SDHA ↓ 2.43
SDHB ↓ 1.51
Fumarate hydratase FH ↓1.27
Malate dehydrogenase MDH1 ↓ 1.80
MDH2 ↓ 1.22
OXIDATIVE PHOSPHORYLATION Azathioprine Taxol
NADH dehydrogenase (complex I)
NDUFV1 ↑ 1.54
NDUFV2 ↓ 1.45
NDUFS1 ↓ 1.73
NDUFS7 ↓ 1.31
NDUFB10 ↓ 1.29
Succinate dehydrogenase complex (complex II) SDHA ↓ 2.43
SDHB ↓ 1.51
Coenzyme Q – cytochrome c reductase (complex III)
CYCS ↓ 1.61
UQCRC1 ↓ 1.42
UQCRB ↑ 1.62
Cytochrome c oxidase (complex IV)
COX17 ↓ 2.00
COX6C ↓ 1.62
COX6A1 ↑ 1.47
COX5A ↓ 1.39
COX5B ↑ 1.37
ATP synthase (complex V)
ATP5A1 ↓ 1.51 ↓ 1.16
ATP5F1 ↓ 1.70 ↓ 1.51
ATP5H ↑ 1.56
ATP5J ↑ 1.36
ATP5B ↑ 2.36
Taxol treatment remarkably decreased the expression of enzymes of the TCA cycle and oxidative phosphorylation.
Enzymes that show increased expression after treatment are shown in red, and enzymes that are decreased are shown in green. Number indicates the fold increase or fold decrease in protein expression in chemotherapy‐treated versus vehicle‐treated hTERT‐BJ1 fibroblasts.
www.impactaging.com
821 AGING,
October 2015, Vol. 7 No.10Figure 4. Taxol treatment alters several cellular metabolic pathways and induces autophagy and senescence in hTERT‐
BJ1 fibroblasts. (A) Summary of changes observed in the expression of numerous metabolic enzymes after treatment with taxol for 48 h, as measured by quantitative proteomics. Taxol treatment increased the expression of enzymes involved in glycolysis, pentose phosphate, and hexosamine biosynthesis and lipid synthesis pathways in detriment of those involved in gluconeogenesis and mitochondrial metabolism (TCA cycle, oxidative phosphorylation, and mitochondrial β–oxidation). Enzymes that show amplified expression after taxol treatment are shown in red, and enzymes that are decreased are shown in green. Cellular metabolic pathways that may be up‐regulated are boxed in red, and those that may be down‐regulated are boxed in green. (B) Summary of changes observed in the expression of numerous autophagy and senescence‐related proteins after treatment with taxol for 48 h, as measured by quantitative proteomics. Taxol amplified the expression of proteins involved in senescence, autophagy, mitophagy and vesicle formation and trafficking. Proteins that show increased expression after treatment are shown in red. (C) Ingenuity Pathway Analysis of azathioprine and taxol‐treated hTERT‐BJ1 fibroblasts predicted p53, TFEB and CCL5 to be activated in these cells.
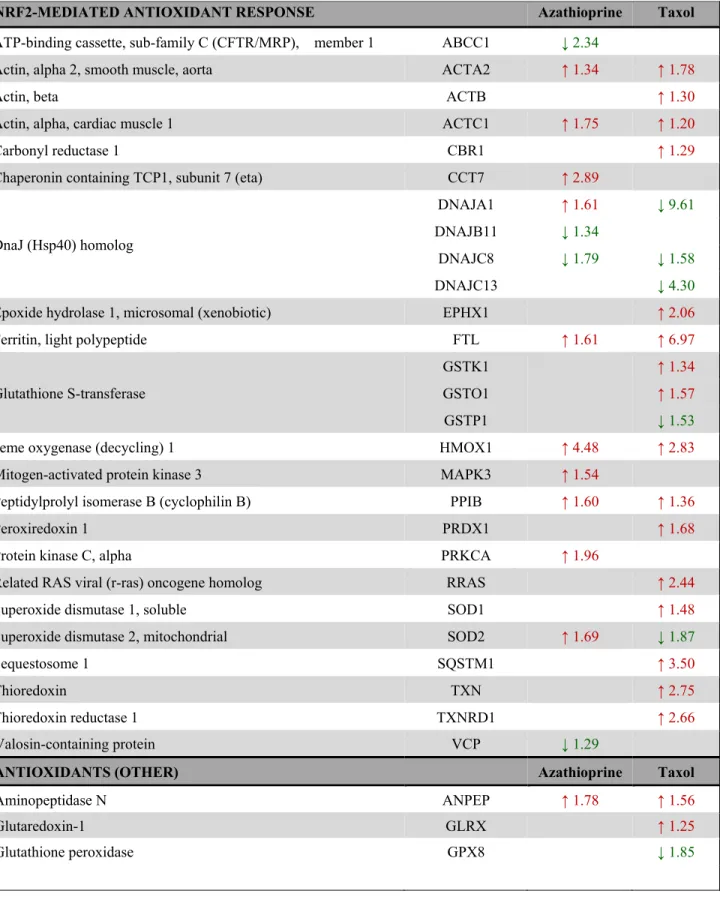
Table 3. Changes in the expression of Nrf2-target proteins and other proteins involved in the antioxidant response after treatment with azathioprine and taxol for 48 h as measured by quantitative proteomics and indicated by IPA analysis.
NRF2-MEDIATED ANTIOXIDANT RESPONSE Azathioprine Taxol
ATP-binding cassette, sub-family C (CFTR/MRP), member 1 ABCC1 ↓ 2.34
Actin, alpha 2, smooth muscle, aorta ACTA2 ↑ 1.34 ↑ 1.78
Actin, beta ACTB ↑ 1.30
Actin, alpha, cardiac muscle 1 ACTC1 ↑ 1.75 ↑ 1.20
Carbonyl reductase 1 CBR1 ↑ 1.29
Chaperonin containing TCP1, subunit 7 (eta) CCT7 ↑ 2.89
DnaJ (Hsp40) homolog
DNAJA1 ↑ 1.61 ↓ 9.61
DNAJB11 ↓ 1.34
DNAJC8 ↓ 1.79 ↓ 1.58
DNAJC13 ↓ 4.30
Epoxide hydrolase 1, microsomal (xenobiotic) EPHX1 ↑ 2.06
Ferritin, light polypeptide FTL ↑ 1.61 ↑ 6.97
Glutathione S-transferase
GSTK1 ↑ 1.34
GSTO1 ↑ 1.57
GSTP1 ↓ 1.53
Heme oxygenase (decycling) 1 HMOX1 ↑ 4.48 ↑ 2.83
Mitogen-activated protein kinase 3 MAPK3 ↑ 1.54
Peptidylprolyl isomerase B (cyclophilin B) PPIB ↑ 1.60 ↑ 1.36
Peroxiredoxin 1 PRDX1 ↑ 1.68
Protein kinase C, alpha PRKCA ↑ 1.96
Related RAS viral (r-ras) oncogene homolog RRAS ↑ 2.44
Superoxide dismutase 1, soluble SOD1 ↑ 1.48
Superoxide dismutase 2, mitochondrial SOD2 ↑ 1.69 ↓ 1.87
Sequestosome 1 SQSTM1 ↑ 3.50
Thioredoxin TXN ↑ 2.75
Thioredoxin reductase 1 TXNRD1 ↑ 2.66
Valosin-containing protein VCP ↓ 1.29
ANTIOXIDANTS (OTHER) Azathioprine Taxol
Aminopeptidase N ANPEP ↑ 1.78 ↑ 1.56
Glutaredoxin-1 GLRX ↑ 1.25
Glutathione peroxidase GPX8 ↓ 1.85
www.impactaging.com
823 AGING,
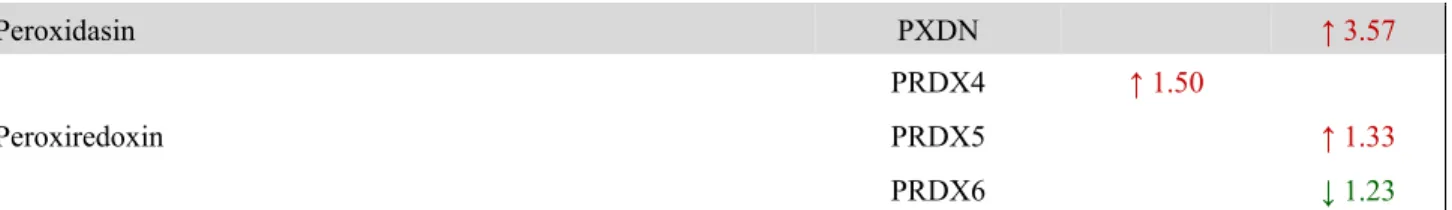
October 2015, Vol. 7 No.10Figure 5. Pathway analysis of differentially expressed proteins in hTERT‐BJ1 fibroblasts treated with azathioprine or taxol compared to vehicle‐treated cells. Ingenuity Pathway Analysis showed canonical pathways significantly altered by the proteins differentially expressed in hTERT‐BJ1 fibroblasts treated with azathioprine or taxol (P <
0.05). The p value for each pathway is indicated by the bar and is expressed as ‐1 times the log of the p value. Green coloured bars show a predicted inhibition of the pathway (z score <‐1.9) and red coloured bars indicate a predicted activation of the pathway (z score >1.9).
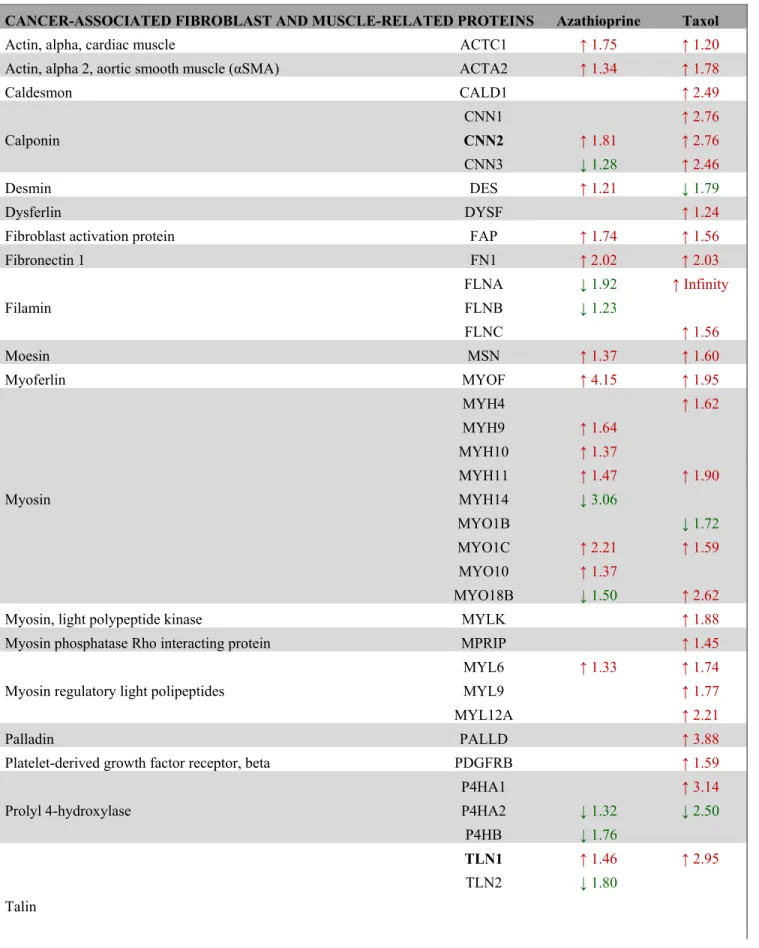
Peroxidasin PXDN ↑ 3.57
Peroxiredoxin
PRDX4 ↑ 1.50
PRDX5 ↑ 1.33
PRDX6 ↓ 1.23
Chemotherapy mostly increased the expression of proteins involved in antioxidant response, mainly in taxol‐treated fibroblasts. Proteins that show amplified expression after treatment are shown in red, and proteins that are decreased are shown in green. Number indicates the fold increase or fold decrease in protein expression in chemotherapy‐treated versus vehicle‐treated hTERT‐BJ1 fibroblasts.
Nevertheless, LDH is an enzyme that exhibits feedback inhibition, by which high lactate concentrations can suppress it. In fact, MCT4, the monocarboxylate transporter responsible for the secretion of lactate, turned out to be up-regulated in taxol-treated hTERT-BJ1 cells, and regarding the further processing of pyruvate into acetyl-CoA and the citric acid (TCA) cycle, the expression of practically all enzymes were found to be down-regulated in taxol-treated fibroblasts compared to vehicle indicating a dramatic down-regulation of mitochondrial metabolism. A similar down-regulation trend was observed in numerous proteins involved in all oxidative phosphorylation complexes (Table 2) and mitochondrial function proteins (Table S1). Finally, several enzymes involved in mitochondrial fatty acid β- oxidation were also identified as down-regulated, and a few enzymes involved in fatty acid biosynthesis, up- regulated (Table S2). Other metabolic changes included enzymes of the oxidative pentose phosphate pathway, responsible for the generation of antioxidant power (NADPH), the hexosamine synthesis pathway, account-
able for the production of amino sugars used for the synthesis of glycoproteins, glycolipids and proteoglycans, and a few enzymes involved in the generation of ketone bodies (Table 1 and 5). Figure 4A summarises all changes observed in the expression of metabolic enzymes in taxol-treated fibroblasts and their contribution to different cellular metabolic pathways.
IPA revealed glycolysis, gluconeogenesis and pentose phosphate pathway as altered canonical pathways in both azathioprine and taxol treatments. Similarly, IPA revealed mitochondrial dysfunction, TCA cycle, and PPARα/RXRα activation, responsible for ketone body production and fatty acid metabolism, as two of the top canonical pathways affected by both treatments, and oxidative phosphorylation and fatty acid β-oxidation, as altered pathways also in taxol-treated cells (Figure 5 and Table S5). The toxicity impact of both drugs extensively involved mitochondrial dysfunction and damage, and also fatty acid metabolism and PPARα/RXRα activation (Figure 6 and Table S6).
Figure 6. Toxicity effects of differentially expressed proteins in hTERT‐BJ1 fibroblasts treated with azathioprine or taxol compared to vehicle‐treated cells. Ingenuity Pathway Analysis showed toxicity functions significantly enriched by the proteins differentially expressed in hTERT‐BJ1 fibroblasts treated with azathioprine or taxol (P < 0.05). The p value for each pathway is indicated by the bar and is expressed as ‐1 times the log of the p value.
www.impactaging.com
825 AGING,
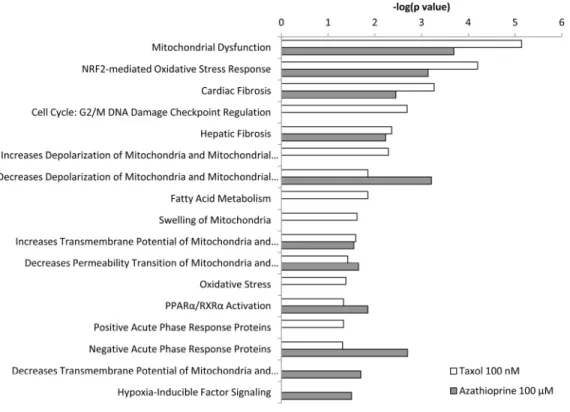
October 2015, Vol. 7 No.10Table 4. Changes in the expression of proteins involved in myofibroblastic transformation and muscle-related proteins after treatment with azathioprine and taxol for 48 h as measured by quantitative proteomics.
CANCER-ASSOCIATED FIBROBLAST AND MUSCLE-RELATED PROTEINS Azathioprine Taxol
Actin, alpha, cardiac muscle ACTC1 ↑ 1.75 ↑ 1.20
Actin, alpha 2, aortic smooth muscle (αSMA) ACTA2 ↑ 1.34 ↑ 1.78
Caldesmon CALD1 ↑ 2.49
Calponin
CNN1 ↑ 2.76
CNN2 ↑ 1.81 ↑ 2.76
CNN3 ↓ 1.28 ↑ 2.46
Desmin DES ↑ 1.21 ↓ 1.79
Dysferlin DYSF ↑ 1.24
Fibroblast activation protein FAP ↑ 1.74 ↑ 1.56
Fibronectin 1 FN1 ↑ 2.02 ↑ 2.03
Filamin
FLNA ↓ 1.92 ↑ Infinity
FLNB ↓ 1.23
FLNC ↑ 1.56
Moesin MSN ↑ 1.37 ↑ 1.60
Myoferlin MYOF ↑ 4.15 ↑ 1.95
Myosin
MYH4 ↑ 1.62
MYH9 ↑ 1.64
MYH10 ↑ 1.37
MYH11 ↑ 1.47 ↑ 1.90
MYH14 ↓ 3.06
MYO1B ↓ 1.72
MYO1C ↑ 2.21 ↑ 1.59
MYO10 ↑ 1.37
MYO18B ↓ 1.50 ↑ 2.62
Myosin, light polypeptide kinase MYLK ↑ 1.88
Myosin phosphatase Rho interacting protein MPRIP ↑ 1.45
Myosin regulatory light polipeptides
MYL6 ↑ 1.33 ↑ 1.74
MYL9 ↑ 1.77
MYL12A ↑ 2.21
Palladin PALLD ↑ 3.88
Platelet-derived growth factor receptor, beta PDGFRB ↑ 1.59
Prolyl 4-hydroxylase
P4HA1 ↑ 3.14
P4HA2 ↓ 1.32 ↓ 2.50
P4HB ↓ 1.76
Talin
TLN1 ↑ 1.46 ↑ 2.95
TLN2 ↓ 1.80
To recapitulate, the previously identified chemotherapy- induced metabolic stress in stromal fibroblasts is clearly detected by quantitative proteomics and it represents not only an increase in glycolysis and a reduction in mitochondrial function, as observed in our previous study, but also affects other metabolic pathways, including hexosamine synthesis and pentose phosphate pathways, fatty acid metabolism and ketogenesis.
2. Antioxidant response and stress-related pathways Another feature of the catabolic tumour stroma is the induction of oxidative stress, which can be induced by chemotherapy in cancer cells and also healthy tissues (Figure 1) [18, 19]. Particularly, we previously showed increased ROS production and antioxidant response in hTERT-BJ1 fibroblasts after treatment with taxol [11].
We have seen in this study that several enzymes of the oxidative branch of the pentose phosphate pathway, which is responsible for the generation of antioxidant power (NADPH), were up-regulated in chemotherapy- treated stromal fibroblasts. Thus, we sought for other antioxidant response proteins in the proteomics datasets.
The expression of numerous proteins involved in Nrf2- mediated antioxidant response and other antioxidant proteins was significantly altered, in most cases up- regulated (Table 3), suggesting an activation of the pathway in both azathioprine and taxol-treated hTERT- BJ1 fibroblasts, although it was found to be notably higher in taxol-treated cells.
A higher presence of antioxidant response proteins was further confirmed using IPA, which revealed Nrf2- mediated antioxidant response to be one of the top canonical pathways affected by azathioprine and taxol treatments, although z score values demonstrated a significant activation of this pathway exclusively in
taxol-treated fibroblasts. Similarly, taxol-treated cells showed altered glutathione and thioredoxin antioxidant pathways (Figure 3E and 5, and Table S5). The toxicity of these chemotherapeutic drugs also involved oxidative stress. HIF signalling, which is activated in response to stress and a central player in the regulation of cellular metabolism, was also identified as a toxic effect of azathioprine treatment (Figure 6 and Table S6), and had been previously identified as activated in hTERT-BJ1 fibroblasts treated with azathioprine and taxol [11].
Thus, proteomics analysis clearly detects an activation of the antioxidant response after treatment with chemotherapy.
3. Myofibroblastic differentiation
Cancer-associated fibroblasts are commonly identified by their expression of alpha smooth muscle actin (αSMA) [20] (Figure 1). Indeed, we previously showed up-regulation of αSMA by immunoblotting in taxol- treated hTERT-BJ1 [11]. Quantitative proteomics profiling of azathioprine and taxol-treated hTERT-BJ1 fibroblasts also revealed a significantly higher presence of αSMA and many other myofibroblastic markers, such as fibroblast activation protein (FAP) or vimentin, as well as muscle-related proteins compared to the vehicle-treated control (Table 4).
Myofibroblasts are mostly responsible for the presence of fibrosis [21], and the toxicity functions of these chemotherapeutic drugs involved tissue fibrosis, as analysed by IPA (Figure 6 and Table S6). Therefore, chemotherapy can independently induce the differentiation of hTERT-BJ1 fibroblasts into cancer- associated fibroblasts, which can be detected by a numerous increase of myofibroblastic markers in quantitative proteomics analysis.
Transgelin 2 TAGLN2 ↑ 1.93
Tropomyosin
TPM1 ↓ 2.63 ↓ 4.23
TPM2 ↑ 1.24
TPM3 ↑ 1.43
TPM4 ↑ 2.12
Vimentin VIM ↑ 1.72 ↑ 1.76
Chemotherapy enormously increased the expression of proteins involved in CAF transformation. Proteins that show amplified expression after treatment are shown in red, and proteins that are decreased are shown in green. Number indicates the fold increase or fold decrease in protein expression in chemotherapy‐treated versus vehicle‐treated hTERT‐BJ1 fibroblasts.
www.impactaging.com
827 AGING,
October 2015, Vol. 7 No.104. Autophagy and senescence
Autophagy and senescence represent a common response to stresses such as exposure to DNA-damaging exogenous cytotoxic agents, including chemotherapy or radiation [22, 23]. Indeed our previous study indicated that azathioprine and taxol induce autophagic vesicle formation and increase β-galactosidase activity in stromal fibroblasts [11]. Thus, to further examine changes in autophagy and senescence upon chemotherapeutic exposure, the differential expression
of several autophagy, mitophagy and lysosomal markers was analysed using the proteomics datasets. Numerous autophagy and senescence markers such as sequestrosome 1, also known as p62, cathepsin B or the lysosomal enzyme β-galactosidase were found to be up- regulated in either azathioprine or taxol treatments (Table 5). In addition, DNM1L, a protein involved in mitochondrial fission, was up-regulated in taxol-treated hTERT-BJ1 fibroblasts, and OPA1, a protein involved in mitochondrial fusion, was down-regulated in azathioprine-treated cells. Likewise, VAT1, a vesicle Table 5. Changes in the expression of autophagy, mitophagy and senescence markers and ketogenesis enzymes after treatment with azathioprine and taxol for 48 h as measured by quantitative proteomics.
AUTOPHAGY MARKERS Azathioprine Taxol
Cathepsin CATB ↑ 1.56 ↑ 1.55
CATD ↑ 1.62
Lysosomal-associated membrane protein 1 LAMP1 ↑ 1.55
Microtubule-associated protein 1 light chain 3 beta MAP1LC3B ↑ 1.58
Sequestrosome 1 (p62) SQSTM1 ↑ 3.50
MITOPHAGY MARKERS Azathioprine Taxol
Dynamin-1-like protein (fission) DNM1L ↑ 1.71
Dynamin-like 120 kDa protein, mitochondrial (fusion) OPA1 ↓ 1.44
LYSOSOMAL PROTEINS (OTHER) Azathioprine Taxol
Cation-dependent mannose-6-phosphate receptor M6PR ↑ 2.38
Cation-independent mannose-6-phosphate receptor IGF2R ↑ 3.58 ↑ 1.88
Galactosidase, beta 1 GLB1 ↑ 1.53
Late endosomal/lysosomal adaptor, MAPK and mTOR activator
1 LAMTOR1 ↑ 1.85
Lysosome membrane protein 2 SCARB2 ↑ 1.63 ↑ 1.49
N-acetylglucosamine-6-sulfatase GNS ↑ 1.43
Prenylcysteine oxidase 1 PCYOX1 ↑ 1.55
Prosaposin PSAP ↑ 2.21 ↑ 2.13
KETOGENESIS Azathioprine Taxol
Hydroxyacyl-CoA dehydrogenase
HADH ↓ 1.43
HADHA ↓ 1.57
HADHB ↑ 1.36
3-Hydroxymethyl-3-methylglutaryl-CoA lyase HMGCL ↑ 1.67
Chemotherapy incremented the expression of proteins involved in autophagy and senescence. Proteins that show increased expression after treatment are shown in red, and proteins that are decreased are shown in green. Number indicates the fold increase or fold decrease in protein expression in chemotherapy-treated versus vehicle-treated hTERT- BJ1 fibroblasts.
membrane protein that inhibits mitochondrial fusion, was up-regulated in both treatments, suggesting that mitophagy might be also activated in response to chemotherapy (Table 5 and Table S3).
During autophagy, protein and lipid degradation occur, the latter leading to the generation of ketone bodies. A long list of up-regulated proteins involved in vesicle formation and trafficking, in protein ubiquitination pathway and proteasomal degradation, and a few enzymes involved in ketogenesis were also identified (Table 5, S3 and S4). The boost in vesicle formation and trafficking proteins could explain the greater presence of enzymes involved in fatty acid synthesis and hexosamine biosynthesis (Figure 4A and Table 1 and S2). The observed effects of taxol treatment on autophagy, mitophagy and senescence are summarised in Figure 4B.
IPA analysis confirmed an alteration of ketogenesis in fibroblasts exposed to azathioprine (Figure 5 and Table S5). IPA also showed a robust inhibitory effect of azathioprine and taxol on EIF2 signalling, responsible for protein synthesis, as measured by z score, and also revealed an alteration in the regulation of eIF4 and p70S6K signaling and in the protein ubiquitination pathway. Finally, PPARα/RXRα activation, Rho, caveolar and clathrin-mediated signalling pathways, all involved in vesicle trafficking and motility, and the mTOR signalling, known for its role in autophagy, mito- chondrial metabolism and lipid metabolism, as well as cytoskeleton dynamics, were some of the top canonical pathways altered by chemotherapy, (Figure 3E, 5, and Table S5). Interestingly, p53, known mediator of senes-
cence, was predicted to be activated in both azathioprine- treated and taxol-treated hTERT-BJ1 cells according to IPA, and TFEB, a transcriptor factor that coordinates the expression of lysosomal hydrolases, membrane proteins and genes involved in autophagy, was also predicted to be activated by taxol treatment (Figure 3F and 4C). Our previous study also reported an increased expression of p53 in hTERT-BJ1 fibroblasts treated with azatioprine and taxol by immunoblotting [11].
Thus, quantitative proteomics analysis reveals a higher presence of markers of autophagy and senescence and proteins involved in protein degradation and vesicle trafficking in hTERT-BJ1 fibroblasts, upon treatment.
5. Inflammation
Senescent cells dramatically alter their secretome, enriching it with pro-inflammatory cytokines and matrix metalloproteinases. This senescence-associated secretory phenotype (SASP) can lead to chronic inflammation, which is a hallmark of aging [17].
Stromal fibroblasts secrete inflammatory cytokines when in contact with cancer cells [24]. Chemotherapy is also able to induce cytokine production in healthy tissues [12], and in particular taxol treatment induces IL6 secretion in stromal fibroblasts (Figure 1) [11].
STAT3, a known inducer of inflammation in response to stress [25, 26] was found significantly up-regulated in both azathioprine (1.69 fold increase) and taxol treatments (2.35 fold increase) relative to vehicle.
STAT3 signalling was found to be activated in response to taxol also in our previous study [11].
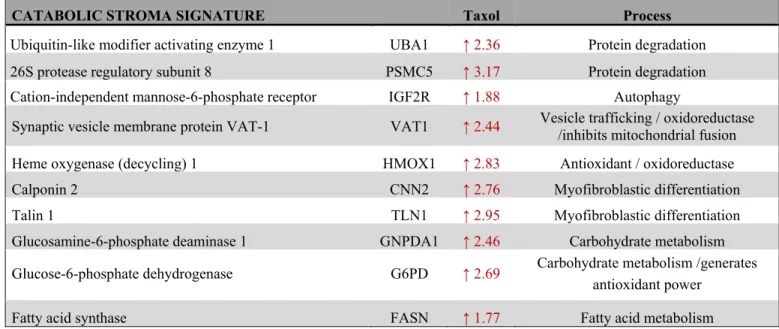
Table 6. Proteins of the catabolic stroma signature and their contribution to CAF transformation, metabolism, antioxidant response, autophagy and vesicle trafficking.
CATABOLIC STROMA SIGNATURE Taxol Process
Ubiquitin-like modifier activating enzyme 1 UBA1 ↑ 2.36 Protein degradation 26S protease regulatory subunit 8 PSMC5 ↑ 3.17 Protein degradation Cation-independent mannose-6-phosphate receptor IGF2R ↑ 1.88 Autophagy
Synaptic vesicle membrane protein VAT-1 VAT1 ↑ 2.44 Vesicle trafficking / oxidoreductase /inhibits mitochondrial fusion Heme oxygenase (decycling) 1 HMOX1 ↑ 2.83 Antioxidant / oxidoreductase
Calponin 2 CNN2 ↑ 2.76 Myofibroblastic differentiation
Talin 1 TLN1 ↑ 2.95 Myofibroblastic differentiation
Glucosamine-6-phosphate deaminase 1 GNPDA1 ↑ 2.46 Carbohydrate metabolism Glucose-6-phosphate dehydrogenase G6PD ↑ 2.69 Carbohydrate metabolism /generates
antioxidant power
Fatty acid synthase FASN ↑ 1.77 Fatty acid metabolism
www.impactaging.com
829 AGING,
October 2015, Vol. 7 No.10Figure 7. Clinical correlations of UBA1 expression and the UBA1, PSMC5, IGF2R, VAT1, HMOX1, CNN2, TLN1, GNPDA1, G6PD and FASN signature in chemotherapy‐treated breast cancer patients. (A) Correlations of UBA1 expression with relapse‐
free survival, distant metastasis‐free survival and overall survival in breast cancer. (B) Correlations of the catabolic stroma signature with relapse‐free survival, distant metastasis‐free survival and overall survival in breast cancer. All graphs are calculated using microarray data from 425, 122 and 69 chemotherapy‐treated breast cancers, respectively, determined using an online survival analysis tool. Kaplan‐Meier correlations are plotted for high (above median, in red) and low (below median, in black) gene expression.
Figure 8. Clinical correlations of UBA1 expression and the UBA1, PSMC5, IGF2R, VAT1, HMOX1, CNN2, TLN1, GNPDA1, G6PD and FASN signature in chemotherapy‐treated lung, gastric and ovarian cancer patients. (A) Correlations of UBA1 expression with overall survival in lung and gastric cancer, and with progression‐free survival in ovarian cancer. (B) Correlations of the catabolic stroma signature with overall survival in lung and gastric cancer, and with progression‐free survival in ovarian cancer. All graphs are calculated using microarray data from 176 chemotherapy‐treated lung cancers, 153 5‐FU‐based adjuvant therapy‐treated gastric cancers, and 229 paclitaxel‐treated ovarian cancers, determined using an online survival analysis tool. Kaplan‐Meier correlations are plotted for high (above median, in red) and low (below median, in black) gene expression.
www.impactaging.com
831 AGING,
October 2015, Vol. 7 No.10Interestingly, several pathways involved in the inflammatory process such as IL8, acute phase response, leukocyte extravasation or Fcγ receptor- mediated phagocytosis signalling were amongst altered canonical pathways in both azathioprine-treated and taxol-treated hTERT-BJ1 cells relative to vehicle, according to IPA. N-formyl-Met-Leu-Phe (fMLP) signalling was also found to be altered in taxol-treated fibroblasts (Figure 3E and 5 and Table S5). Most of these pathways were clearly activated in taxol-treated fibroblasts as indicated by z score values, suggesting an induction of the inflammatory response in chemotherapy-treated stromal fibroblasts. Likewise, the chemokine (C-C motif) ligand 5 (CCL5 or RANTES), which plays a role in recruiting leukocytes into inflammatory sites, was identified as an upstream regulator in both treatments, particularly activated in taxol-treated fibroblasts (Figure 3F and 4C). Finally, acute phase response, which occurs soon after the onset of an inflammatory process, was identified as one of the toxic effects of both drugs (Figure 6 and Table S6).
Therefore, pathway analysis of the proteomics results indicates an induction of the inflammatory response in stromal fibroblasts after exposure to chemotherapy.
Differentially up-regulated proteins in taxol-treated fibroblasts correlate with recurrence, metastasis and poor cancer survival
To further investigate the clinical implications of our proteomics datasets, we decided to test the impact of over-expressed proteins in taxol-treated hTERT-BJ1 fibroblasts in cancer prognosis. To do so, we used an on-line survival analysis tool that uses microarray gene expression data from multiple studies on breast, ovarian, lung and gastric cancer [16], which was suitable to our purpose since taxol is a chemotherapeutical drug currently used as therapy for most of these malignancies. Only those proteins with a fold change difference of 1.75 or higher and p values of
<0.05 (ANOVA) compared to vehicle were used for survival analyses. The expression of several proteins was found to correlate with survival in breast, ovarian, gastric and lung cancer patients. In particular, high expression of ubiquitin-like modifier activating enzyme 1 (UBA1), implicated in protein catabolism and degradation, showed a striking correlation with poor relapse-free survival, distant metastasis-free survival and overall survival in breast cancer patients previously treated with chemotherapy (425, 122 and 69 patients, respectively) (Figure 7A). The same correlation was not observed when patients who did not receive systemic treatment were considered (1000, 533 and 375 patients, respectively) (Figure S2A). Similarly, high expression of UBA1 correlated with poor overall survival in lung
and gastric cancer patients previously treated with chemotherapeutic drugs (176 and 153 patients, respectively), and with progression-free survival in ovarian cancer patients particularly treated with paclitaxel (229 patients) (Figure 8A). Once more, the correlation was lost when patients who did not receive systemic treatment were considered in lung cancer (227 patients) or when patients who underwent only surgery were examined in gastric cancer (174 patients) (Figure S3A). No data from untreated ovarian cancer patients was available.
A taxol-induced catabolic stroma signature was created comprising UBA1, and other proteins representative of the catabolic CAF-like phenotype, including PSMC5, and VAT1, involved in catabolism and vesicle trafficking, several metabolic enzymes including FASN, G6PD and GNPDA, an autophagy marker, IGF2R, the oxidoreductase HMOX1, and myofibroblastic markers including CNN2 and TLN1. See Table 6 for details and abundances of these proteins in taxol-treated fibroblasts.
That catabolic stroma signature showed a strong correlation with survival in treated patients (Figure 7B and 8B), whereas that correlation was not seen in non- treated patients (Figure S2B and S3B). Hence, the over- expression of proteins upon treatment with taxol is strongly linked to poor survival, treatment failure and metastasis in breast, lung, gastric and ovarian cancers.
Interestingly, most markers used for the signature are also proteins found to be significantly up-regulated in azathioprine-treated hTERT-BJ1 fibroblasts relative to vehicle, including IGF2R, PSMC5, VAT1, HMOX1, CNN2, TLN1 and FASN (Tables 3, 4 5, S2, S3 and S4).
Thus, we conclude that chemotherapy-mediated changes in the abundance of stromal proteins related to the CAF-like catabolic phenotype measured by quantitative proteomics associate with reduced survival, enhanced recurrence and metastasis incidence in several solid malignancies.
DISCUSSION
In this study we have analysed the impact of chemotherapy in the acquisition of the CAF-like, catabolic tumour stroma phenotype, which emerges in stromal fibroblasts in contact with cancer cells, and is characterised by increased glucose uptake, lactate production and extracellular acidification, increased expression of αSMA, augmented production of ROS, an activation of the JNK/AP1, HIF1, TGFβ/SMAD, STAT3 and NFkB stress-induced pathways, senescence and autophagy, and a greater secretion of inflammatory cytokines. To do so, we aimed at comprehensively characterising the cellular and metabolic changes that take place in stromal fibroblasts exposed to two
common chemotherapeutic drugs: azathioprine and taxol. Label-free quantitative proteomics and extensive bioinformatics analyses revealed a protein profile characteristic for chemotherapy-treated fibroblasts that included alterations in energy metabolism, antioxidant response, autophagy and senescence, vesicle formation and trafficking, protein degradation, myofibroblastic differentiation and inflammation.
Proteomic map of the stromal catabolic state induced by chemotherapy
The main protein set whose expression was altered in chemotherapy-treated fibroblasts was that of enzymes.
Azthioprine and taxol effects on the glycolytic function of stromal fibroblasts were characterised in a previous study, which showed the induction of a glycolytic switch in hTERT-BJ1 fibroblasts via increasing their lactate production and extracellular acidification, and decreasing their ATP content [11]. We know now that this behaviour is likely to be a result of the observed up-regulation of enzymes involved in glycolysis and down-regulation of mitochondrial respiration enzymes. Indeed, our proteo- mic analysis shows alterations not only in glycolysis but also in pyruvate conversion to acetyl-coenzyme A and the TCA cycle. The reduction in ATP production through decreased TCA cycle activity and mitochondrial respiration may be forcing a metabolic switch that allows the cell to obtain energy from alternative metabolic processes such as glycolysis or protein catabolism. This metabolic remodelling also includes an alteration of other pathways of the carbohydrate metabolism, such as the phosphate pentose and hexosamine biosynthesis pathways, and several pathways of the fatty acid metabolism. In line with our findings, a recent study demonstrates that as an adaptive response to mito- chondrial respiratory chain dysfunction and ATP deficiency, human fibroblasts up-regulate the expression of glycolytic enzymes, suggesting the induction of anaerobic glycolysis and a cellular catabolic state, in particular protein catabolism, together with autophagy [27].
According to our data, the hexosamine biosynthesis pathway is also altered in chemotherapy-treated fibroblasts, which goes in line with the increased presence of proteins involved in vesicle formation and trafficking. GNPDA1 is an enzyme of the hexosamine biosynthesis pathway, the end-products of which are used for the synthesis of membrane components such as glycolipids and proteoglycans. However, GNPDA1 catabolizes a reversible conversion between D-fructose- 6-phosphate and D-glucosamine-6-phosphate, and therefore could also be used in reverse to produce
substrates for glycolysis, by sacrificing structural components of the cell.
The phosphate pentose pathway is a metabolic pathway also altered by chemotherapy. During the oxidative phase of the pentose phosphate pathway, most of the reducing power of the cell is generated as NADPH.
Taxol-treated fibroblasts show increased levels of the initial rate-limiting enzyme of the pentose phosphate pathway, glucose-6-phosphate dehydrogenase (G6PDH), which converts glucose-6-phosphate and NADP+ into 6-phosphoglucono-δ-lactone and NADPH.
NADPH is also necessary for lipid and nucleic acid biosynthesis, and its re-oxidation to NADP+ constitutes an essential step to prevent damage by oxidative stress.
Increased amounts of NADPH go in line with the up- regulation of several proteins involved in antioxidant response, such as Nrf2-mediated antioxidant response proteins, as well as the greater ROS levels that we have previously seen in hTERT-BJ1 fibroblasts after taxol treatment [11]. The accumulation of ROS as a consequence of mitochondrial dysregulation during aging is also associated with DNA damage [28].
Therefore, oxidative stress and aging can be coupled in a positive feedback mechanism that accelerates cellular damage and generates a permissive metabolic microenvironment for cancer development and progression [5, 28-30].
Oxidative stress in healthy cells and tissues by most current anti-cancer therapies is thought to occur via p53 activation, which causes mitochondrial dysfunction, ROS production and downstream STAT3 signalling, promoting inflammation-related cancer [19, 26]. Our proteomics results revealed a predicted activation state of p53, mitochondrial dysfunction, increased expression of antioxidant proteins, autophagy and senescence markers, and specifically STAT3 up-regulation in chemotherapy- treated fibroblasts compared to vehicle. Our observations in vesicle trafficking and protein transport and degradation also suggest a general intensification in the transport of proteins and other cellular components to autophagosomes and lysosomes. Indeed, taxol is able to induce the formation of autophagic vesicles in stromal fibroblasts [11]. By increasing that transport, the stressed cell could be attempting to remove dysfunctional organelles such as mitochondria and other molecules that accumulate as a result of oxidative damage, or alternatively it could also be trying to retrieve molecules for re-utilisation in detriment of de novo protein synthesis, which is more energy consuming.
Myofibroblasts are abundant components of the reactive tumour microenvironment and are mostly accountable for the development of fibrosis [21], one of the side-
www.impactaging.com
833 AGING,
October 2015, Vol.7 No.10effects of cancer therapy [31]. Fibroblast-to- myofibroblast differentiation increases in the stroma with age as well, resulting in an increased incidence of fibrosis-associated diseases, such as cancer [32]. Here, we report that exposure to chemotherapy can independently induce the transformation of fibroblasts into CAFs, by detecting an increase in the presence of numerous markers of myofibroblastic differentiation as measured by quantitative proteomics.
Finally, we identify several inflammation-related pathways as altered in taxol-treated fibroblasts, suggesting an induction of the inflammatory response.
We previously described IL6 as one of the cytokines secreted by chemotherapy-treated fibroblasts and STAT3 target genes as being activated after treatment with taxol [11]. However, to comprehensively characterize the pro-inflammatory cytokines released by hTERT-BJ1 cells, secretome analysis should be performed for better insights.
In the present study, proteomic analyses revealed the impact of chemotherapy in the acquisition of a catabolic CAF-like phenotype in stromal fibroblasts, gradually conforming an energy-rich, pro-inflammatory micro- environment able to succour cancer cells in their battle for survival, in their purpose to metastasise, or even through which chemotherapy-damaged epithelial cells may become more susceptible to develop a fully malignant phenotype, giving rise to a new cancer. Taxol induces the catabolic stroma phenotype to a bigger extent than azathioprine. The different nature of these two drugs and the concentrations selected for the study could account for their different impact on catabolic remodelling.
Clinical implications of the catabolic stroma signature
Quantitative proteomics allowed us to obtain a protein profile characteristic for fibroblasts exposed to azathioprine and taxol, which suggests a general alteration in their energy metabolism and a shift towards glycolysis and catabolic processes: a whole metabolic reprogramming to adapt to chemotherapy-driven mitochondrial dysfunction and oxidative stress. Likewise, the quantitative proteomics analysis allowed us to identify biomarkers of this stromal catabolic state, which were further analysed for their potential clinical implications. We generated a signature to figure out whether the chemotherapy-induced catabolic state in the stroma would have prognostic value. Indeed, the catabolic phenotype in stromal fibroblasts strikingly correlated with poor survival, treatment failure and metastatic growth in a set of breast, ovarian, lung and gastric cancer patients who were subject to chemo-
therapy, correlation that was lost when untreated patients were considered.
Our knowledge of the role of healthy stromal cells in metastasis and in particular in the emergence of therapy-related malignancies is still very scarce. A piece of evidence for chemotherapy-induced tumour- promoting paracrine activities of non-malignant cells has only been recently published, showing that pre- treatment of tumour-free mice with a single dose of doxorubicin is sufficient to stimulate the engraftment of lung carcinoma cells and to elevate the mitogenic activity of the serum from treated animals [12]. By label-free quantitative proteomics we detect the acquisition of a catabolic state in stromal cells due to chemotherapy-induced DNA damage, which potentially leads to the generation of an autophagic, nutrient-rich, senescent, pro-inflammatory microenvironment, the ideal niche to encourage the development of a secondary tumour or even a new carcinogenic process.
However, the tumour-promoting function and the stability and reversability of the chemotherapy-induced CAF phenotype needs to be further investigated, as well as the differential expression of chemotherapy-induced catabolic stress markers on stromal fibroblasts and cancer cells in vivo.
To conclude, proteomic analyses revealed a significant metabolic reprogramming in response to chemotherapy.
Our data provide information about novel protein targets that might enable and support different stages of the tumorigenic process, thereby opening new doors for future research. Given the essential contribution of the catabolic tumour stroma in cancer progression, it emerges as a new interesting therapeutic target. A promising approach would be the preventive inhibition of the catabolic state transformation. Indeed, TGFβ- induced myofibroblastic transformation in fibroblasts can be reversed by using antioxidants [33]. Most importantly, an antibody against fibroblast activation protein (FAP) is already being tested in clinical trials [34]. Therefore, inhibition of the catabolic stress in the tumour stroma and healthy tissues in parallel to conventional chemotherapy could help avoiding recurrence, metastasis and the growth of second primary tumours.
MATERIALS AND METHODS
Cell culture. All cell culture experiments were carried out using human foreskin fibroblasts immortalised with the human telomerase reverse transcriptase (hTERT- BJ1 cells). hTERT-BJ1 fibroblasts were originally purchased from ATCC (CRL-4001) and maintained in DMEM media (D6546, Sigma) supplemented with 10
% fetal bovine serum (FBS) (F7524, Sigma), 100 units/ml of penicillin, 100 µg/ml streptomycin (P0781, Sigma) and 1% Glutamax (#35050087, Life Technologies) at 37°C in a humidified atmosphere containing 5% CO2.
Chemotherapeutical agents. Azathioprine (A4638, Sigma) and taxol or paclitaxel (Y0000698, Sigma) were used for this study at 100 µM and 100 nM, respectively.
Sulforhodamone B (SRB) assay. SRB (S9012, Sigma) measures total biomass by staining cellular proteins.
After 48 h treatment, cells were fixed in 10%
trichloroacetic acid (T9159, Sigma) for 1h at 4°C, stained with SRB (S9012, Sigma) for 15 minutes, and washed 3 times with 1% acetic acid (27225, Sigma).
The incorporated die was solubilized with 10 mM Tris Base, pH 8.8 (T1503, Sigma). Absorbance was spectrophotometrically measured at 562 nm in a FluoStar Omega plate reader (BMG Labtech).
Background measurements were subtracted from all values.
Label-free quantitative proteomics
Chemicals and sample preparation. Formic acid, trifluoroacetic acid, ammonium formate (10 M), ammonium bicarbonate TCEP (Tris (2- carboxyethyl)phosphine hydrochloride), MMTS (Methyl methanethiosulfonate) and trypsin were all obtained from Sigma. HPLC gradient grade acetonitrile was obtained from Fisher Scientific. Briefly, 2 x 10⁶ hTERT-BJ1 fibroblasts were seeded in 150 cm plates until cells were attached. Cells were then treated with azathioprine or taxol at the concentrations indicated. As control, vehicle-treated cells were processed in parallel.
After 48 hours of treatment, cells were lysed in RIPA buffer (R0278, Sigma) and kept at 4°C for 20 minutes with rotation. Lysates were cleared by centrifugation for 10 minutes at 10,000 x g and supernatants were collected and kept frozen at -80°C.
Protein digestion. Lysate samples were thawed to room temperature and their concentrations equalised to 1 µg/µL (50 µL volume) with RIPA buffer, and further processed for trypsin digestion by sequential reduction of disulphide bonds with TCEP and alkylation with MMTS. Briefly, 1 µL benzonase (Novagen) was added to the 50 µL aliquot and placed on ice for 15 minutes.
The sample was then taken to dryness using a SpeedVac, and resuspended in 22.5 µL trypsin reaction buffer (40 mM ammonium bicarbonate and 9%
acetonitrile). One µL of 50 mM TCEP solution was added to each sample, mixed briefly and placed on a heater block at 60°C for 60 minutes. After cooling to
room temperature, 0.5 µL of 200 mM MMTS solution was added to each sample and allowed to react for 15 minutes. Trypsin was added in two waves to ensure efficient digestion of the sample. Firstly, 20 µg of sequencing grade trypsin was resuspended in 1800 µL of trypsin reaction buffer; 225 µL of this solution were added to each sample for digestion, and the reactions were left at 37°C overnight with shaking (600 rpm). The following morning, a further aliquot of trypsin was added. Two ml of trypsin reaction buffer was added to 20 µL of sequencing grade trypsin; 250 µL of this solution were added to each of the digest samples from overnight, and the reactions were left at 37°C for 4 hours with shaking (600 rpm). Thirty-five µL 10%
formic acid were added to the 500 µL digest sample (0.7% final concentration of formic acid) to stop the digestion. The digested solution was diluted in 7.5 mL of acetonitrile containing 0.3% formic acid.
HILIC solid phase extraction (SPE) of peptides.
PolyhydroxyethylA SPE 12 µm, 300A, 300mg cartridges (obtained from PolyLC) were used for the HILIC procedure. Prior to use, cartridges required an overnight soak in 50 mM formic acid followed by rinsing with water the following day. Cartridges were preconditioned with 2 mL of Buffer A (90%
acetonitrile, 5 mM ammonium formate, pH 2.7) followed by 2 mL of Buffer B (5mM ammonium formate, pH 2.7) and finally re-equilibrated with 10 mL Buffer A. The diluted samples were loaded onto the cartridges and washed with a further 10 mL Buffer A.
Finally, peptides were eluted in 1 mL Buffer C (9 parts Buffer B plus 1 part Buffer A) and the samples dried on a Speedvac to remove organic solvent prior to LC- MS/MS analysis.
LC-MS/MS analysis. Lyophilised digests were resuspended in 50 µL of 0.1% TFA to give an approximate concentration of 1 µg/µL. One µL injection volumes were used throughout resulting in an on-column peptide loading of approximately 1 µg per injection. Analysis was performed in quintuplicate for each sample. All LC-MS/MS analyses were performed on an LTQ Orbitrap XL mass spectrometer coupled to an Ultimate 3000 RSLCnano system (Thermo Scientific). One µL injection volumes were used throughout and samples loaded directly onto the analytical column, PepMap RSLC C18, 2 µm x 75 µm id x 50 cm (Thermo Scientific). The composition (v/v) of LC buffers were as follows; Buffer A - 99.9% water plus 0.1% formic acid and Buffer B - 80% acetonitrile, 19.9% water and 0.1% formic acid. Peptides were loaded directly onto the column at a flow rate of 400 nl/min with an initial mobile phase composition of 1%
B. The organic strength was increased linearly from 1%
www.impactaging.com