cancers
Article
Lithocholic Acid, a Metabolite of the Microbiome, Increases Oxidative Stress in Breast Cancer
Patrik Kovács1, Tamás Csonka2, Tünde Kovács1, Zsanett Sári1, Gyula Ujlaki1, Adrien Sipos1, Zsolt Karányi3 , Dóra Sze ˝ocs1, Csaba Heged ˝us1, Karen Uray1, Laura Jankó1, MátéKiss4,5, Borbála Kiss6, Damya Laoui4,5 , LászlóVirág1 , Gábor Méhes2, Péter Bai1,7,8,* and Edit Mikó1,7,*
1 Departments of Medical Chemistry, Faculty of Medicine, University of Debrecen, 4032 Debrecen, Hungary
2 Departments of Pathology, Faculty of Medicine, University of Debrecen, 4032 Debrecen, Hungary
3 Departments of Internal Medicine, Faculty of Medicine, University of Debrecen, 4032 Debrecen, Hungary
4 Laboratory of Cellular and Molecular Immunology, Vrije Universiteit Brussel, 1050 Brussels, Belgium
5 Laboratory of Myeloid Cell Immunology, VIB Center for Inflammation Research, 1050 Brussels, Belgium
6 Departments of Dermatology, Faculty of Medicine, University of Debrecen, 4032 Debrecen, Hungary
7 MTA-DE Lendület Laboratory of Cellular Metabolism, 4032 Debrecen, Hungary
8 Research Center for Molecular Medicine, Faculty of Medicine, University of Debrecen, 4032 Debrecen, Hungary
* Correspondence: baip@med.unideb.hu (P.B.); miko.edit@med.unideb.hu (E.M.);
Tel.:+36-5-241-2345 (P.B. & E.M.); Fax:+36-5-241-2566 (P.B. & E.M)
Received: 3 August 2019; Accepted: 21 August 2019; Published: 27 August 2019 Abstract: In breast cancer patients, the diversity of the microbiome decreases, coinciding with decreased production of cytostatic bacterial metabolites like lithocholic acid (LCA). We hypothesized that LCA can modulate oxidative stress to exert cytostatic effects in breast cancer cells. Treatment of breast cancer cells with LCA decreased nuclear factor-2 (NRF2) expression and increased Kelch-like ECH associating protein 1 (KEAP1) expression via activation of Takeda G-protein coupled receptor (TGR5) and constitutive androstane receptor (CAR). Altered NRF2 and KEAP1 expression subsequently led to decreased expression of glutathione peroxidase 3 (GPX3), an antioxidant enzyme, and increased expression of inducible nitric oxide synthase (iNOS). The imbalance between the pro- and antioxidant enzymes increased cytostatic effects via increased levels of lipid and protein oxidation. These effects were reversed by the pharmacological induction of NRF2 with RA839, tBHQ, or by thiol antioxidants. The expression of key components of the LCA-elicited cytostatic pathway (iNOS and 4HNE) gradually decreased as the breast cancer stage advanced. The level of lipid peroxidation in tumors negatively correlated with the mitotic index. The overexpression of iNOS, nNOS, CAR, KEAP1, NOX4, and TGR5 or the downregulation of NRF2 correlated with better survival in breast cancer patients, except for triple negative cases. Taken together, LCA, a metabolite of the gut microbiome, elicits oxidative stress that slows down the proliferation of breast cancer cells. The LCA–oxidative stress protective pathway is lost as breast cancer progresses, and the loss correlates with poor prognosis.
Keywords: lithocholic acid; oxidative stress; breast cancer; NRF2; iNOS; peroxynitrite; 4HNE
1. Introduction
Evidence is accumulating for the role of bacterial dysbiosis in the pathogenesis of different cancers [1–16]. Bacteria secrete metabolites that either exert their effects locally, in a paracrine fashion, or enter the circulation and modulate distantly located cancer cells. For paracrine metabolites, the best examples are those involved in the carcinogenesis of colorectal cancer [17]. The metabolites that act on
Cancers2019,11, 1255; doi:10.3390/cancers11091255 www.mdpi.com/journal/cancers
Cancers2019,11, 1255 2 of 31
distantly located cancer cells have similar properties as classical human hormones; they are produced in a “gland”, i.e., the microbiome, and then transported to distant organs, where they regulate physiology and behavior [16]. Cadaverine [18], lithocholic acid (LCA) [19], deoxycholic acid [2], and short chain fatty acids [20] have been identified as hormone-like metabolites. These metabolites have pleiotropic effects and modulate multiple cancer hallmarks simultaneously [2,18,19]. The metabolites can inhibit proliferation, decrease epithelial-to-mesenchymal transition, reduce tumor metastasis, decrease cell migration and transmigration, induce antitumor immunity, rearrange cellular metabolism, induce senescence, and reduce cancer cell stemness [2,18,19,21].
LCA, in particular, inhibits the proliferation of breast cancer cells [19,22–26]. Serum glycolithocholate sulfate levels negatively correlate with the proliferation marker Ki67 in human breast cancers (Reference [24] additional file 9, line 110). Moreover, the bacterial machinery for LCA biosynthesis is suppressed in the early stages of breast cancer [19]. LCA has cytostatic properties that are specific to transformed cells [19,22,25]. LCA exerts its anticancer effects through the Takeda G-protein coupled receptor (TGR5) [19].
Breast cancer is a heterogeneous disease and there are well-established systems for the classification of breast cancer cases. The AJCC TNM classification [27,28] is based on the size of the primary tumor, presence of tumor cells in draining lymph nodes, and the existence of distant metastases. Stage 0 reflects in situ carcinoma, while increasing stages (I–IV) denote the spreading of the disease. The Nottingham grading system (grade I–III) [29,30] is used to assess the aggressiveness of the disease, where a higher grade reflects worse clinical outcomes. Finally, the molecular subtypes of breast cancer [31] are based on the driver gene mutations, which coincide with the expression of pharmacological targets in the tumors. The following molecular subtypes exist for breast cancer: Luminal A (ER+, HER2−, Ki67low, PgRhigh), Luminal B (ER+, HER2−, either Ki67highor PgRlowor ER+, HER2+, any Ki67, any PgR), Her2+(HER2+, ER−, and PgR−), and triple negative cases (TNBC, HER2−, ER−, PgR−) [31].
Oxidative stress evasion is critical in cancers [32,33]. Thus, antioxidant defense systems, driven by nuclear factor erythroid 2-related factor 2 (NRF2), play a crucial role in supporting breast cancer progression [24,34–36]. LCA is associated with the induction of oxidative stress with a preference towards lipid modifications [37,38]. Moreover, LCA treatment modulates NRF2 activity and expression in model systems other than breast cancer [39,40]. We hypothesized that LCA can induce oxidative stress to exert cytostatic effects in breast cancer cells.
2. Materials and Methods
2.1. Chemicals
All chemicals were from Sigma-Aldrich unless otherwise stated. Lithocholic acid (LCA), cholic acid (CA), chenodeoxycholic acid (CDCA), glutathione (GSH), N-acetyl-cysteine (NAC), and tert-butylhydrquinone (tBHQ) were from Sigma-Aldrich (St. Louis, MO, USA). LCA was used at concentrations of 0.1 µm, 0.3 µm, and 1µm, which corresponded to LCA concentrations in the breast [41]. GSH and NAC antioxidants were used at a final concentration of 5 mm. The NRF2 activator, tBHQ, was used at concentrations of 5µm and 10µm. TGR5 downstream signaling was inhibited using NF449 (a Gsα-selective antagonist). To inhibit nuclear receptor activation CINPA1 (CAR receptor antagonist), DY268 (FXR receptor antagonist), GSK2033 (LXR receptor antagonist)) were used. RA839, an NRF2 activator, which were obtained from Tocris Bioscience (Bristol, UK) and were used at a final concentrations of 5µm and/or 10µm. The proteasome inhibitor MG-132 was obtained from Calbiochem and was used at concentrations of 50 nM and 100 nM. The Silencer Select siRNAs targeting TGR5 (GPBAR1—siRNA ID: #1 s195791, #2 s45559, #3 s45558), CAR (NR1I3—siRNA ID: #1 s19369, #2 s19370, #3 s19368), VDR (siRNA ID: s14777), PXR (NR1I2—siRNA ID: s16910), and NRF2 (siRNA ID: #1 s9493, #2 s9492, #3 9491) and the negative control siRNA #1 (cat.no. 4390843) were obtained from Thermo Fisher Scientific and were used at a final concentration of 30 nM.
Cancers2019,11, 1255 3 of 31
2.2. Cell Lines
The 4T1 cells were maintained in RPMI-1640 (Sigma-Aldrich) medium containing 10% FBS and 1% penicillin/streptomycin, 2 mm L-glutamine, and 1% pyruvate at 37 ◦C with 5% CO2. The MCF7 cells were maintained in MEM (Sigma-Aldrich) medium supplemented with 10% FBS, 1% penicillin/streptomycin, and 2 mm L-glutamine at 37◦C with 5% CO2. The SKBR3 cells were maintained in DMEM (Sigma-Aldrich, 1000 mg/L glucose) medium supplemented with 10% FBS, 1%
penicillin/streptomycin, and 2 mm L-glutamine at 37◦C with 5% CO2. The human primary fibroblast cells were maintained in DMEM (Sigma-Aldrich, 1000 mg/L glucose, D5546) containing 20% FBS, 1%
penicillin/streptomycin, 2 mm L-glutamine, and 10 mm HEPES at 37◦C with 5% CO2.
MCF7, SKBR-3, and 4T1 cells were purchased from the American Type Culture Collection (ATCC).
Cells were regularly checked for mycoplasma contamination. In the cellular experiments, control cells received vehicle (0.001% DMSO in medium) but no LCA. All cellular experiments were performed in the presence of 10% FBS unless stated otherwise.
2.3. Proliferation Assay
Cellular proliferation was assessed using a sulforhodamine assay, as described in Reference [42].
Cells were seeded in a 96-well plates (4T1—1500 cells/well) and treated with the primary bile acids, CA and CDCA (0.01–10µm) and NRF2 activator, RA839 (5µm and 10µm), or GSH and NAC antioxidants (5 mm) in the presence of LCA (0.3µm) for 2 days. The cells were then fixed by the addition of trichloroacetic acid at a final concentration of 10% and were incubated for 1 h at 4◦C. Cells were washed with water and stained with 0.4% (w/v) sulphorhodamine B solution in 1% acetic acid. Unbound dye was removed by washing with 1% acetic acid. Bound stain was solubilized with 10 mm Tris base and the absorbance was measured at 540 nm.
2.4. Real-Time Quantitative PCR (RT-qPCR)
RNA isolation and RT-qPCR reactions were performed similarly to in Reference [43]. Total RNA was isolated from cells and tumor samples using TRIzol reagent (Invitrogen Corporation, Carlsbad, CA, USA). RNA (2µg) was reverse transcribed using a High Capacity cDNA Reverse Transcription Kit (Applied Biosystems, Foster City, CA, USA) according to the manufacturer’s instructions. The qPCR was performed with qPCRBIO SyGreen Lo-ROX Supermix (PCR Biosystems Ltd., London, UK) on a Light-Cycler 480 Detection System (Roche Applied Science, Basel, Switzerland). The 36B4 gene was used for normalization. Primers are listed in Table1.
Table 1.Primers used in the RT-qPCR reactions.
Gene Symbol MURINE Forward Primer (50–30) Murine Reverse Primer (50–30)
CAT CCTTCAAGTTGGTTAATGCAGA CAAGTTTTTGATGCCCTGGT
GCLC GATTCGGGATGGGCAACT AAAGGTATCTTGCCTCAGATATGC
GPX2 GTTCTCGGCTTCCCTTGC TTCAGGATCTCCTCGTTCTGA
GPX3 GGCTTCCCTTCCAACCAA CCCACCTGGTCGAACATACT
HMOX1 AGGCTAAGACCGCCTTCCT TGTGTTCCTCTGTCAGCATCA
iNOS GAAGTGCAAAGTCTCAGACATGG GATTCTGGAACATTCTGTGCTGTC
NOX4 GCAGATTTACTCTGTGTGTTGCAT TCCCATCTGTTTGACTGAGGT
NQO1 AGCGTTCGGTATTACGATCC AGTACAATCAGGGCTCTTCTCG
NRF2 CATCAGGCCCAGTCCCTCAAT CAGCGGTAGTATAÓCAGCCAGCT
SOD1 CCATCAGTATGGGGACAATACA GGTCTCCAACATGCCTCTCT
SOD2 TGCTCTAATCAGGACCCATTG GTAGTAAGCGTGCTCCCACAC
SOD3 CTCTTGGGAGAGCCTGACA GCCAGTAGCAAGCCGTAGAA
36B4 AGATTCGGGATATGCTGTTGG AAAGCCTGGAAGAAGGAGGTC
Cancers2019,11, 1255 4 of 31
2.5. SDS-PAGE and Western Blotting
Protein isolation, SDS-PAGE, and western blotting were performed similarly to in Reference [44].
Cells were lysed in RIPA buffer (50 mm Tris, 150 mm NaCl, 0.1% SDS, 1% TritonX 100, 0.5% sodium deoxycolate, 1 mm EDTA, 1 mm Na3VO4, 1 mm NaF, 1 mm PMSF, protease inhibitor cocktail). Protein samples (30–50µg) were separated on 10% SDS polyacrylamide gels and electrotransferred onto nitrocellulose membranes. After blocking for 1 h with TBST containing 5% BSA, the membranes were incubated with primary antibodies overnight at 4◦C. After washing with 1×TBST solution, the membranes were probed with IgG HRP-conjugated secondary antibodies (Cell Signaling Technology, Inc. Beverly, MA, USA 1:2000). Bands were visualized by enhanced chemiluminescence reaction (SuperSignal West Pico Solutions, Thermo Fisher Scientific Inc., Rockford, IL, USA). Densitometry was performed using the Image J software [45]. Antibodies used in this study are listed in Table2.
Table 2.Antibodies used in western blot analyses.
Antibody Symbol Vendor Dilution
NRF2 Abcam (ab31163) 1:1000
NRF2 Novus (NBP1-32822 1:1000
KEAP1 Cell Signaling (8047) 1:1000
GPX3 Abcam (ab104448) 1:1000
iNOS Novus (NB300-605) 1:1000
4HNE Abcam (ab46545) 1:1000
Nitrotyrosine Millipore (06-284) 1:1000
TGR5/GPBAR1 Novus (NBP2-23669) 1:1000
CAR Abcam (ab186869) 1:1000
ACTIN Sigma-Aldrich (A3854) 1:20000
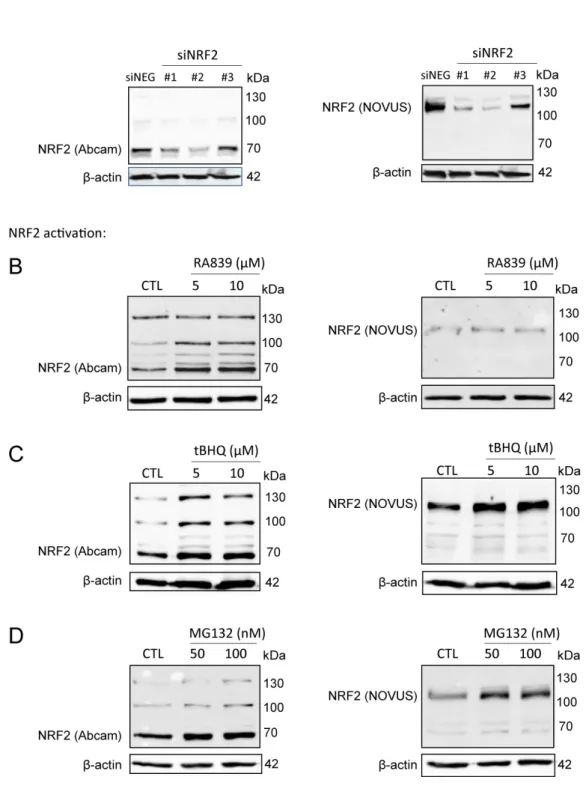
We used the Abcam (ab31163) antibody in our studies, which we validated, due to the ambiguity in the molecular weight of NRF2. The calculated molecular weight of NRF2 is 68 kDa, however, recent studies have claimed that NRF2 has a molecular weight of ~130 kDa [46,47]. In the validation studies, we used a second NRF2 antibody (Novus, NBP1-32822) which, according to the literature [46,47], recognizes the ~130 kDa form of NRF2. The signal from both antibodies decreased when NRF2 was silenced by siRNA (Figure1A). NRF2 protein was stabilized when NRF2 activators (RA839 or tBHQ) (Figure1B,C) or a proteasome inhibitor (MG132) (Figure1D) were administered to the cells. Both high and low molecular weight bands behaved in a similar fashion regardless of the antibody used. In the upcoming experiments, we used the Abcam ab31163 antibody and quantitation was done based on the
~70 kDa band.
2.6. Determination of Lipid Peroxidation
Lipid peroxidation was assessed using the thiobarbituric acid-reactive substances (TBARS) assay as described in [48]. The 4T1 cells were seeded in T150 flasks and were treated with LCA (0.3µm) or NRF2 activator (5µm and 10µm) together with LCA (0.3µm) for 2 days. Cells were washed with PBS, scraped, and collected by centrifugation. After adding 8.1% SDS, 20% acetic acid, 0.8% thiobarbituric acid (TBA), and distilled water to the cell pellet, the sample was incubated at 96◦C for 1 h. Samples were cooled down and centrifuged, and then the absorbance of the supernatant was measured at 540 nm. As a marker of lipid peroxidation, levels of 4-hydroxynonenal (4HNE)-modified proteins were also determined using western blotting.
Cancers2019,11, 1255 5 of 31
Cancers 2019, 11, x 5 of 31
Figure 1. NRF2 antibody validation. (A) NRF2 expression was silenced in MCF7 cells by transiently transfecting NRF2-specific siRNAs or a negative control siRNA for 48 h, then NRF2 protein expression was determined using two different antibodies (Abcam: ab31163; NOVUS: NBP1-32822). (B–D) 4T1 cells were treated with NRF2 activators, RA839 or tBHQ, or MG-132, a proteasome inhibitor, in the concentrations indicated for 48 h, then NRF2 protein expression was determined by western blotting using two different antibodies (Abcam: ab31163; NOVUS: NBP1-32822).
Figure 1.NRF2 antibody validation. (A) NRF2 expression was silenced in MCF7 cells by transiently transfecting NRF2-specific siRNAs or a negative control siRNA for 48 h, then NRF2 protein expression was determined using two different antibodies (Abcam: ab31163; NOVUS: NBP1-32822). (B–D) 4T1 cells were treated with NRF2 activators, RA839 or tBHQ, or MG-132, a proteasome inhibitor, in the concentrations indicated for 48 h, then NRF2 protein expression was determined by western blotting using two different antibodies (Abcam: ab31163; NOVUS: NBP1-32822).
Cancers2019,11, 1255 6 of 31
2.7. Transfections
Cells were seeded in 24-well plates (MCF7—50.000 cell/well). On the following day, cells were transiently transfected with TGR5, CAR, VDR, or PXR siRNA or the negative control at a final concentration of 30 nM using Lipofectamine RNAiMAX transfection reagent (Invitrogen). Cells were incubated with transfection complexes in medium containing LCA (0.3µm) for 48 h. CTL stands for vehicle-treated (0.001% DMSO in medium), non-transfected cells, while NEG stands for negative control siRNA-transfected, LCA-treated cells.
2.8. ABTS Decoloration Assay
Preparation of 2,20-Azino-bis-3-ethylbenzothiazoline-6-sulfonic acid (ABTS) was performed as described [49]. The absorbance of ABTS solution was adjusted to 1.2. LCA and ascorbic acid were dissolved and diluted in DMSO. Five microliters of samples were added to the wells of 96-well half area microplates, then 50µL of ABTS solution was added to the wells. Samples were incubated at RT for 30 min. Absorbance was measured with Tecan Spark multi-label reader (405 nm). Antioxidant activity was expressed as a percentage of control (DMSO-treated) samples. The 9% DMSO in ATBS buffer was used for dilution at all concentrations. An ascorbic acid concentration series was used as a positive control.
2.9. Database Screening
The kmplot.com database [50] was used to study the link between gene expression levels (CAR, TGR5, NRF2, KEAP1, iNOS, nNOS, and NOX4) and breast cancer survival in humans. Probe numbers are indicated in the corresponding tables. The GEO database of the NCBI was assessed using the following keywords: CAR+breast cancer, iNOS+breast cancer, nNOS+breast cancer, NRF2+breast cancer, and TGR5+breast cancer.
2.10. Tissue Microarray, Immunohistochemistry, and Analysis
This study was authorized by the institutional ethical body. Tissue microarray (TMA) and immunohistochemistry were performed as described in Reference [51]. The TMA was built from the archived tissue blocks of 88 breast cancer patients. We took three replicate samples from each block and we evaluated the staining using the H-score system [52]. For immunohistochemistry, the protocol ofLeica Bond Max™was used. The antibodies and the conditions used are summarized in Table3.
Table 3.Antibodies and conditions used in tissue microarray (TMA) analyses.
Antibody Symbol Vendor Antigen Retrieval Dilution Detection
NRF2 Abcam (ab31163)
Ventana BenchMark ULTRA/Roche Cell Conditioning 1 (CC1)
40 min, 95◦C
1:100
OptiView DAB IHC Detection
kit/Roche
iNOS ThermoFisher
Scientific (PA5-16855)
Ventana BenchMark ULTRA/Roche Cell Conditioning 1 (CC1)
20 min, 95◦C
1:100
UltraView Universal DAB Detection kit/Roche
4HNE Abcam (ab46545)
Ventana BenchMark ULTRA/Roche Cell Conditioning 1 (CC1)
20 min, 95◦C
1:1000
UltraView Universal DAB Detection kit/Roche
TGR5 GeneTEX (GTX100026, Hsinchu City, Taiwan)
pressure cooker (Avair) in
0.1 m citrate buffer at pH 6 1:1000
EnVision Flex (K8000, Dako, Santa Clara, CA,
USA)
Cancers2019,11, 1255 7 of 31
2.11. Animal Study
Animal experiments were authorized by the local and national ethical board (reg. 1/2015/DEMÁB) and were performed to conform to the relevant EU and US guidelines. We re-analyzed samples from a previous experiment in line with the 3R principles.
We assessed the effects of the supplementation of LCA on tumor growth and behavior by grafting 4T1 cells to Balb/c female mice, as described in Reference [19]. LCA was administered by oral gavage, in a dose of 15 nmol once a day. This dose corresponds to the serum reference concentration of LCA [19].
After two weeks, the mice were sacrificed by cervical dislocation, and tumor and metastases were harvested for subsequent analysis.
The 4T1 cells were suspended (2×10⁶/mL) in ice-cold PBS–matrigel (1:1, Sigma-Aldrich) at a 1:1 ratio. From this suspension, female BALB/c mice received 50µL injections to their second inguinal fat pads on both sides (105cells/injection). Tumor growth and animal wellbeing were monitored daily.
Animals received daily oral LCA treatments. LCA stock was prepared in 96% ethanol at 100× concentration (7.5 mm) for storage at−20◦C. LCA stock was diluted each day to a working concentration of 75µm in sterile PBS immediately before the treatment. Ethanol vehicle (1% in PBS) was prepared and diluted similarly. Animals received a daily oral dose of 200µL/30 g bodyweight from the LCA solution or the vehicle. Researchers administered LCA and vehicle solutions blind. Treatment was administered every day at the same time between 8 a.m. and 10 a.m.
Experimental animals were female BALB/c animals between 8–10 weeks of age (20–25 g). Mice were randomized for all experiments. Animals were bred in the “specific pathogen free” zone of the Animal Facility at the University of Debrecen, and kept in the “minimal disease” zone during the experiment. Animal studies have been reported in compliance with the ARRIVE guidelines [53,54].
Mice were purchased from Jackson Laboratories (Bor Harbor, ME, USA) and were subsequently bred at the animal facility of the University of Debrecen. No more than six mice were housed in each cage (standard block shape 365×207×140 mm, surface 530 cm2; 1284 L Eurostandard Type II. L from Techniplast) with Lignocel Select Fine (J. Rettenmaier und Söhne, Germany) as bedding. Mice had paper tubes to enrich their environment. The dark/light cycle was 12 h, and temperature 22±1◦C.
Cages were changed once a week, on the same day. Mice had ad libitum access to food and water (sterilized tap water). The animal facility was overseen by a veterinarian. A total of 28 mice were used in this study and group sizes are indicated in the figure captions.
2.12. Statistical Analysis
We used a two-tailed Student’st-test for the comparison of two groups unless stated otherwise.
Fold data were log2transformed to achieve normal distribution. For multiple comparisons, one-way analysis of variance test (ANOVA) was used followed by Tukey’s or Dunnett’s honestly significant (HSD) post hoc test. Data are presented as mean±SEM unless stated otherwise. Statistical analysis was done using GraphPad Prism VI software. Correlation studies were done using Pearson correlation test and linear regression. Mitotic index was log2transformed before the analysis. Values ofp<0.05 were considered statistically significant. Calculations were performed by R project [55] version 3.5.2.
3. Results
3.1. Lithocholic Acid Inhibited NRF2 Activation
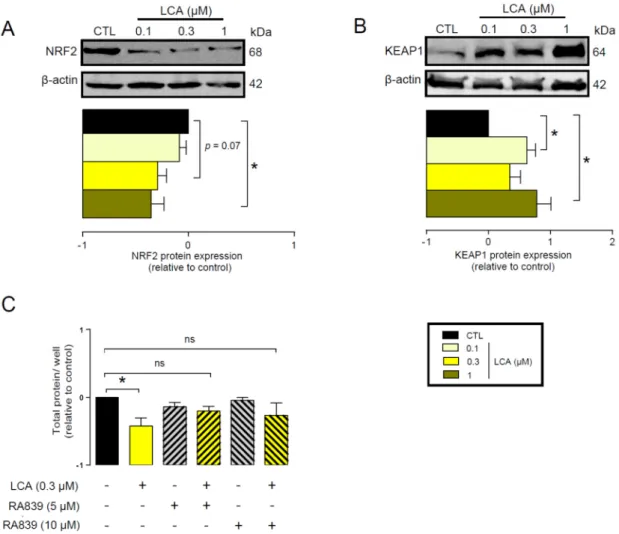
First, we assessed whether LCA administration could influence the expression of key elements in the antioxidant NRF2/KEAP1 pathway. The LCA concentrations used in the experiments corresponded to the normal concentrations of LCA in human breast tissue (0.1–1µm) [41]. LCA treatment of 4T1 mouse breast cancer cells decreased NRF2 protein levels (Figure2A) while upregulating protein expression of the NRF2 repressor, KEAP1 (Figure2B). The pharmacological activation of NRF2 by RA839 abolished the anti-proliferative effects of LCA (Figure2C). We assessed the effectiveness of RA839 by measuring the mRNA expression of a set of NRF2-regulated genes: NAD(P)H quinone
Cancers2019,11, 1255 8 of 31
dehydrogenase 1 (NQO1), glutamate–cysteine ligase catalytic subunit (GCLC), catalase (CAT), and heme oxygenase 1 (HMOX1), (Figure3). Taken together, these results show that decreased NRF2 expression played a key role in eliciting the cytostatic effects of LCA.
Cancers 2019, 11, x 8 of 31
3. Results
3.1. Lithocholic Acid Inhibited NRF2 Activation
First, we assessed whether LCA administration could influence the expression of key elements in the antioxidant NRF2/KEAP1 pathway. The LCA concentrations used in the experiments corresponded to the normal concentrations of LCA in human breast tissue (0.1–1 µm) [41]. LCA treatment of 4T1 mouse breast cancer cells decreased NRF2 protein levels (Figure 2A) while upregulating protein expression of the NRF2 repressor, KEAP1 (Figure 2B). The pharmacological activation of NRF2 by RA839 abolished the anti-proliferative effects of LCA (Figure 2C). We assessed the effectiveness of RA839 by measuring the mRNA expression of a set of NRF2-regulated genes:
NAD(P)H quinone dehydrogenase 1 (NQO1), glutamate–cysteine ligase catalytic subunit (GCLC), catalase (CAT), and heme oxygenase 1 (HMOX1), (Figure 3). Taken together, these results show that decreased NRF2 expression played a key role in eliciting the cytostatic effects of LCA.
Figure 2. LCA inhibited the NRF2/KEAP1 system. (A,B) The 4T1 cells were treated with LCA in the concentrations indicated for 48 h, then (A) NRF2 and (B) KEAP1 proteins were analyzed by western blotting. (n = 3, upper panel: representative figure, lower panel: densitometric analysis of western blots from independent experiments). (C) The 4T1 cells were treated with 0.3 µm LCA and/or the NRF2 activator, RA839, in the concentrations indicated for 48 h, then total protein concentration was determined by sulforhodamine B assay (n = 5). Data are plotted as mean ± SEM. * indicates p < 0.05, control vs. LCA-treated groups. (ns, not significant; KEAP1, Kelch-like ECH associating protein 1;
LCA, lithocholic acid; NRF2, nuclear factor).
Figure 2.LCA inhibited the NRF2/KEAP1 system. (A,B) The 4T1 cells were treated with LCA in the concentrations indicated for 48 h, then (A) NRF2 and (B) KEAP1 proteins were analyzed by western blotting. (n=3, upper panel: representative figure, lower panel: densitometric analysis of western blots from independent experiments). (C) The 4T1 cells were treated with 0.3µm LCA and/or the NRF2 activator, RA839, in the concentrations indicated for 48 h, then total protein concentration was determined by sulforhodamine B assay (n=5). Data are plotted as mean±SEM. * indicatesp<0.05, control vs. LCA-treated groups. (ns, not significant; KEAP1, Kelch-like ECH associating protein 1;
LCA, lithocholic acid; NRF2, nuclear factor).
3.2. LCA Treatment Induced Oxidative Stress by Reducing NRF2 Expression
The previous results suggested that LCA treatment may impair cellular antioxidant defenses.
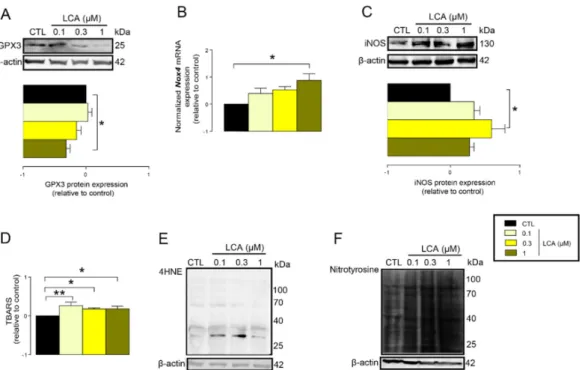
In line with that, we found that the protein expression of glutathione peroxidase-3 (GPX3), a key antioxidant protein, decreased upon LCA treatment (Figure4A). Oxidative stress is an imbalance between antioxidant and pro-oxidant genes. Thus, we assessed whether LCA can induce expression of pro-oxidant genes. LCA induced the mRNA expression of NADPH oxidase 4 (NOX4), a major ROS producing enzyme (Figure4B), and inducible NO synthase (iNOS), a major source of nitric oxide in cells (Figure4C).
Cancers2019,11, 1255 9 of 31
Cancers 2019, 11, x 9 of 31
Figure 3. Pharmacological activation of NRF2 induced the expression of NRF2 target genes. The 4T1 cells were treated with the NRF2 activator, RA839, in the concentrations indicated for 48 h, then the expressions of NRF2 target genes, NQO1, GCLC, CAT, and HMOX1, were determined using RT-qPCR (n = 3). Abbreviations: NAD(P)H quinone dehydrogenase 1 (NQO1), glutamate–cysteine ligase catalytic subunit (GCLC), catalase (CAT), and heme oxygenase 1 (HMOX1). Data are plotted as mean
± SD. ** and *** indicate statistically significant differences between control and RA839-treated groups at p < 0.01 or p < 0.001, respectively.
3.2. LCA Treatment Induced Oxidative Stress by Reducing NRF2 Expression
The previous results suggested that LCA treatment may impair cellular antioxidant defenses. In line with that, we found that the protein expression of glutathione peroxidase-3 (GPX3), a key antioxidant protein, decreased upon LCA treatment (Figure 4A). Oxidative stress is an imbalance between antioxidant and pro-oxidant genes. Thus, we assessed whether LCA can induce expression of pro-oxidant genes. LCA induced the mRNA expression of NADPH oxidase 4 (NOX4), a major ROS producing enzyme (Figure 4B), and inducible NO synthase (iNOS), a major source of nitric oxide in cells (Figure 4C).
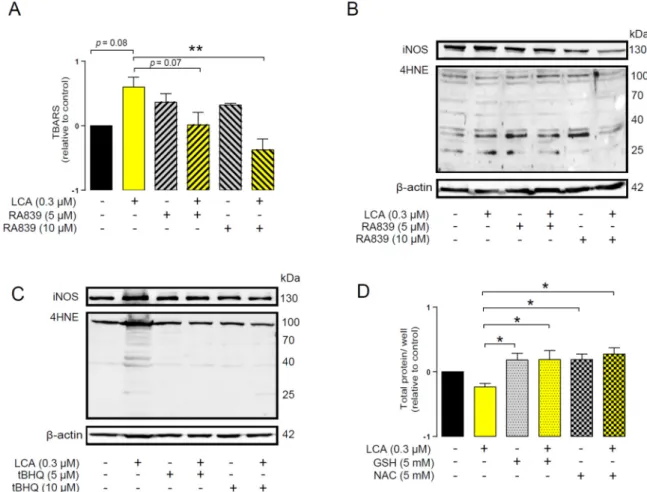
An imbalance between pro-oxidant and antioxidant systems leads to oxidative or nitrosative stress. We detected increased lipid and protein oxidation after LCA treatment, as shown by increases in thiobarbituric acid reactive species (TBARS) (Figure 4D) and 4-hydroxynonenal adducts (4HNE) (Figure 4E) [56]. Moreover, increased expression of iNOS suggested increased production of ONOO− [57,58] and the subsequent enhancement of nitrosative stress. Nitrotyrosine levels were increased in LCA-treated cells (Figure 4F). Importantly, the activation of NRF2 by RA839 or tBHQ prevented both increases in TBARS (Figure 5A) and 4HNE (Figure 5B,C) and decreases in iNOS expression (Figure 5B,C) when applied in combination with LCA. Finally, the thiol antioxidants glutathione (GSH) and N-acetyl-cysteine (NAC) blunted the LCA-elicited anti-proliferative effects (Figure 5D) but did not impact other LCA-mediated cancer hallmarks, such as cancer cell metabolism or epithelial-to- mesenchymal transition [19]. LCA had no direct antioxidant effects in the concentrations we used in the current study (0.1–1 µm), or at higher concentrations (up to 300 µm), where ascorbic acid readily acted as an antioxidant (Figure 6).
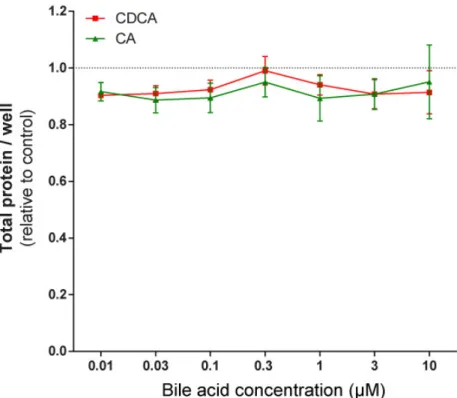
To assess whether the phenomena described above were restricted to 4T1 cells, the effects of LCA were assayed in MCF7 and SKBR3 cancer cell lines. LCA treatment decreased NRF2 expression (Figure 7A,D) and increased iNOS expression (Figure 7B,E) and 4HNE signals (Figure 7C,F) in both cell lines, similarly to our observations in 4T1 cells. LCA did not modulate the expression of NRF2, KEAP1, or 4HNE in primary, non-transformed human fibroblasts (Figure 7G,H). Primary bile acids, in concentrations corresponding to their serum reference concentrations, did not significantly reduce cancer cell proliferation (Figure 8).
Figure 3.Pharmacological activation of NRF2 induced the expression of NRF2 target genes. The 4T1 cells were treated with the NRF2 activator, RA839, in the concentrations indicated for 48 h, then the expressions of NRF2 target genes,NQO1, GCLC,CAT, andHMOX1, were determined using RT-qPCR (n=3). Abbreviations: NAD(P)H quinone dehydrogenase 1 (NQO1), glutamate–cysteine ligase catalytic subunit (GCLC), catalase (CAT), and heme oxygenase 1 (HMOX1). Data are plotted as mean±SD. ** and *** indicate statistically significant differences between control and RA839-treated groups atp<0.01 orp<0.001, respectively.
Cancers 2019, 11, x 10 of 31
Figure 4. LCA-induced oxidative stress in 4T1 breast cancer cells. (A–F) The 4T1 cells were treated with LCA for 48 h, then the indicated measurements were performed. (A) GPX3 antioxidant protein expression was analyzed by western blotting (n = 4). (B) NOX4 mRNA expression was determined in RT-qPCR (n = 4). (C) The level of iNOS protein was detected by western blotting (n = 3). (D) Lipid peroxidation was measured by determining TBARS (n = 3). (E) The 4HNE levels were determined by western blotting (representative figure, n = 3). (F) Nitrotyrosine was detected in western blotting (n = 3). In the cases of 4HNE and nitrotyrosine, similar results were obtained in three independent experiments. Data are plotted as mean ± SEM. * and ** indicate p < 0.05 or p < 0.01, control vs. LCA- treated groups. (GPX3, glutathione peroxidase 3; LCA, lithocholic acid; NOX4, NADPH oxidase 4;
TBARS, thiobarbituric acid reactive substances; 4HNE, 4-hydroxynonenal).
Figure 4. LCA-induced oxidative stress in 4T1 breast cancer cells. (A–F) The 4T1 cells were treated with LCA for 48 h, then the indicated measurements were performed. (A) GPX3 antioxidant protein expression was analyzed by western blotting (n=4). (B)NOX4mRNA expression was determined in RT-qPCR (n=4). (C) The level of iNOS protein was detected by western blotting (n=3). (D) Lipid peroxidation was measured by determining TBARS (n=3). (E) The 4HNE levels were determined by western blotting (representative figure,n=3). (F) Nitrotyrosine was detected in western blotting (n=3). In the cases of 4HNE and nitrotyrosine, similar results were obtained in three independent experiments. Data are plotted as mean±SEM. * and ** indicatep<0.05 orp<0.01, control vs.
LCA-treated groups. (GPX3, glutathione peroxidase 3; LCA, lithocholic acid; NOX4, NADPH oxidase 4; TBARS, thiobarbituric acid reactive substances; 4HNE, 4-hydroxynonenal).
Cancers2019,11, 1255 10 of 31
An imbalance between pro-oxidant and antioxidant systems leads to oxidative or nitrosative stress. We detected increased lipid and protein oxidation after LCA treatment, as shown by increases in thiobarbituric acid reactive species (TBARS) (Figure4D) and 4-hydroxynonenal adducts (4HNE) (Figure 4E) [56]. Moreover, increased expression of iNOS suggested increased production of ONOO− [57,58] and the subsequent enhancement of nitrosative stress. Nitrotyrosine levels were increased in LCA-treated cells (Figure4F). Importantly, the activation of NRF2 by RA839 or tBHQ prevented both increases in TBARS (Figure 5A) and 4HNE (Figure5B,C) and decreases in iNOS expression (Figure 5B,C) when applied in combination with LCA. Finally, the thiol antioxidants glutathione (GSH) and N-acetyl-cysteine (NAC) blunted the LCA-elicited anti-proliferative effects (Figure5D) but did not impact other LCA-mediated cancer hallmarks, such as cancer cell metabolism or epithelial-to-mesenchymal transition [19]. LCA had no direct antioxidant effects in the concentrations we used in the current study (0.1–1µm), or at higher concentrations (up to 300µm), where ascorbic acid readily acted as an antioxidant (FigureCancers 2019, 11, x 6). 11 of 31
Figure 5. NRF2 activation modulated LCA-induced oxidative stress responses in 4T1 breast cancer cells. The 4T1 cells were treated with 0.3 µm LCA and the NRF2 activator RA839 or tBHQ in the concentrations indicated for 48 h. Lipid peroxidation was determined by measuring (A) TBARS (n = 4) and (B,C) 4-HNE levels using western blotting (n = 3). (D) The 4T1 cells were treated with LCA (0.3 µm) and/or GSH and NAC (both at 5 mm) antioxidants for 48 h, then total protein concentration was determined using the sulforhodamine B assay (n = 3). For statistical analysis ANOVA test was used followed by the Dunnett post-hoc test, where all groups were compared to the LCA-treated cohort.
Data are plotted as mean ± SEM. ** p < 0.01, LCA vs. LCA/NRF2-activator-treated groups (GSH, reduced glutathione; LCA, lithocholic acid; NAC, N-acetylcysteine; TBARS, thiobarbituric acid reactive substances; 4HNE, 4-hydroxynonenal).
Figure 6. LCA did not act as an antioxidant. The ABTS radical scavenging assay was done in 96-well plates using triplicate samples. LCA was tested in a concentration range of 0.03–300 µm. Ascorbic Figure 5. NRF2 activation modulated LCA-induced oxidative stress responses in 4T1 breast cancer cells. The 4T1 cells were treated with 0.3µm LCA and the NRF2 activator RA839 or tBHQ in the concentrations indicated for 48 h. Lipid peroxidation was determined by measuring (A) TBARS (n=4) and (B,C) 4-HNE levels using western blotting (n=3). (D) The 4T1 cells were treated with LCA (0.3µm) and/or GSH and NAC (both at 5 mm) antioxidants for 48 h, then total protein concentration was determined using the sulforhodamine B assay (n=3). For statistical analysis ANOVA test was used followed by the Dunnett post-hoc test, where all groups were compared to the LCA-treated cohort. Data are plotted as mean±SEM. **p<0.01, LCA vs. LCA/NRF2-activator-treated groups (GSH, reduced glutathione; LCA, lithocholic acid; NAC, N-acetylcysteine; TBARS, thiobarbituric acid reactive substances; 4HNE, 4-hydroxynonenal).
Cancers2019,11, 1255 11 of 31
Cancers 2019, 11, x 11 of 31
Figure 5. NRF2 activation modulated LCA-induced oxidative stress responses in 4T1 breast cancer cells. The 4T1 cells were treated with 0.3 µm LCA and the NRF2 activator RA839 or tBHQ in the concentrations indicated for 48 h. Lipid peroxidation was determined by measuring (A) TBARS (n = 4) and (B,C) 4-HNE levels using western blotting (n = 3). (D) The 4T1 cells were treated with LCA (0.3 µm) and/or GSH and NAC (both at 5 mm) antioxidants for 48 h, then total protein concentration was determined using the sulforhodamine B assay (n = 3). For statistical analysis ANOVA test was used followed by the Dunnett post-hoc test, where all groups were compared to the LCA-treated cohort.
Data are plotted as mean ± SEM. ** p < 0.01, LCA vs. LCA/NRF2-activator-treated groups (GSH, reduced glutathione; LCA, lithocholic acid; NAC, N-acetylcysteine; TBARS, thiobarbituric acid reactive substances; 4HNE, 4-hydroxynonenal).
Figure 6. LCA did not act as an antioxidant. The ABTS radical scavenging assay was done in 96-well plates using triplicate samples. LCA was tested in a concentration range of 0.03–300 µm. Ascorbic Figure 6.LCA did not act as an antioxidant. The ABTS radical scavenging assay was done in 96-well plates using triplicate samples. LCA was tested in a concentration range of 0.03–300µm. Ascorbic acid was used as a positive control. Antioxidant activity was expressed as the percentage of control samples.
Means of three independent experiments±SD are presented. ** and *** indicate a statistically significant difference between control and ascorbic acid-treated groups atp<0.01 orp<0.001, respectively.
To assess whether the phenomena described above were restricted to 4T1 cells, the effects of LCA were assayed in MCF7 and SKBR3 cancer cell lines. LCA treatment decreased NRF2 expression (Figure7A,D) and increased iNOS expression (Figure7B,E) and 4HNE signals (Figure7C,F) in both cell lines, similarly to our observations in 4T1 cells. LCA did not modulate the expression of NRF2, KEAP1, or 4HNE in primary, non-transformed human fibroblasts (Figure7G,H). Primary bile acids, in concentrations corresponding to their serum reference concentrations, did not significantly reduce cancer cell proliferation (Figure8).
3.3. LCA-Elicited Oxidative Stress Was Mediated by TGR5 and Partially by CAR Receptor
Next, we aimed to identify the receptors responsible for the effects of LCA. Several nuclear receptors and the Takeda G-protein coupled receptor (TGR5) can bind and respond to LCA [19]. First, we used pharmacological agents designed to inhibit LCA receptors, including CINPA1 to inhibit the constitutive androstane (CAR) receptor, DY268 to inhibit the farnesyl-X receptor (FXR), GSK2033 to inhibit the liver X receptor (LXR), and NF449, a Gsα-selective antagonist that can inhibit the downstream signaling of the TGR5 receptor. LCA-mediated reduction in NRF2 protein expression was blocked by NF449 and CINPA1, while the other inhibitors (GSK2033 and DY268) were ineffective (Figure9A).
Cancers2019,11, 1255 12 of 31
Cancers 2019, 11, x 12 of 31
acid was used as a positive control. Antioxidant activity was expressed as the percentage of control samples. Means of three independent experiments ± SD are presented. ** and *** indicate a statistically significant difference between control and ascorbic acid-treated groups at p < 0.01 or p < 0.001, respectively.
Figure 7. LCA induced oxidative stress in MCF7 and SKBR-3 human breast cancer cell lines, but not in primary fibroblasts. (A–C) The MCF7 cells were treated with LCA in the concentrations indicated for 48 h, then (A) NRF2, (B) iNOS protein expression, and (C) 4HNE were determined by western blotting (n = 3). (D–F) The SKBR3 cells were treated with LCA for 48 h, then (D) NRF2, (E) iNOS, and (b) 4HNE expressions were determined by western blotting (n = 3). Upper panels: representative figures. Lower panels: densitometric analysis of western blots. In the case of 4HNE, similar data were obtained in three independent experiments. (G,H) Fibroblast cells were treated with 0.3 µm LCA for 48 h then (G) NRF2, KEAP1, and (H) 4HNE expressions were determined by western blotting. Data Figure 7.LCA induced oxidative stress in MCF7 and SKBR-3 human breast cancer cell lines, but not in primary fibroblasts. (A–C) The MCF7 cells were treated with LCA in the concentrations indicated for 48 h, then (A) NRF2, (B) iNOS protein expression, and (C) 4HNE were determined by western blotting (n=3). (D–F) The SKBR3 cells were treated with LCA for 48 h, then (D) NRF2, (E) iNOS, and (b) 4HNE expressions were determined by western blotting (n=3). Upper panels: representative figures. Lower panels: densitometric analysis of western blots. In the case of 4HNE, similar data were obtained in three independent experiments. (G,H) Fibroblast cells were treated with 0.3µm LCA for 48 h then (G) NRF2, KEAP1, and (H) 4HNE expressions were determined by western blotting. Data are plotted as mean±SEM. *p<0.05, control vs. LCA-treated. (LCA, lithocholic acid; NRF2, nuclear factor, erythroid 2-like 2; 4HNE, 4-hydroxynonenal; iNOS, inducible nitric oxide synthase).
Cancers2019,11, 1255 13 of 31
Cancers 2019, 11, x 13 of 31
are plotted as mean ± SEM. * p < 0.05, control vs. LCA-treated. (LCA, lithocholic acid; NRF2, nuclear factor, erythroid 2-like 2; 4HNE, 4-hydroxynonenal; iNOS, inducible nitric oxide synthase).
Figure 8. Primary bile acids did not affect the proliferation of 4T1 breast cancer cells. The 4T1 cells were treated with CA and CDCA in the concentrations indicated for 48 h, then total protein concentrations were determined by sulforhodamine B assay (n = 4). Data are plotted as mean ± SEM. (CA, cholic acid; CDCA, chenodeoxycholic acid).
3.3. LCA-Elicited Oxidative Stress was Mediated by TGR5 and Partially by CAR Receptor
Next, we aimed to identify the receptors responsible for the effects of LCA. Several nuclear receptors and the Takeda G-protein coupled receptor (TGR5) can bind and respond to LCA [19]. First, we used pharmacological agents designed to inhibit LCA receptors, including CINPA1 to inhibit the constitutive androstane (CAR) receptor, DY268 to inhibit the farnesyl-X receptor (FXR), GSK2033 to inhibit the liver X receptor (LXR), and NF449, a Gsα-selective antagonist that can inhibit the downstream signaling of the TGR5 receptor. LCA-mediated reduction in NRF2 protein expression was blocked by NF449 and CINPA1, while the other inhibitors (GSK2033 and DY268) were ineffective (Figure 9A).
The pharmacological experiments above were complemented by siRNA depletion experiments.
Other possible LCA receptors, including the vitamin D receptor (VDR) and the pregnane X receptor (PXR), were also assessed. To provide a comprehensive view, we silenced TGR5, CAR, VDR, and PXR in MCF7 cells. Silencing of TGR5 and CAR efficiently blocked the LCA-induced decreases in NRF2 protein (Figure 9B,C), similarly to the pharmacological agents. Silencing of VDR and PXR receptor did not affect LCA-mediated reduction of NRF2 protein levels (Figure 9B). Next, we assessed iNOS protein level after silencing of TGR5 and CAR receptors. Silencing of either TGR5 or CAR receptors blunted the LCA-induced decrease in NRF2 and increased iNOS expression (Figure 9C).
These data indicate that LCA exerts its effects through the TGR5 receptor and CAR receptor.
Figure 8.Primary bile acids did not affect the proliferation of 4T1 breast cancer cells. The 4T1 cells were treated with CA and CDCA in the concentrations indicated for 48 h, then total protein concentrations were determined by sulforhodamine B assay (n=4). Data are plotted as mean±SEM. (CA, cholic acid;
CDCA, chenodeoxycholic acid).
The pharmacological experiments above were complemented by siRNA depletion experiments.
Other possible LCA receptors, including the vitamin D receptor (VDR) and the pregnane X receptor (PXR), were also assessed. To provide a comprehensive view, we silenced TGR5, CAR, VDR, and PXR in MCF7 cells. Silencing of TGR5 and CAR efficiently blocked the LCA-induced decreases in NRF2 protein (Figure9B,C), similarly to the pharmacological agents. Silencing of VDR and PXR receptor did not affect LCA-mediated reduction of NRF2 protein levels (Figure9B). Next, we assessed iNOS protein level after silencing of TGR5 and CAR receptors. Silencing of either TGR5 or CAR receptors blunted the LCA-induced decrease in NRF2 and increased iNOS expression (Figure9C). These data indicate that LCA exerts its effects through the TGR5 receptor and CAR receptor.
3.4. LCA Supplementation Suppressed Antioxidant Defense in an Animal Model of Breast Cancer
As a next step, we assessed whether the supplementation of LCA could hamper the redox status of tumors in an in vivo setting. We re-analyzed samples from a previous study we published [19].
In that study, we grafted Balb/c female mice with 4T1 cells and supplemented mice orally with 15 nmol LCA daily for two weeks. At the end of the study, mice were sacrificed and tumors were harvested.
In the previous study [19], we showed that LCA supplementation in vivo inhibits tumor growth, metastasis formation, epithelial-to-mesenchymal transition, and bioenergetic changes [19]. These findings are supported by patient observation and wet chemistry experiments that have been carried out by others [59–61].
Cancers2019,11, 1255 14 of 31
Cancers 2019, 11, x 14 of 31
Figure 9. LCA-induced oxidative stress responses were mediated by TGR5 and by CAR receptors. (A) The 4T1 cells were treated with 0.3 µm LCA and NF449, CINPA1, DY268, or GSK2033 at a final concentration of 5 µm for 48 h, then NRF2 protein expression was detected using western blotting (representative figure, n = 2). (B,C) TGR5, CAR, VDR, and PXR bile acid receptors were silenced in MCF7 cells by transiently transfecting the cells with the corresponding siRNA or a negative control siRNA. After 48 h, protein expressions of (B,C) NRF2 and (C) iNOS were determined by western blotting (n = 3). Data are plotted as mean ± SEM. * p < 0.05, control vs. LCA/siRNA treated. (CAR, constitutive androstane receptor; FXR, farnesoid X-activated receptor; LCA, lithocholic acid; LXR, liver X nuclear receptor; NRF2, nuclear factor, erythroid 2-like 2; TGR5/GPBAR1, G protein-coupled bile acid receptor 1/Takeda G-protein coupled receptor; VDR, vitamin D receptor).
3.4. LCA Supplementation Suppressed Antioxidant Defense in an Animal Model of Breast Cancer
As a next step, we assessed whether the supplementation of LCA could hamper the redox status of tumors in an in vivo setting. We re-analyzed samples from a previous study we published [19]. In that study, we grafted Balb/c female mice with 4T1 cells and supplemented mice orally with 15 nmol LCA daily for two weeks. At the end of the study, mice were sacrificed and tumors were harvested.
In the previous study [19], we showed that LCA supplementation in vivo inhibits tumor growth, metastasis formation, epithelial-to-mesenchymal transition, and bioenergetic changes [19]. These findings are supported by patient observation and wet chemistry experiments that have been carried out by others [59–61].
In the tumors of control and LCA-treated mice, we assessed the expression of anti- and pro- oxidant genes. LCA supplementation reduced the expression of NRF2 and a set of antioxidant genes:
catalase (CAT), glutamate–cysteine ligase catalytic subunit (GCLC), glutathione peroxidase 2 (GPX2), glutathione peroxidase 3 (GPX3), heme oxygenase 1 (HMOX1), inducible NO synthase (iNOS), NADPH oxidase 4 (NOX4), NAD(P)H quinone dehydrogenase 1 (NQO1), nuclear factor, erythroid 2-like 2 (NRF2), superoxide dismutase 1 (SOD1), superoxide dismutase 2 (SOD2), and superoxide dismutase 3 (SOD3) (Figure 10A). Furthermore, we observed a non-significant increase in iNOS and
Figure 9. LCA-induced oxidative stress responses were mediated by TGR5 and by CAR receptors.
(A) The 4T1 cells were treated with 0.3µm LCA and NF449, CINPA1, DY268, or GSK2033 at a final concentration of 5µm for 48 h, then NRF2 protein expression was detected using western blotting (representative figure,n=2). (B,C) TGR5, CAR, VDR, and PXR bile acid receptors were silenced in MCF7 cells by transiently transfecting the cells with the corresponding siRNA or a negative control siRNA. After 48 h, protein expressions of (B,C) NRF2 and (C) iNOS were determined by western blotting (n=3). Data are plotted as mean±SEM. *p<0.05, control vs. LCA/siRNA treated. (CAR, constitutive androstane receptor; FXR, farnesoid X-activated receptor; LCA, lithocholic acid; LXR, liver X nuclear receptor; NRF2, nuclear factor, erythroid 2-like 2; TGR5/GPBAR1, G protein-coupled bile acid receptor 1/Takeda G-protein coupled receptor; VDR, vitamin D receptor).
In the tumors of control and LCA-treated mice, we assessed the expression of anti- and pro-oxidant genes. LCA supplementation reduced the expression of NRF2 and a set of antioxidant genes: catalase (CAT), glutamate–cysteine ligase catalytic subunit (GCLC), glutathione peroxidase 2 (GPX2), glutathione peroxidase 3 (GPX3), heme oxygenase 1 (HMOX1), inducible NO synthase (iNOS), NADPH oxidase 4 (NOX4), NAD(P)H quinone dehydrogenase 1 (NQO1), nuclear factor, erythroid 2-like 2 (NRF2), superoxide dismutase 1 (SOD1), superoxide dismutase 2 (SOD2), and superoxide dismutase 3 (SOD3) (Figure10A). Furthermore, we observed a non-significant increase in iNOS and NOX4 expression in the LCA-treated mice (Figure10B). These results suggest that LCA can exert its activity on the redox balance of cancer cells in vivo, with beneficial effects for the outcome of the disease.
Cancers2019,11, 1255 15 of 31
Cancers 2019, 11, x 15 of 31
NOX4 expression in the LCA-treated mice (Figure 10B). These results suggest that LCA can exert its activity on the redox balance of cancer cells in vivo, with beneficial effects for the outcome of the disease.
Figure 10. LCA modulated the expression level of antioxidant and pro-oxidant genes in vivo. (A,B) Female Balb/c mice were grafted with 4T1 cells and treated with LCA (15 nmol q.d. p.o.) or vehicle (VEH) (n = 5/5) for 18 days. The mRNA expression levels of the indicated genes were determined in tumors using RT-qPCR. Error is depicted as SEM. * indicates statistically significant differences between vehicle and treated groups at p < 0.05. (CAT, catalase; GCLC, glutamate–cysteine ligase catalytic subunit; GPX2, glutathione peroxidase 2; GPX3, glutathione peroxidase 3; HMOX1, heme oxygenase 1; iNOS, inducible NO synthase; NOX4, NADPH oxidase 4; NQO1, NAD(P)H quinone dehydrogenase 1; NRF2, nuclear factor, erythroid 2-like 2; SOD1, superoxide dismutase 1; SOD2, superoxide dismutase 2; SOD3, superoxide dismutase 3).
3.5. Elements of the LCA-Elicited Anticancer Pathway Correlated with Stage, Grade, and Receptor Status of the Disease
We assessed the expression of the LCA-elicited oxidative/nitrosative stress markers (TGR5, iNOS, and 4HNE) using a tissue microarray (TMA) made up of tumor samples from 88 breast cancer
Figure 10. LCA modulated the expression level of antioxidant and pro-oxidant genes in vivo.
(A,B) Female Balb/c mice were grafted with 4T1 cells and treated with LCA (15 nmol q.d. p.o.) or vehicle (VEH) (n=5/5) for 18 days. The mRNA expression levels of the indicated genes were determined in tumors using RT-qPCR. Error is depicted as SEM. * indicates statistically significant differences between vehicle and treated groups atp<0.05. (CAT, catalase; GCLC, glutamate–cysteine ligase catalytic subunit; GPX2, glutathione peroxidase 2; GPX3, glutathione peroxidase 3; HMOX1, heme oxygenase 1; iNOS, inducible NO synthase; NOX4, NADPH oxidase 4; NQO1, NAD(P)H quinone dehydrogenase 1; NRF2, nuclear factor, erythroid 2-like 2; SOD1, superoxide dismutase 1; SOD2, superoxide dismutase 2; SOD3, superoxide dismutase 3).
3.5. Elements of the LCA-Elicited Anticancer Pathway Correlated with Stage, Grade, and Receptor Status of the Disease
We assessed the expression of the LCA-elicited oxidative/nitrosative stress markers (TGR5, iNOS, and 4HNE) using a tissue microarray (TMA) made up of tumor samples from 88 breast cancer patients. In parallel, we assessed the available public expression databases, GEO Profiles (https://www.ncbi.nlm.nih.gov/geoprofiles/) and kmplot.com [50]. The typical staining pattern of the antibodies is shown in Figure11.
Cancers2019,11, 1255 16 of 31
Cancers 2019, 11, x 16 of 31
patients. In parallel, we assessed the available public expression databases, GEO Profiles (https://www.ncbi.nlm.nih.gov/geoprofiles/) and kmplot.com [50]. The typical staining pattern of the antibodies is shown in Figure 11.
iNOS 4-HNE
TGR5
Figure 11. Staining pattern of the antibodies used in the study. Breast cancer specimens in a TMA were stained with the antibodies indicated, and the immune reactions were developed using DAB.
The black line indicates 50 µm.
First, we stratified patients for the TMA based on disease stage from stage I to stage IV, based on the primary tumor size, the lymph node involvement, and distant metastasis (as in Reference [27]).
In our previous study [19], we showed that LCA production by the gut microbiome decreased in breast cancer and that the capability of the microbiome to synthesize LCA correlated with the disease stage. Levels of iNOS and 4HNE decreased in stage II and stage III patients compared to stage I patients and further decreased in stage IV patients (Figure 12A).
Next, we stratified patients based on the pathological grade (Nottingham grade) of the disease.
4HNE expression significantly decreased in grade II and grade III patients compared to grade I patients (Figure 12B). In line with that, high expression of KEAP1 was associated with better survival for grade II patients, and high CAR expression was associated with better survival for grade III patients (Table 4).
We also stratified patients as triple negative (TNBC; ER− PR− HER2−) or ER+ cases. The expression of TGR5, iNOS, and 4HNE decreased in TNBC cases as compared to ER+ cases (Figure 12C). In line with that, higher expression of CAR, KEAP1, iNOS, nNOS, and NOX4 or lower expression of NRF2 was associated with better survival when we assessed all patients or ER+ positive cases, but not TNBC cases (Figure 13, Tables 4 and 5).
Finally, we grouped patients as a function of the mitosis score. Staining for 4HNE, the most direct indicator of tissue oxidative stress, decreased as mitosis score increased (Figure 12D).
Furthermore, 4HNE staining showed a strong negative correlation with the mitosis index (Figure 12E).
Figure 11.Staining pattern of the antibodies used in the study. Breast cancer specimens in a TMA were stained with the antibodies indicated, and the immune reactions were developed using DAB. The black line indicates 50µm.
First, we stratified patients for the TMA based on disease stage from stage I to stage IV, based on the primary tumor size, the lymph node involvement, and distant metastasis (as in Reference [27]).
In our previous study [19], we showed that LCA production by the gut microbiome decreased in breast cancer and that the capability of the microbiome to synthesize LCA correlated with the disease stage.
Levels of iNOS and 4HNE decreased in stage II and stage III patients compared to stage I patients and further decreased in stage IV patients (Figure12A).
Next, we stratified patients based on the pathological grade (Nottingham grade) of the disease.
4HNE expression significantly decreased in grade II and grade III patients compared to grade I patients (Figure12B). In line with that, high expression of KEAP1 was associated with better survival for grade II patients, and high CAR expression was associated with better survival for grade III patients (Table4).
We also stratified patients as triple negative (TNBC; ER−PR− HER2−) or ER+ cases. The expression of TGR5, iNOS, and 4HNE decreased in TNBC cases as compared to ER+cases (Figure12C).
In line with that, higher expression ofCAR,KEAP1,iNOS,nNOS,andNOX4or lower expression of NRF2was associated with better survival when we assessed all patients or ER+positive cases, but not TNBC cases (Figure13, Tables4and5).
Finally, we grouped patients as a function of the mitosis score. Staining for 4HNE, the most direct indicator of tissue oxidative stress, decreased as mitosis score increased (Figure12D). Furthermore, 4HNE staining showed a strong negative correlation with the mitosis index (Figure12E).
Taken together, LCA-elicited oxidative stress correlated well with the mitotic rate in breast cancer.
Furthermore, the LCA-elicited cytostatic system was hampered at higher breast cancer stages, higher grade carcinomas, or in TNBC cases that had a poor prognosis. In line with that, we identified cases in the TMA study where the staining for iNOS was well-maintained in the surrounding healthy breast tissue, but was lost in the cancerous tissues, or when NRF2 expression was upregulated in the cancerous
Cancers2019,11, 1255 17 of 31
tissue as compared to the neighboring healthy tissue. Further supporting our observations, we found a dataset in the GEO database [62] in which the expression of TGR5 receptor was shown to be lower in ductal in situ (DCIS) cases compared to control, healthy breast tissue.
Cancers 2019, 11, x 17 of 31
Taken together, LCA-elicited oxidative stress correlated well with the mitotic rate in breast cancer. Furthermore, the LCA-elicited cytostatic system was hampered at higher breast cancer stages, higher grade carcinomas, or in TNBC cases that had a poor prognosis. In line with that, we identified cases in the TMA study where the staining for iNOS was well-maintained in the surrounding healthy breast tissue, but was lost in the cancerous tissues, or when NRF2 expression was upregulated in the cancerous tissue as compared to the neighboring healthy tissue. Further supporting our observations, we found a dataset in the GEO database [62] in which the expression of TGR5 receptor was shown to be lower in ductal in situ (DCIS) cases compared to control, healthy breast tissue.
Figure 12. LCA-induced oxidative stress pathway is protective in human breast cancer. (A–D) The expression levels of oxidative/nitrosative stress markers were analyzed in tumor samples of 88 breast cancer patients using tissue microarray (TMA), as indicated on the graphs. (A) Patients were stratified based on disease stage (Stage I–IV), (B) pathological grade of the disease (Grade 1–3), (C) ER+ vs.
TNBC cases, and (D) mitosis score (mitosis score 1–3), and the expression level of indicated markers were determined using IHC analysis. (E) Linear regressionanalyses for the correlation between 4HNE expression levels and the mitotic index were determined using R project. TGR5: Pearson r =
−0.13; p = 0.26; iNOS: Pearson r = −0.16; p = 0.16; 4HNE: Pearson r = −0.34; p = 0.0025. Line represents linear regression of data (TGR5: y = 25 − 3x; iNOS: y = 38 − 4.7x; 4HNE: y = 78 − 7x). *, **, and ***
indicate p < 0.05, p < 0.01 or p < 0.001, differences between patient groups. (TGR5/GPBAR1, G protein- coupled bile acid receptor 1/Takeda G-protein coupled receptor; 4HNE, 4-hydroxynonenal).
Figure 12.LCA-induced oxidative stress pathway is protective in human breast cancer. (A–D) The expression levels of oxidative/nitrosative stress markers were analyzed in tumor samples of 88 breast cancer patients using tissue microarray (TMA), as indicated on the graphs. (A) Patients were stratified based on disease stage (Stage I–IV), (B) pathological grade of the disease (Grade 1–3), (C) ER+vs.
TNBC cases, and (D) mitosis score (mitosis score 1–3), and the expression level of indicated markers were determined using IHC analysis. (E) Linear regression analyses for the correlation between 4HNE expression levels and the mitotic index were determined using R project. TGR5: Pearson r=−0.13;
p=0.26; iNOS: Pearson r=−0.16;p=0.16; 4HNE: Pearson r=−0.34;p=0.0025. Line represents linear regression of data (TGR5: y=25−3x; iNOS: y=38−4.7x; 4HNE: y=78−7x). *, **, and *** indicate p<0.05,p<0.01 orp<0.001, differences between patient groups. (TGR5/GPBAR1, G protein-coupled bile acid receptor 1/Takeda G-protein coupled receptor; 4HNE, 4-hydroxynonenal).
Cancers2019,11, 1255 18 of 31
Cancers 2019, 11, x 18 of 31
Figure 13. The components of the LCA–TGR/CAR pathway are protective in human breast cancer. The impact of CAR, TGR5, NRF2, KEAP1, iNOS, nNOS, and NOX4 expression on survival in breast cancer patients was evaluated by assessing the kmplot.com database. All cancers, ER+, and triple negative cases were analyzed. The ER+ population also included those patients where ER status was derived from gene expression data. Triple negative cases included patients with ER− status (including those patients where ER status was derived from gene expression data), PR− status, and HER2− status. The red line indicates high expression while the black line indicates low expression. Probe IDs, numbers at risk, and hazard ratios are collected in Table 5. nNOS(a) represents 207309_at probe id, while nNOS(b) represents 207310_at probe set. * indicates that grade 1 patients are depicted. (CAR, constitutive androstane receptor; ER, estrogen receptor; KEAP1, Kelch- like ECH associating protein 1; NOX4, NADPH oxidase 4; NRF2, nuclear factor, erythroid 2-like 2; TGR5/GPBAR1, G protein-coupled bile acid receptor 1/Takeda G-protein coupled receptor; iNOS, inducible nitric oxide synthase; nNOS, neuronal nitric oxide synthase).
Figure 13.The components of the LCA–TGR/CAR pathway are protective in human breast cancer. The impact ofCAR,TGR5,NRF2,KEAP1,iNOS,nNOS, andNOX4 expression on survival in breast cancer patients was evaluated by assessing the kmplot.com database. All cancers, ER+, and triple negative cases were analyzed.
The ER+population also included those patients where ER status was derived from gene expression data. Triple negative cases included patients with ER−status (including those patients where ER status was derived from gene expression data), PR−status, and HER2−status. The red line indicates high expression while the black line indicates low expression. Probe IDs, numbers at risk, and hazard ratios are collected in Table5. nNOS(a) represents 207309_at probe id, whilenNOS(b) represents 207310_at probe set. * indicates that grade 1 patients are depicted. (CAR, constitutive androstane receptor; ER, estrogen receptor; KEAP1, Kelch-like ECH associating protein 1; NOX4, NADPH oxidase 4; NRF2, nuclear factor, erythroid 2-like 2; TGR5/GPBAR1, G protein-coupled bile acid receptor 1/Takeda G-protein coupled receptor; iNOS, inducible nitric oxide synthase; nNOS, neuronal nitric oxide synthase).
Cancers2019,11, 1255 19 of 31
Table 4.Connection between iNOS, nNOS, TGR5, CAR, NRF2, and breast cancer patient survival. Bold numbers represent statistically significant results.
CAR (207007_a_at) HR (Hazard Ratio) p-Value (Log Rank Test)
All Breast Cancers, N=3951 0.7 3.00×10⁻¹⁰
Grade 1, N=345 1.15 0.61
Grade 2, N=901 0.88 0.3
Grade 3, N=903 0.72 0.0036
ER(+), N=3082 0.81 0.0013
ER(−), N=869 0.62 9.20×10⁻⁶
PR(+), N=589 0.72 0.063
PR(−), N=549 0.9 0.49
Lymph(+), N=1133 0.97 0.73
Lymph(−), N=2020 0.99 0.93
HER2(+), N=252 0.69 0.1
HER2(−), N=800 1.13 0.37
ER(+), PR(+), N=577 0.79 0.19
ER(+), PR(+), Lymph node (+),N=344 0.99 0.97
ER(+), PR(+), Lymph node (−),N=228 0.5 0.037
ER(−), PR(−), N=298 0.74 0.14
ER(−), PR(−), Lymph node(+),N=127 0.76 0.3
ER(−), PR(−), Lymph node(−),N=167 0.97 0.93
ER(−), PR(−), HER2(−),N=198 0.93 0.77
Basal subtype, N=618 0.68 0.0025
Luminal A, N=1933 0.76 0.0015
Luminal B, N=1149 0.77 0.0069
ER(+), HER2(+), N=156 1.21 0.53
ER(−), HER2(+), N=96 0.61 0.12
TGR5 (1552501_at) HR (Hazard Ratio) p-Value (Log Rank Test)
All Breast Cancers, N=3951 0.91 0.25
Grade 1, N=345 0.41 0.12
Grade 2, N=901 1.21 0.46
Grade 3, N=903 0.77 0.1
ER(+), N=3082 1 0.98
ER(−), N=869 0.74 0.025
PR(+), N=589 1.21 0.33
PR(−), N=549 0.96 0.81
Lymph(+), N=1133 0.98 0.9
Lymph(−), N=2020 0.91 0.61
HER2(+), N=252 1.12 0.68
HER2(−), N=800 0.91 0.51
ER(+), PR(+), N=577 1.18 0.4
ER(+), PR(+), Lymph node(+),N=344 1.39 0.19
ER(+), PR(+), Lymph node(−),N=228 0.76 0.4
ER(−), PR(−), N=298 0.96 0.86
ER(−), PR(−), Lymph node(+),N=127 0.96 0.89
ER(−), PR(−), Lymph node(−),N=167 1.25 0.61
ER(−), PR(−), HER2(−),N=198 0.9 0.73
Basal subtype, N=618 0.79 0.15
Luminal A, N=1933 1.1 0.44
Luminal B, N=1149 0.83 0.24
ER(+), HER2(+), N=156 1.07 0.88
ER(−), HER2(+), N=96 0.94 0.86
Cancers2019,11, 1255 20 of 31
Table 4.Cont.
NRF2 (201145_at) HR (Hazard Ratio) p-Value (Log Rank Test)
All Breast Cancers, N=3951 1.23 2.00×10⁻⁴
Grade 1, N=345 1.1 0.72
Grade 2, N=901 0.87 0.25
Grade 3, N=903 1.06 0.63
ER(+), N=3082 1.27 2.40×10⁻⁴
ER(−), N=869 1.04 0.71
PR(+), N=589 1.23 0.24
PR(−), N=549 1.49 0.0075
Lymph(+), N=1133 1.14 0.21
Lymph(−), N=2020 1.11 0.21
HER2(+), N=252 1.32 0.21
HER2(−), N=800 1.34 0.031
ER(+), PR(+), N=577 1.27 0.19
ER(+), PR(+), Lymph node(+),N=344 1.08 0.71
ER(+), PR(+), Lymph node(−),N=228 1.96 0.051
ER(−), PR(−), N=298 1.01 0.95
ER(−), PR(−), Lymph node(+),N=127 1.23 0.45
ER(−), PR(−), Lymph node(−),N=167 0.93 0.8
ER(−), PR(−), HER2(−),N=198 0.9 0.66
Basal subtype, N=618 1.01 0.95
Luminal A, N=1933 1.33 0.0011
Luminal B, N=1149 1.26 0.017
ER(+), HER2(+), N=156 1.69 0.097
ER(−), HER2(+), N=96 1.26 0.47
KEAP1 (202417_at) HR (Hazard Ratio) p-Value (Log Rank Test)
All Breast Cancers, N=3951 0.84 0.0015
Grade 1, N=345 0.98 0.94
Grade 2, N=901 0.73 0.012
Grade 3, N=903 0.93 0.54
ER(+), N=3082 0.89 0.06
ER(−), N=869 0.92 0.41
PR(+), N=589 1.09 0.64
PR(−), N=549 0.91 0.55
Lymph(+), N=1133 0.76 0.006
Lymph(−), N=2020 0.98 0.83
HER2(+), N=252 1.14 0.57
HER2(−), N=800 0.92 0.55
ER(+), PR(+), N=577 1.06 0.76
ER(+), PR(+), Lymph node(+),N=344 0.98 0.91
ER(+), PR(+), Lymph node(−),N=228 1.38 0.33
ER(−), PR(−), N=298 0.95 0.82
ER(−), PR(−), Lymph node(+),N=127 1 1
ER(−), PR(−), Lymph node(−),N=167 1.12 0.72
ER(−), PR(−), HER2(−),N=198 1.07 0.8
Basal subtype, N=618 1 0.98
Luminal A, N=1933 0.9 0.24
Luminal B, N=1149 0.91 0.36
ER(+), HER2(+), N=156 0.89 0.7
ER(−), HER2(+), N=96 1.18 0.61