ONCOGENE DEPENDENT REGULATION OF MIGRATION AND PROLIFERATION IN HUMAN
TUMOR CELLS
PhD Thesis
Tamás M. Garay
Pathological Sciences Doctoral School Semmelweis University
Supervisor: Dr. Balázs Hegedűs Ph.D
Official reviewers:
Dr. László Kőhidai MD, D.Sc Dr. Ferhan Ayaydin Ph.D
Head of the Final Examination Committee:
Dr. Lídia Sréter MD, D.Sc
Members of the Final Examination Committee:
Dr. Balázs Sarkadi MD, D.Sc Dr. László Herszényi MD, Ph.D
“Our washing up is just like our language. We have dirty water and dirty dishcloths, and yet we manage to get the plates and glasses clean.”
Niels Bohr in Werner Heisenberg’s The Part and the Whole
TABLE OF CONTENTS
ABBREVIATIONS... 5
1. INTRODUCTION... 8
1.1. Migration and proliferation of tumor cells... 8
1.1.1. Invasive growth and metastasis are critical factors in tumor progression... 8
1.1.2. State-of-the-art measurement of proliferation and growth in cell cultures in vitro10 1.1.3. In vitro experimental models of migration in 2D and 3D tumor cell cultures ... 12
1.1.4. Connection between cell proliferation and cell migration – the “go or grow” hypothesis... 14
1.2. Molecular pathways controlling migration and proliferation ... 16
1.2.1. Overview of polypeptide growth factors controlling cell migration and proliferation... 16
1.2.2. The EGF and FGF2 activated receptor tyrosine kinase pathways ... 19
1.2.3. Activin-activated receptor protein serine/threonine kinase signal transduction .... 23
1.3. Targeted inhibition of GF pathways controlling migration and proliferation... 25
1.3.1. Molecularly targeted inhibition of cancer treatment in clinical practice ... 25
3.3.2 Novel molecular targets in development... 29
2. OBJECTIVES ... 32
3. METHODS... 34
3.1. Cell cultures... 34
3.2. Collagen invasion assay ... 37
3.3. Analysis of oncogenic mutation in melanoma cells... 38
3.4. Investigation of expressed GFRs - qRT-PCR for EGFR, FGF1-4 receptor expression 39 3.5. Videomicroscopy ... 39
3.6. Cell migration analysis... 40
3.7. Videomicroscopy based proliferation and cytokinesis analysis... 41
3.8. Single cell based correlation analysis... 41
3.9. SRB proliferation assay... 42
3.10. TUNEL assay ... 43
3.11. Immunoblot measurements ... 43
3.12. In vivo experiments... 44
4. RESULTS... 46
4.1. Migration/proliferation dichotomy in 2D cell cultures ... 46
4.2. Proliferation and migration in 3D cell cultures... 54
4.3. Major oncogenic mutations in melanomas... 56
4.4. Ligand dependent activation of EGFR and FGFR in melanoma ... 56
4.5. Inhibition of EGFR and FGFR in melanoma ... 64
4.6. Oncogenic mutation-dependent prenylation inhibition response in melanoma ... 66
4.7. Modulation of the activin signaling in mesothelioma... 72
5. DISCUSSION ... 76
5.1 The migration/proliferation dichotomy in cancer ... 76
5.2 Proliferation independent invasion... 78
5.3 Oncogenic mutation-dependent response to EGFR-FGFR signaling ... 79
5.4 Selective growth inhibition of zoledronic acid in NRAS mutant melanoma... 81
5.5 Activation and inhibition of activin signaling in mesothelioma ... 82
6. CONCLUSIONS... 84
7. SUMMARY ... 85
8. ÖSSZEFOGLALÁS... 86
REFERENCES... 87
LIST OF PUBLICATIONS ... 116
Publications related to the thesis ... 116
Publications not related to the thesis ... 116
ACKNOWLEDGEMENTS ... 117
ABBREVIATIONS
ANOVA – analysis of variance AR – amphiregulin
ARIA – acetylcholine receptor-inducing activity ATP – adenosine 5’-triphosphate
BMP – bone morphogenetic protein
BRAF/Braf – oncogen/protein; v-raf (viral rapidly accelerated fibrosarcoma) murine sarcoma viral oncogene homolog B1
BrdU – 5-bromo-2’-deoxiuridine BTC – betacellulin
CDM – cell-derived matrix
CREB – cyclic AMP response element-binding protein CPE – carboxypeptidase E
DAG – diacylglycerol
DMEM – Dulbecco's Modified Eagle's Medium DNA – deoxyribonucleic acid
EGF / EGFR – epidermal growth factor / epidermal growth factor receptor EMT – epithelial-to-mesenchymal transition
ECM – extracellular matrix EPR – epiregulin
ErbB – named after similarity to avian erythroblastosis oncogene B ERK – extracellular signal pathway regulated kinase
FCS – fetal calf serum
FDA – Food and Drug Administration
FGF / FGFR – fibroblast growth factor / fibroblast growth factor receptor FGF2 / bFGF – basic fibroblast growth factor
FHF – FGF homologous factors FTI – farnesyl transferase inhibitor GAP – GTPase activating proteins
GEF – guanine nucleotide exchange factor
GF / GFR – growth factor / growth factor receptor
HB-EGF – heparin-binding EGF-like growth factor HER – human epidermal growth factor receptor HGF – hepatocyte growth factor
HRG – heregulin
IGF – insulin-like growth factor IGFBP – IGF binding proteins IP3 – inositol 1,4,5-triphosphate
MAP – mitogen-activated protein kinase
MTT – 3-(4,5-dimethylthiazol-2-yl)-2,5-diphenyltetrazolium bromide NDF – Neu differentiation factor
NP – neuropilin
NF1 – neurofibromin 1
NOD (mice) – non-obese diabetic (mice)
NRAS/Nras – oncogen/protein; neuroblastoma v-ras (viral rat sarcoma) oncogene homolog NRG – neuregulin
NSG (mice) – NOD scid gamma (mice) PAGE – polyacrylamide gel electrophoresis PCR – polymerase chain reaction
PDG / PDGFR – platelet derived growth factor / platelet derived growth factor receptor PFA – paraformaldehyde
PKC – protein kinase C PI3 – – phosphatidylinositide 3
PI3K – phosphatidylinositide 3-kinase
PIGF – phosphatidylinositol-glycan biosynthesis class F protein PIP2 – phosphatidylinositol 4,5 biphosphate
PIP3 – phosphatidylinositol (3,4,5)-triphosphate PLC-γ – phospholipase C gamma
qRT-PCR – quantitative real-time PCR
RFLP – restriction fragment length polymorphism RNA – ribonucleic acid
SARA – Smad anchor for receptor activation SCID – severe combined immunodeficiency SDS –sodium dodecyl sulfate
SDS-PAGE–sodium dodecyl sulfate-polyacrylamide gel electrophoresis SF – scatter factor (also named HGF)
sFRP – soluble Frizzled-related proteins SRB – sulforhodamine B
TGFα – transforming growth factor-α TGFβ – transforming growth factor-β
TUNEL (assay)– terminal deoxynucleotidyl transferase dUTP nick end labeling (assay)
VEGF / VEGFR – vascular endothelial growth factor / vascular endothelial growth factor receptor
ZA – zoledronic acid
1. INTRODUCTION
Most of the solid tumors have a steadily growing incidence and, in the majority of cases, not primary tumor growth but distant metastases are the main cause of death. Metastasis formation is a complex process that requires a spatiotemporal regulation of cell adhesion, cell proliferation and cell migration. The available various anticancer treatment modalities often interact with different cellular targets, thus, these modalities can exert differential effects on tumor stroma, extracellular matrix (ECM) or on tumor cell death, proliferation and migration.
Additionally, anticancer therapies often influence the most important regulatory mechanisms, including the various growth factor (GF) and TGF signaling pathways.
First, the connection between cell proliferation and cell division will be studied including the role of oncogenic signaling in these processes. Next, the migratory and proliferative effects of the activation of oncogenic pathways will be described. Finally, the consequence of the targeted inhibition of these pathways will be investigated.
1.1. Migration and proliferation of tumor cells
1.1.1. Invasive growth and metastasis are critical factors in tumor progression
Tumor progression is the phenomenon when tumors gain a more "malignant" and aggressive phenotype during their life time (Foulds 1957). A critical component of tumor progression is the formation of tumors distant from the primary tumor – namely metastasis – that have enormous clinical importance as they are responsible for the lethal outcome in up to 90% of cases (Sporn 1996; Hanahan and Weinberg 2000).
The study of stepwise progression of tumors, including metastasis formation is of outmost importance both at the morphological as well as at the genetic level. Nevertheless, differences and similarities between primary lesions and metastases have been in the focus of research since the end of the 19th century (Magruder 1888; Gibbes 1889). The very early findings, namely that particular tumors would give metastasis with a great probability to certain organs,
hypothesis (Paget 1889) and Ewing’s mechanical/anatomical theory (Ewing 1922). Paget hypothesized that metastasis formation would require both a malignant cell being able to survive in the given distant microenvironment (“seed”) and a permissive microenvironment (“soil”) (Paget 1889). This hypothesis could explain bone metastases of renal and prostate cancers since both tumors can readily express bone matrix proteins (Cooper et al. 2000;
Weber et al. 2007). Ewing’s mechanical/anatomical theory predicts that the first metastatic foci would develop in the filtering organ (Ewing 1922) which is evident in colorectal cancer and its corresponding liver metastasis as well as in lower rectal/anal cancers and their lung metastases (Mack and Marshall 2010; Kovacs et al. 2013).
Based on the growing knowledge on genetic events related to tumor progression, two major models have emerged describing the genetic similarities and differences between primary tumor and metastasis: the “linear progression” and “parallel progression” model. The “linear progression model” suggests that cancer cell dissemination occurs after extensive expansion of primary tumors having a huge number of shared genetic alterations between the primary tumor and metastasis. In contrast, the “parallel progression model” claims early tumor cell dissemination of small tumors (even smaller than the threshold for tumor detection), which is supported by cases where a large number of genetic differences exist between primary tumor and metastasis (Mack and Marshall 2010; van Zijl et al. 2011). Considering these two models, one of the most relevant questions is not whether metastasis formation is an early or late event in tumor progression, but more importantly, whether evolution of malignant cells occurs inside or outside the primary lesion (Klein 2008).
Regardless, metastasis formation can be described as a cascade or a multi-step process encompassing (I) invasion of tumor cells in the surrounding tissue, (II) intravasation – the entering of tumor cells into the lumen of blood or lymphatic vessels, (III) surviving the rigors of the circulatory system, (IV) extravasation – the arrest at distant organ sites and invasion into the parenchyma of distant tissues, and finally, (V) surviving the foreign microenvironment and forming colonies of tumor cells (Liotta 1986). Each step of the metastatic cascade is very selective, therefore, as little as 0.1% or even less of the disseminated cancer cells could successfully develop a distal metastasis (Fidler 1970; Yoshida et al. 1993; Mack and Marshall 2010).
Although there are different theories to elucidate the mechanism of tumor progression and metastasis formation, none of them can shed light on why cancer cells do proliferate and
control of proliferation and apoptosis. This would enable not only excessive tumor growth but – more importantly – provide the opportunity to accumulate additional alterations that impair regulatory mechanisms such as cell-cell and cell-matrix adhesion and migration. In cancers of epithelial origin, these alterations together lead to a transition from an epithelial to mesenchymal-like phenotype, often referred to as epithelial–mesenchymal transition (EMT)(Thiery 2002; Yamaguchi et al. 2005). Alterations and loss of intercellular junctions as well as (re)gain of a migratory phenotype are the pivotal and clinically by far the most important steps in tumor progression as this provides the capacity of cells to invade locally and to form metastases (Nowell 1986; Hanahan and Weinberg 2000).
1.1.2. State-of-the-art measurement of proliferation and growth in cell cultures in vitro
A number of experimental methods have been developed to study migration and proliferation since these are crucial cellular processes in tumor growth and progression. All of the available in vitro experimental methods aim to recapitulate certain aspects of the in vivo situation.
Although these methods do not entirely depict the in vivo situation, they provide a good and valuable model of it.
In-vitro-proliferation measurement of cells is often performed by quantitative evaluation of some bio-chemical activity of the living cells. Therefore the gathered data is in closer connection with cell viability than with actual proliferation. There are plenty of quick and well-reproducible assays using dyes that are converted by the metabolic capacity of the cells and the color development can be easily quantified using photometry (Vega-Avila and Pugsley 2011).
Resazurin (7-hydroxy-10-oxidophenoxazin-10-ium-3-one) or also called Alamar Blue assay, for example, − originally described by Pesch and Simmert in 1929 as a tool for showing disease-causative organism in milk − is based on the reduction of resazurin to resorufin and dihydro-resorufin in viable and metabolically active cells (Anoopkumar-Dukie et al. 2005). In microbiology, crystal violet (also known as Gentian violet, hexamethyl pararosaniline chloride or 4-[(4-dimethylaminophenyl)-phenyl-methyl]-N,N-dimethyl-aniline) was originally used to differentiate Gram-negative and positive bacteria but since it also binds to DNA contents of cells, it is used for quantifying cell density and proliferation in monolayer
cell cultures (Saotome et al. 1989; Itagaki et al. 1991; Chiba et al. 1998). In addition, BrdU (5-bromo-2’-deoxiuridine) is a synthetic nucleoside analog of the DNA precursor thymidine, which is incorporated into the newly synthesized DNA in proliferating cells (Hawker 2003).
In the neutral red assay, the uptake and accumulation of the neutral red dye in the lysosomes of uninjured cells is determined by colorimetric measurements (Borenfreund and Puerner 1985; Borenfreund et al. 1988). Among the proliferation assays, the most popular is probably the methylthiazol-tetrazolium (MTT) assay, which is based on the activity of succinic dehydrogenase reducing the yellow soluble MTT tetrazolium salt to a blue insoluble MTT formazan product after being taken up by the mitochondria (Mosmann 1983; Chiba et al.
1998; Wagner et al. 1999; Vega-Avila and Pugsley 2011). The sulforhodamine B (SRB) assay, developed by Skehan, measures the total protein content of the cells (it binds to basic amino-acid residues), and is even more sensitive and more reproducible than MTT assay (Skehan et al. 1990; Keepers et al. 1991). Nevertheless, there is a drawback of these aforementioned assays, namely that one has to assume that cells keep the same intensity in mitochondrial activity, protein accumulation or ploidy level/DNA content in response to treatment modalities and that the chemical parameters of the medium (pH, glucose concentration) are unaffected from the treatment (Jabbar et al. 1989; Vistica et al. 1991; Chiba et al. 1998; Vega-Avila and Pugsley 2011).
The clonogenic assay (2D colony formation assay or clonogenic cell survival assay) incorporates no such assumption but it is more time consuming than colorimetric assays (Vega-Avila and Pugsley 2011). The long duration of treatment, the metabolism of the treated cells and the stability of the active compound can result in a variation of the concentration of the substance. Additionally, many human cancer cell lines show low baseline clonogenic potential (Grenman et al. 1991). Cell proliferation and tumor growth in vitro can also be assessed in a more physiologically relevant three-dimensional set-up by evaluating the number and magnitude (diameter, cross section area) of 3D cell colonies, spheroids (Haji- Karim and Carlsson 1978; Kunz-Schughart et al. 1998). However, this method can only be applied in cell lines capable of sphere formation.
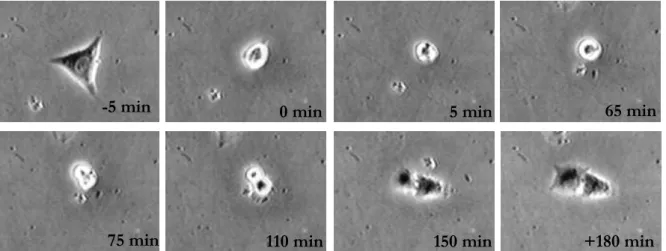
Considering all the available methods, one of the simplest and most unbiased ways to evaluate proliferation is to count the number of observed cell divisions. This is a more direct way to evaluate proliferation compared to the enzyme activity or total protein based assays and can be achieved by using time-lapse videomicroscopy (Teague et al. 1993; Hegedus et al.
2000; Wick et al. 2003; Hegedus et al. 2004). Therefore, this method was very often used - besides SRB assays - in most of the experiments presented in this thesis.
1.1.3. In vitro experimental models of migration in 2D and 3D tumor cell cultures
Structural and molecular determinants of both cellular migratory activity and tissue environment define the locomotion of cells in vivo. The cells locomotory activity is determined by intracellular processes including the reorganization of the cytoskeletal apparatus, the formation of pseudopodia and the allocation of energy (mainly in form of ATP) to the motion related processes such exerting force on the extracellular matrix. The tissue environment often represents a barrier for moving cells. To be able to migrate, cells need to restructure their 3D environment, for instance, by digesting the extracellular matrix (ECM) with the use of proteases.
Experimental models that can best recapitulate the in vivo situation are multicellular 3D models including heterotypic cell-cell and cell-matrix interactions. In these 3D models, cells are embedded into a biological matrix to establish platforms to investigate cell invasion, which inhere not only in cell migration but also in adhesion and proteolysis of ECM components (Hegedus et al. 2006; Kramer et al. 2013). The most complex biological matrices are cell-derived matrices (CDMs) such as the ECM of high density fibroblast cell cultures (Porter and Vanamee 1949; Bradbury et al. 2012). These CDMs are composed of fibronectin, collagen types I and II, heparin sulfate proteoglycans and hyaluronic acid in a proportion that is dependent of the particular cell culture (Kutys et al. 2013). More reproducible are the cell- line-derived basement membrane extracts such as Matrigel obtained from Engelberth-Holm- Swarm mouse sarcoma cells, which is composed of laminin, collagen IV isoforms and heparin sulfate proteoglycans (Kleinman et al. 1982; Benton et al. 2011). The major components of ECM are collagen and fibrin that are often used as single protein 3D matrix models. These fibrous gel matrices are suitable tools to study migratory events such as wound heeling or metastatic invasion (Benton et al. 2011; Bradbury et al. 2012), although they simplify the heterogeneous nature of ECM into a single component gel. Seemingly minor alterations in the protocol may cause significant changes in the properties of the gels. For instance, an increase in fiber concentration results in elevated mechanical strength and
decreased pore size of the gel or an increase in gelation temperature leads to decreased pore size and fibril diameter (McPherson et al. 1985; Miron-Mendoza et al. 2010). The experimental setups differ from each other in how cells are seeded in the matrix, which, in parallel, determines the direction of their migration and the method of evaluation. In 3D cell tracking assays, cells are seeded in the gel in a low density and the route of the cells through the matrix is tracked via automated microscopy and state–of-the-art image analysis (Hamilton 2009; Kramer et al. 2013). It is also possible to seed the cells as a layer on the surface of the gel (vertical gel invasion assay) or as a spheroid or aggregate in the gel (spheroid gel invasion assay) and to evaluate the migration of the cells from the seeded colony (Szabo et al. 2012;
Kramer et al. 2013).
Whereas 3D migration models are experimental tools for modeling the in vivo cell dynamics with high fidelity, 2D models are useful instruments to provide insights of molecular machineries underlying cell adhesion and migration (Friedl and Brocker 2000; Wolf et al.
2009). Of note, some of the migration assays can be applied as 2D or 3D experimental methods, as well. Optionally, different matrices can be used in micro-fluidic chamber assays (Meyvantsson and Beebe 2008) or in the platypus assay that is a modified cell exclusion assay (Hulkower and Herber 2011; Kramer et al. 2013). In Boyden chamber or transmembrane assays, the membrane can be covered with a matrix (Boyden 1962; Albini et al. 1987; Eccles et al. 2005). In the absence of external cues, cells show more or less random migration, which is the prevalent mode of migration for immune cells and metastatic cancer cells (Huth et al.
2010). However, in Boyden chambers or in micro-fluidic chamber assays, cells exert chemotactic migration along a gradient (Toetsch et al. 2009; Prummer et al. 2013). In micro- carrier bead assays and spheroid migration assays, cells are grown to 3D colonies either on beads or in non-adherent vessels and the outward movement of cells to an adherent surface from the 3D colonies is measured. Thus, these assays show some common aspects with 2D and 3D assay, as well (Kramer et al. 2013).
In classical 2D migration assays, cells are seeded in a particular place and are expected to migrate towards an empty area. In scratch assay, for example, the empty space is literally scratched in a confluent cell-layer (Liang et al. 2007). In cell excursion assays, cells migrate from the occupied periphery of the cell culture vessel to the central cell free area (Hulkower and Herber 2011). The advantage of this assay opposite to the similar scratch assay is that cell migration can be studied uncoupled from contributions of cell damage and permeabilization
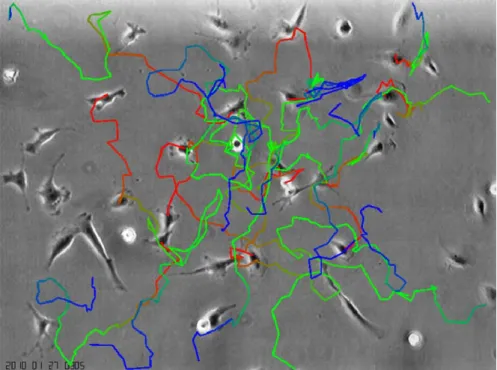
fence assay where, at seeding, a removable ring (=fence) is preventing cells to attach on the periphery of the vial (Pratt et al. 1984; Fischer et al. 1990). If seeding cells in a low confluence, individual cells will have the space and the opportunity to migrate. This migration can be tracked by videomicroscopy (Hegedus et al. 2000; Hegedus et al. 2004; Huth et al.
2010) or by coating the cell culture vial with substances (e.g. gold particles), and where the moving cells clear the substances on their way they leave a detectable route behind (colloidal particle assay) (Niinaka et al. 2001; Kramer et al. 2013). To further reduce the dimensions of cell cultures testing migration, it is worth mentioning that even 1D cell migration can be measured by seeding cells onto thin fibronectin lines that restrict the migration along this fibers (Maiuri et al. 2012). In this experimental setup, displacement of the cells could be best described as a 1D correlated random walk (Codling et al. 2008). In our investigations, random migration was measured in 2D via evaluation of videomicroscopy and invasion was observed in 3D by monitoring cells migrating outward from cell aggregates in collagen gel.
1.1.4. Connection between cell proliferation and cell migration – the “go or grow”
hypothesis
The connection between cell migration and cell proliferation is extensively studied since a fine adjustment and a temporal interplay between these two cellular processes are crucial for the metastatic potential of tumor cells. Based on experimental data and on the concept that cytoskeletal machinery cannot be used for proliferation and migration concurrently, the “go or grow” hypothesis - formulated for tumor cells - postulates that migration and cell division are mutually exclusive, and tumor cells defer proliferation for cell migration (Funk and Sage 1991; Giese et al. 1996; Schultz et al. 2002; Corcoran and Del Maestro 2003).
Numerous experiments on brain tumor cells support the “go or grow” hypothesis demonstrating that if proliferation is impaired migration is enhanced in cell populations or vice versa. In two dimensional cell cultures of glioma cells, TGF-β exerted a growth- inhibitory action and elicited migration and invasiveness (Merzak et al. 1994). Similarly, enhanced expression of soluble Frizzled-related proteins (sFRPs) inhibited the motility of glioma cells in vitro and increased their clonogenic potential in vitro and in vivo (Roth et al.
2000). Correspondingly in another study, glioma cells overexpressing carboxypeptidase E
(CPE) showed enhanced proliferation and decreased migratory activity (Horing et al. 2012).
In conventional 2D cultures of astrocytoma cells, impaired migration due to cell density or vitronectin coated surface resulted in higher proliferation (Giese et al. 1996). In line with the results measured in 2D, in 3D cultures of astrocytoma cells embedded in collagen gel, the gel- invading, active migrating cells detaching from the surface of the spheroids showed less proliferative activity as cells in the inner layer of the spheroids (Tamaki et al. 1997).
Similarly, no correlation was found between invasion and Ki-67 labeling in patient-derived short-time 3D cell cultures of intracranial tumor cells (Khoshyomn et al. 1999). Recently, two microRNAs have been identified in glioma cells that have a role in the regulation of proliferation and migration dichotomy. Lower glucose concentrations are linked to reduced miR-451 expression resulting in inhibition of proliferation and increase of migration (Godlewski et al. 2010). Contrariwise, reduced expression of miR-9 in the miR-9/CREB/NF1 signaling is linked to increased proliferation and decreased migration (Tan et al. 2012).
In contrast to the supporting findings, the “go or grow” hypothesis is challenged in several studies. In glioma cell spheroids, EGF treatment enhanced both migration and proliferation in vitro (Lund-Johansen et al. 1990). Similarly, the inhibition of EGFR resulted in the increase of both migration and proliferation in patient-derived short-time 3D glioblastoma cell cultures (Penar et al. 1997). In addition, hypericin reduced both migration and proliferation in glioma cells in vitro (Zhang et al. 1997). Of note, the “go or grow” hypothesis was directly tested using time-lapse videomicroscopy and Ki-67 labeling in four medulloblastoma cell lines but the hypothesis could not been confirmed (Corcoran and Del Maestro 2003).
In addition to experimental work, a number of mathematical models have been developed in order to study the cellular and molecular mechanisms being able to underline such a dichotomy (Fedotov and Iomin 2007; Wang et al. 2009; Bauer et al. 2010; Kim et al. 2011;
Hatzikirou et al. 2012). Some of the theoretical approaches using stochastic and probabilistic mathematical models could recapitulate similar behavior (Fedotov and Iomin 2007;
Hatzikirou et al. 2012), whereas others challenged certain aspects of the “go or grow”
hypothesis (Bauer et al. 2010).
Furthermore, from the structural point of view, the actin and microtubule cytoskeletal apparatus are used to maintain changes in cell shape and mitotic cell rounding during the cytokinetic phase of cell cycle. Consequently, the normal cytoskeletal apparatus should not be available for active cell migration during cell division (Paluch et al. 2005; Stewart et al.
form of ATP – resources (Czirók et al. 1998) would also support the mutual exclusiveness of these cellular processes.
The “go or grow” hypothesis is particularly important in the development of effective anti- cancer drugs that can also target the survival-prone subpopulation of tumor cells being able to escape from the primary tumor and survive in metastatic tissue microenvironment. If tumor cells defer cell proliferation for cell migration than migrating cells should have a decreased sensitivity to treatment modalities targeting the proliferating tumor cells. Thus, anti- proliferative therapies may unintentionally select for migratory cells or even induce cell migration in surviving cell populations. Furthermore, inhibition of cell migration might induce the proliferation of disseminating cells and lead to primary or secondary tumor growth.
For this reason, understanding better the connection between proliferation and migration is essential for the development of therapies inhibiting both of these cellular processes.
Since evaluation of the “go or grow” hypothesis is currently largely based on brain tumor cells, in this thesis, we extended the investigation of this hypothesis on 2D cell cultures of tumor cell lines originating from different embryonic cell layers such as cells of neuroectodermal, mesodermal and entodermal origin, using long-term time-lapse videomicroscopy.
1.2. Molecular pathways controlling migration and proliferation
1.2.1. Overview of polypeptide growth factors controlling cell migration and proliferation
A great variety of molecules organized in complex networks of signal transduction pathways are controlling cell migration and proliferation, which are involved in several non-malignant processes such as embryonic development, wound healing, immune response, angiogenesis and tissue homeostasis (Horwitz and Webb 2003; Friedl and Weigelin 2008; Hulkower and Herber 2011). Of note, malfunctions of these molecular networks result in deregulated and signal independent growth stimulation that is in turn necessary for the initiation and progression of tumors (Hanahan and Weinberg 2000; Hanahan and Weinberg 2011).
Polypeptide growth factors (GFs) are among the most important regulators of cell migration and proliferation. They differ from hormones as neither their site(s) of synthesis nor their site(s) of action is restricted to defined tissues and they operate mostly in a paracrine fashion (Carpenter and Cohen 1990). Polypeptides are unable to cross the hydrophobic cell membrane, hence, they transmit their signals via cell membrane receptors, which are often activated by ligand-induced oligomerization or polymerization (Heldin 1995; Heldin 1996).
Since the activation and/or repression of GF signal transduction plays a crucial role in cell migration and proliferation, it is no wonder that malignant cells often carry molecular alterations of these factors or their receptors, or switch to an autocrine mode of action from a paracrine one (Favoni and de Cupis 2000; Hanahan and Weinberg 2011). Note worthily, as many GFs use common downstream signal transduction pathways, a malfunction in one molecule of the system may affect several molecular pathway simultaneously (Favoni and de Cupis 2000).
Despite the fact that GFs and their growth factor receptors (GFRs) are grouped into signaling families according to their biochemical structures, the nomenclature remained complex, arbitrary and in some cases even confusing (Yorio et al. 2008). The most important growth factor signaling system is probably the epidermal growth factor (EGF) family having several ligands such as epidermal growth factor (EGF), transforming growth factor-α (TGFα), heparin-binding EGF-like growth factor (HB-EGF), amphiregulin (AR), betacellulin (BTC), epiregulin (EPR), cripto-, epigen-, neuregulin (NRG1-4; NRG-1 is also known as Neu differentiation factor (NDF)), heregulin (HRG), acetylcholine receptor-inducing activity (ARIA) and glial growth factor (GGF). These factors bind to four different EGF receptors, ErbB1 (also termed EGFR, HER1), ErbB2 (also termed HER2, p185, or neu), ErbB3 (also termed HER3 or p160) and ErbB4 (HER4), inducing cell migration, differentiation and controlling angiogenesis, wound healing, bone reabsorption, atherosclerosis and tumor growth. HER comes from human epidermal growth factor receptor and ErbB is named for its similarity to ERBB avian erythroblastosis oncogene B. Mutations in ligands and receptors of EGF family are especially important in breast, ovarian and lung cancer but malfunctions are also present in head and neck, colorectal, pancreatic, bladder, prostate and renal cancer as well as in glioma (Yarden 2001; Harris et al. 2003; Grandis and Sok 2004; Dreux et al. 2006;
Dutta and Maity 2007).
Since TGFα is a member of EGF family, the signaling family mentioned next should be
There are 33 ligands in the TGFβ signaling family often grouped as TGFs, activins, and bone morphogenetic proteins (BMPs) but there are seven type I (ALK1–7) and four type II receptors (TβRII, BMPRII, ActRIIA and B) having a high level of overlap between ligands regulating cellular proliferation, survival, differentiation and migration. Failure in the function of TGFβ family proteins are found in colorectal, pancreatic, breast and lung cancer (Massague 2000; Gordon and Blobe 2008; Horbelt et al. 2012; Wiater and Vale 2012).
Another well-known GF family is the fibroblast growth factor (FGF) family. It consists of 18 ligands because four previous members, now termed FGF homologous factors (FHF1-4), have been removed from the list of originally 22 ligands as these molecules lack functional similarity to other FGF family members (Goldfarb et al. 2007). The 18 FGF ligands act on 4 FGF receptors (FGFR1-4), affecting proliferation, migration and differentiation in embryonic development and homeostatic factors tissue repair and tumor progression in the adult organism (e.g. breast, bladder, liver cancer, multiple myeloma, renal cell carcinoma as well as angiogenesis around the tumor) (Ornitz and Itoh 2001; Acevedo et al. 2009; Liang et al. 2012;
Turner et al. 2012).
The insulin-like growth factor (IGF) signaling system consists of two ligands (IGF-I, IGF-II) and two receptors (IGF-I receptor, IGFIR; and IGF-II receptor, IGFIIR). In addition, seven regulator molecules, namely the six high-affinity IGF binding proteins (IGFBP1-6) and acid- labile subunit (ALS), acts together regulating cell survival, cell proliferation and invasion (Capoluongo 2011; Domene et al. 2011). It is worth mentioning that some reviews enumerate also insulin and insulin receptor (IR) to the IGF family (King and Wong 2012). Alterations in the IGF family have been described in colorectal, breast, pancreatic, lung, thyroid, head and neck, prostate, renal, ovarian, and endometrial cancer as well as in sarcomas (Pollak 2008;
Gallagher and LeRoith 2011; King and Wong 2012).
Angiogenesis and endothelial cell proliferation, migration, survival and endothelium permeability in healthy as well as in cancerous tissue are controlled by the ligands and receptors of vascular endothelial growth factor (VEGF) family, which consists of seven secreted protein ligands (VEGF-A, VEGF-B, VEGF-C, VEGF-D, VEGF-E, placental growth factor (PlGF) and VEGF-F) and five receptors (VEGFR-1, VEGFR-2, VEGFR-3 and neuropilins (NP-1 and NP-2)) (Otrock et al. 2007; Shibuya 2013).
Members of the platelet derived growth factor (PDGF) family are structurally and functionally related to the VEGF family. The PDGF ligands build homo- or heterodimers from four different polypeptide chains named PDGF-AA, -AB, -BB, -CC, and -DD.
Similarly, receptors are formed from two tyrosine kinase receptor chains combined with homo- or heterodimers (PDGFR-αα, -ββ and –αβ). PDGF family members are involved in tumors such as non-small-cell lung cancer, glioma, prostate cancer and rhabdomyosarcoma (Fredriksson et al. 2004; Andrae et al. 2008; Heldin 2012; Nazarenko et al. 2012; Ostendorf et al. 2012).
Finally, the hepatocyte growth factor (HGF) family with one known ligand (HGF also named as scatter factor (SF)) and its receptor encoded by the MET gene is of particular importance because malfunction of this signaling pathway contributes to tumor formation in several cancers (e.g. lung, esophageal, gastric, breast, prostate head and neck and papillary renal cancer) and promotes aggressive cellular behavior that is linked to metastasis formation (Toschi and Janne 2008; Cecchi et al. 2012; Gherardi et al. 2012).
This short enumeration of the most important growth factor families should emphasize the complexity of GF signaling and their importance in tumor diseases (Favoni and de Cupis 2000). In the present work, the role of EGF, FGF2 and activin ligands were investigated in relation to malignant cell migration and proliferation.
1.2.2. The EGF and FGF2 activated receptor tyrosine kinase pathways
EGF and FGF2 are single-chain polypeptides consisting of 53 and 155 amino acid residues, respectively (Favoni and de Cupis 2000). EGF was one of the first GFs discovered (Cohen 1986; Favoni and de Cupis 2000). The role of EGF signaling is well established in many types of cancer (Dutta and Maity 2007). The first FGF cloned was FGF2, also known as basic fibroblast growth factor (bFGF), which is the prototypical FGF ligand with considerable literature about its role in several carcinogenic processes (Kurokawa et al. 1988; Turner et al.
2012)
EGF exerts its function on EGFR (also termed ErbB1) (Harris et al. 2003; Dreux et al. 2006), whereas FGF2 ligands activate all four types of FGFRs (Ornitz et al. 1996; Zhang et al. 2006;
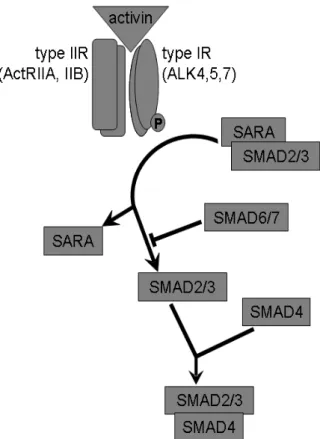
Cotton et al. 2008; Heinzle et al. 2011). Upon activation, the downstream elements of EGF and FGF2 signaling are extensively overlapping. Some of the most important downstream elements of EGF/FGF2 signaling are shown in Figure 1. Both EGF and FGF2 signaling acts through the activation of Ras, subsequently Raf and extracellular signal pathway regulated kinase (ERK)/mitogen-activated protein kinase (MAP) kinase cascade. In addition,
EGF/FGF2 signals lead to the activation of phospholipase C gamma (PLC-γ) that initiates the hydrolysis of phosphatidylinositol 4,5 biphosphate (PIP2) into inositol 1,4,5-triphosphate (IP3) and diacylglycerol (DAG), which in turn activates protein kinase C (PKC).
Furthermore, both EGF and FGF2 signaling activates, either directly or through Ras, PI3 kinase (PI3K), which generates PIP3 by phosphorylating PIP2 and leads to the activation of AKT. The phosphatase PTEN is responsible for the dephosphorylating of PIP3 to PIP2 and, hence, for the deactivation of AKT. (For review see Maruta and Burgess (1994), Dutta and Maity (2007), Ghosh and Chin (2009), Liang et al. (2012).)
Figure 1. The EGFR/FGFR signaling pathway. Upon activation, GFRs form dimmers and activate the downstream effector, which induces activation of the RAF/MEK/ERK (green), the PI3K/(PTEN)/AKT/mTOR (blue) and the PLC/PKC (yellow) pathways as well as alters transcription by the activation of STAT1 and STAT3 (purple). It is important to note that a constitutively activated mutant Ras can activate all three major signal transduction pathways and oncogenic BRAF activates the RAF/MEK/ERK signaling. Modified after (Timar et al.
2010)
Although the role of EGF and FGF2 signaling in non-malignant tissue could provide useful information to cancer research, the majority of published works elucidate EGF / FGF2 signaling in tumors. Under normal conditions, EGF signaling is involved in epidermal proliferation, gastric acid secretion, urothelial regeneration, corneal wound healing, periodontal repair, regulation of apoptosis and even in placental development (Carpenter and Cohen 1990; Danielsen and Maihle 2002; Daher et al. 2003; Marzioni et al. 2005; Dereka et al. 2006; Yu et al. 2010). FGF2 exerts its function in regulating processes of hematopoiesis and regulation of growth and function of endothelial and smooth muscle cells (Allouche and Bikfalvi 1995; Nugent and Iozzo 2000).
Impaired EGF and FGF2 signaling is involved in a great variety of malignancies such as breast, ovarian, lung, head and neck, colorectal, pancreatic, bladder, prostate cancer, renal cell carcinoma, multiple myeloma, glioma as well as tumor angiogenesis (Yarden 2001; Grandis and Sok 2004; Dutta and Maity 2007; Acevedo et al. 2009; Liang et al. 2012). Accordingly, the targeting of EGFR has become an efficient therapeutic option for certain malignancies.
The anti-EGFR1 monoclonal antibody cetuximab (Erbitux©) is approved by the Food and Drug Administration (FDA) as targeted therapy in colorectal cancer and investigated as a promising treatment modality in head and neck cancer (Denaro et al. 2013) and non-small cell lung cancer (Pirker 2013). Small molecule tyrosine kinase inhibitors (TKI) erlotinib (Tarceva©) and gefitinib (Iressa©) are approved by the FDA for the treatment of non-small cell lung cancer and considered as potential therapeutics in colorectal cancer (Gravalos et al.
2007) and breast cancer (Normanno et al. 2006; Khajah et al. 2012). Nevertheless, EGF and FGF2 signaling is particularly important in malignant melanoma because signal transduction of the receptors is affected by oncogenic driver mutations in BRAF or NRAS, which are present in about 40 to 70% and in 10 to 30% of melanoma cases, respectively (Demunter et al. 2001; Davies et al. 2002; Kumar et al. 2003; Maldonado et al. 2003; Houben et al. 2004;
Tsao et al. 2004; Curtin et al. 2005).
Several studies demonstrated that EGF signaling is indeed affected in melanocytic malignancies. In a great variety of benign and neoplastic melanocytic lesions increased EGFR expression was demonstrated by immunohistochemistry (Ellis et al. 1992). Interestingly, expression of EGFR was found to be positively and the expression of EGF negatively correlated with a more malignant phenotype in melanocytic tumors (Lazar-Molnar et al.
2000). Furthermore more intense EGFR expression was detected in melanoma metastases
considered to correlate with tumor progression (Rakosy et al. 2007; Feinmesser et al. 2010;
Boone et al. 2011). However, there is a varying degree of expression of EGFR in melanoma cells and some cell lines lack expression (Gordon-Thomson et al. 2001). In vitro studies have shown that EGF signaling can stimulate proliferation and migration of melanoma cells (Lazar-Molnar et al. 2000). Furthermore, EGF was shown to facilitate melanoma lymph node metastases by affecting lymphangiogenesis (Bracher et al. 2013). Of note, recent studies claim EGF signaling to be responsible for resistance against BRAF inhibitors (Girotti and Marais 2013; Girotti et al. 2013).
Although normal and malignant melanocytes express predominantly FGFR1 (Becker et al.
1992), there is an increase in overall expression of growth factor receptors and the transcription of FGFR4 was detected only in malignant melanoma cells (Easty et al. 1993;
Yayon et al. 1997). Furthermore, the expression of FGFR4 is thought to be a potential prognostic marker for melanoma (Streit et al. 2006). The importance of FGFR1 is underlined with experiments, in which melanoma cells expressing truncated FGFR1 and lacking the intracellular kinase domain showed dramatically reduced cell proliferation and survival in vitro as well as decreased tumorigenic potential in vivo (Yayon et al. 1997). In addition, FGF2 is not expressed in normal melanocytes but it is in melanoma cells (Halaban et al. 1988).
Furthermore, FGF2 signaling is involved in processes leading to melanocytic tumors and melanoma and several FGFR2 loss-of-function mutations have been identified in melanoma (Gartside et al. 2009). It has been reported that forced expression of FGF2 in melanocytes resulted in autonomous and increased growth in vitro but not in increased tumor forming capacity in vivo (Dotto et al. 1989; Nesbit et al. 1999). In contrast, inhibition of FGF2 signaling by either specific neutralizing antibodies or by antisense oligonucleotides resulted in decreased migration and proliferation in vitro and prolonged survival time and suppression of tumor growth in animal models (Wang and Becker 1997; Ozen et al. 2004; Chalkiadaki et al.
2009; Li et al. 2010; Aguzzi et al. 2011; Metzner et al. 2011; Yu et al. 2012).
The facts that both EGF and FGF2 act on extensive overlapping downstream signaling networks and that the most common oncogenic mutations in malignant melanoma are activating mutations of their downstream effectors led us to investigate the activation and inhibition of EGF and FGF2 signaling on melanoma cells with different NRAS and BRAF mutational status.
1.2.3. Activin-activated receptor protein serine/threonine kinase signal transduction
Activin is a member of TGFβ signaling family and - in contrast to EGF and FGF2 - it is a homo- or heterodimeric protein. Altogether five subunits have been described (activin subunits βA, βB, βC , βD and βE), nevertheless, activin βD has been identified only in Xenopus laevis (Oda et al. 1995). Activin ligands have been named according to their building monomers. Thus, for example activin A contains two βA monomers and activin BE consists of one βB and one βE subunit.
Activin binding receptors are composed of two dimeric proteins, namely type I and type II receptors, being the former the most common. Type I activin receptor is known as Alk4 (also known as ActRIB) but Alk7 (ActRIC) and Alk2 (ActRIA) can also mediate activin signaling, whereas type II activin receptor is a dimmer of ActRIIA or ActRIIB peptides (Tsuchida et al.
2008; Antsiferova and Werner 2012). A schematic view of the activin signaling pathway is shown in Figure 2. Canonical activin signaling starts with the binding of activin to a dimeric type II activin receptor, which leads to the recruitment, phosphorylation and activation of type I activin receptor. The activated type I activin receptor phosphorylate SMAD21 and SMAD3 molecules, which then become liberated from SARA (SMAD anchor for receptor activation) proteins. Subsequently, SMAD2/3 interacts with SMAD4 (the so called common mediator SMAD4 – Co-SMAD4) and translocates to the nucleus, where the complex directly regulates gene expression (Schmierer and Hill 2007; Antsiferova and Werner 2012). SMAD6 and SMAD7 are cytosolic inhibitors of the canonical SMAD signalization. Besides the canonical SMAD pathway, activin interacts, in a cell type-dependent manner, with other intracellular signals such as the pituitary transcription factor Pit-1, RAS or Erk1/2 (Cocolakis et al. 2001;
Bao et al. 2005; Tsuchida et al. 2009; Grusch et al. 2010).
Figure 2. The canonic activin signaling pathway. Binding of activin to type II activin receptor induces recruitment and phosphorylation of type I activin receptor, which leads to the liberation of SMAD2 and SMAD3 from SARA. Liberated SMAD2/3 is able to form a complex with SMAD4, which may act as a transcription factor in the nucleus. SMAD6 and SMAD7 are inhibitors of the canonic activin pathway. Modified after Risbridger et al. (2001) and Tsuchida et al. (2009).
In non-malignant tissues, activin is involved in pancreatic development and homeostasis (Wiater and Vale 2012), inflammation (Hedger et al. 2011; Fearon et al. 2012), wound healing processes (Antsiferova and Werner 2012), reproduction (de Kretser et al. 2002), stem cell biology and regulation of apoptosis, cell proliferation (Beattie et al. 2005) as well as regulation of the hypothalamus-pituitary-gonadal axis (Tsuchida et al. 2008).
In tumors, unlike EGF and FGF2, activin signaling can be associated with both inhibition and promotion of cell proliferation and tumor progression. For example, in hepatocellular carcinoma (Chen et al. 2000; Deli et al. 2008), breast cancer (Burdette et al. 2005; Katik et al.
2009) and prostate cancer (Wang et al. 1996; Risbridger et al. 2001), activin signaling takes part in inhibition of cell proliferation and tumor progression. In line with this observation,
these tumors often overexpress activin antagonizing proteins (Grusch et al. 2006;
Razanajaona et al. 2007).
In contrast, activin can promote cell proliferation in endometrial carcinoma (Tanaka et al.
2004; Ferreira et al. 2008), oral squamous cell carcinoma (Chang et al. 2010), testicular cancer (Devouassoux-Shisheboran et al. 2003) gastric cancer (Takeno et al. 2008; Wang et al.
2012) and in a great variety of thoracic tumors like esophageal squamous cell carcinoma (Yoshinaga et al. 2008; Puhringer-Oppermann et al. 2010), esophageal adenocarcinoma (Seder et al. 2009) and lung adenocarcinoma (Seder et al. 2009). In line with this, overexpression of activin is found in these thoracic tumors and is often related to poor prognosis, enhanced metastasis and, thus, to shorter disease-free survival time (Yoshinaga et al. 2003; Seder et al. 2009; Chang et al. 2010).
Exogenous antagonists against the activin type I (SB-431542 and SB-505124) and type II (activin-M108A) receptors have been developed (Harrison et al. 2005). SB-431542 acts on all three activin type I receptors, namely on ALK4, ALK5 and ALK7 (Inman et al. 2002; Laping et al. 2002). Treatment with SB-431542 showed antitumor effect on clear cell renal cell carcinoma cells (Bostrom et al. 2013). Similarly SB-431542 treatment inhibited proliferation of human osteosarcoma cells (Matsuyama et al. 2003) and decreased proliferation and migration of glioma cells (Hjelmeland et al. 2004) in vitro.
Since mesothelioma lacks targeted therapy (Jackman 2009) and, in some other thoracic tumors, the inhibition of activin leads to a decrease in cell proliferation and tumor invasion (Seder et al. 2009; Seder et al. 2009; Chang et al. 2010) our aim was to investigate the potential effect of inhibiting activin signaling in human mesothelioma cells.
1.3. Targeted inhibition of GF pathways controlling migration and proliferation
1.3.1. Molecularly targeted inhibition of cancer treatment in clinical practice
Molecularly targeted inhibition of a signaling system can be exerted on many levels, such as ligand, binding site of the receptor, intracellular kinase domain of the receptor and downstream elements. Inhibition on ligand level is often used when the aim is to inhibit the
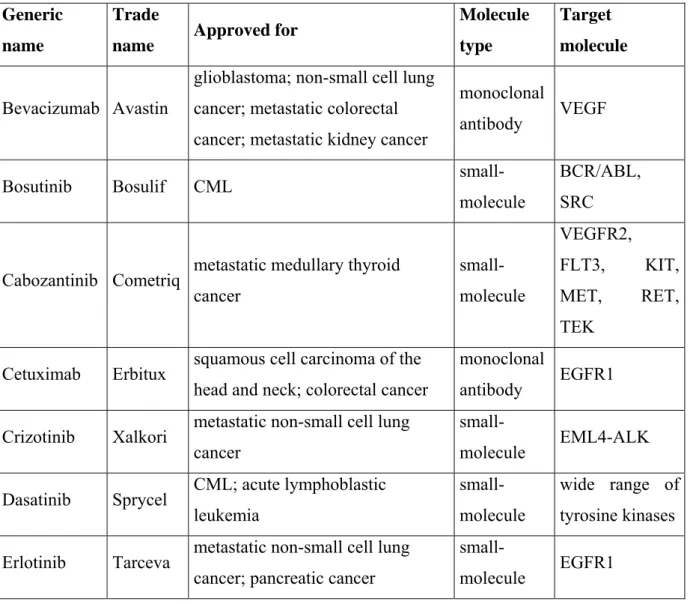
exemestane (Aromasin®)) (Decensi et al. 2012). The extracellular, active site of receptors can be blocked by antibodies, for example cetuximab (Erbitux®) that binds and inhibits EGFR1 (Bou-Assaly and Mukherji 2010). To inhibit signaling at the site of the intracellular kinase domain of receptors small-molecule inhibitors are used since they can cross the cell membrane (e.g. erlotinib (Tarceva®), tyrosine kinase inhibitor of EGFR1) (Siegel-Lakhai et al. 2005). Of note, many downstream elements of receptor signaling pathways are kinases that can also be blocked by small-molecule inhibitors (e.g. the mTOR inhibitor temsirolimus (Torisel®)) (Klumpen et al. 2010). A summary of the FDA-approved (Food and Drug Administration) targeted therapies inhibiting GF signaling pathways in cancer patients is listed in Table 1. (http://www.cancer.gov/cancertopics/factsheet/Therapy/targeted).
Table 1. The list of targeted therapies acting on GF pathways approved by the Food and Drug Administration (FDA) for cancer treatment.
Generic name
Trade
name Approved for Molecule
type
Target molecule
Bevacizumab Avastin
glioblastoma; non-small cell lung cancer; metastatic colorectal cancer; metastatic kidney cancer
monoclonal
antibody VEGF
Bosutinib Bosulif CML small-
molecule
BCR/ABL, SRC
Cabozantinib Cometriq metastatic medullary thyroid cancer
small- molecule
VEGFR2,
FLT3, KIT, MET, RET, TEK
Cetuximab Erbitux squamous cell carcinoma of the head and neck; colorectal cancer
monoclonal
antibody EGFR1 Crizotinib Xalkori metastatic non-small cell lung
cancer
small-
molecule EML4-ALK Dasatinib Sprycel CML; acute lymphoblastic
leukemia
small- molecule
wide range of tyrosine kinases Erlotinib Tarceva metastatic non-small cell lung
cancer; pancreatic cancer
small-
molecule EGFR1
Everolimus Afinito
advanced kidney cancer; advanced breast cancer; pancreatic
neuroendocrine tumors;
subependymal giant cell astrocytoma;
small-
molecule mTOR
Gefitinib Iressa non-small cell lung cancer small-
molecule EGFR1
Imatinib mesylate
Gleevec/
Glivec
gastrointestinal stromal tumor;
dermatofibrosarcoma protuberans;
acute lymphoblastic leukemia (philadelphia cromosome +);
myelodysplastic/myeloproliferative disorders; systemic mastocytosis
small- molecule
BCR/ABL, KIT, PDGFRβ
Lapatinib Tykerb metastatic breast cancer small- molecule
EGFR1, EGFR2 (HER2)
Nilotinib Tasigna CML small-
molecule BCR/ABL Panitumumab Vectibix metastatic colon cancer monoclonal
antibody EGFR1
Pazopanib Votrient advanced renal cell carcinoma; soft tissue sarcoma
small- molecule
VEGFR1, VEGFR2, VEGFR3, PDGFRα, PDGFRβ, KIT
Pertuzumab Perjeta
in combination with trastuzumab and docetaxel in metastatic breast cancer that expresses HER-2
monoclonal
antibody EGFR2 (HER2)
Regorafenib Stivarga metastatic colorectal cancer small- molecule
VEGFR1, VEGFR2,
VEGFR3, RAF, RET, PDGFRβ, KIT
Sorafenib Nexavar advanced renal cell carcinoma;
hepatocellular carcinoma
small- molecule
VEGFR2,
VEGFR3, RAF, PDGFRβ, KIT, FLT3
Sunitinib Sutent
metastatic renal cell carcinoma;
gastrointestinal stromal tumor that is not responding to imatinib;
pancreatic neuroendocrine tumors
small- molecule
VEGFR1, VEGFR2, VEGFR3, PDGFRα,
PDGFRβ, KIT, FLT3, CSF-1R Temsirolimus Torisel renal cell carcinoma small-
molecule mTOR
Trastuzumab Herceptin
breast cancer; gastric or gastro- esophageal junction
adenocarcinoma
monoclonal
antibody EGFR2 (HER2)
Vandetanib Caprelsa metastatic medullary thyroid cancer
small- molecule
EGFR1,
VEGFR2, RET
Vemurafenib Zelboraf metastatic melanoma with BRAF V600E mutation
small- molecule
BRAF (with V600E
mutation) Ziv-
aflibercept Zaltrap metastatic colorectal cancer
recombinant fusion protein
VEGF-A, VEGF-B, PIGF
New targeted therapies are emerging day after day, nevertheless, mesothelioma completely lacks for any approved targeted therapy and only one such therapy is available for the subgroup of melanoma patients with mutant BRAF. Unfortunately, despite the promising first results, BRAF-mutant melanoma often shows intrinsic or acquired resistance against vemurafenib treatment (Bollag et al. 2010; Flaherty et al. 2010; Paraiso et al. 2010; Ribas and Flaherty 2011).
3.3.2 Novel molecular targets in development
The development of new targeted therapies involves not only the invention of novel treatment modalities against new or well-known target molecules, but also the identification of new indications for compounds and targets already in use. Finding new indications is not always obvious because, the same treatment can have opposite effect on cancer cells. As mentioned above, activin treatment inhibited cell proliferation in breast cancer and hepatocellular carcinoma but promoted proliferation of gastric cancer and squamous cell carcinoma (Deli et al. 2008; Takeno et al. 2008; Katik et al. 2009; Chang et al. 2010). Furthermore, combined treatments can lead to a more efficient usage of known targeted therapies and even to successful treatment of resistant cases.
For example, the FDA-approved bisphosphonates and amino-bisphosphonates, such as zoledronic acid (Zometa®) is a palliative treatment in cancer bone metastases but a new indication of zoledronic acid (ZA) could be the treatment of tumors with RAS mutations such as malignant melanoma. In line with this, a large number of in vitro and in vivo experimental results suggest that ZA and other bisphosphonates may have, beside the inhibiting effect on osteoclasts, a specific antitumor activity like inhibition of proliferation and/or apoptosis induction in myeloma (Derenne et al. 1999; Iguchi et al. 2003; Guenther et al. 2010), osteosarcoma (Sonnemann et al. 2001; Kubista et al. 2006), prostate (Lee et al. 2001; Corey et al. 2003) or breast cancer (Senaratne et al. 2000; Jagdev et al. 2001). Even in preclinical studies running on cancer types without preferential spreading to bone as pancreatic cancer (Tassone et al. 2003) and neural crest derived neuroblastoma (Peng et al. 2007), the cells have shown sensitivity to ZA treatment. Moreover, the antitumor effect exerted by ZA is especially interesting in melanoma treatment because ZA inhibits farnesyl-diphosphate synthase and as a result, the lack of the substrate of geranylgeranyl transferase and farnesyl transferase (two enzymes being responsible for prenylation) impairs the posttranslational modification of Ras (Amin et al. 1992; van Beek et al. 1999). The earlier in vitro studies in melanoma cells have shown proliferation inhibiting and apoptosis inducing effect of ZA (Forsea et al. 2004).
Furthermore, ZA treatment could contribute to the regression of pulmonary and bone metastases of a melanoma patient (Laggner et al. 2009). Nevertheless, the effect of ZA on melanoma cells in vivo and the dependence of biological response on the BRAF or NRAS oncogenic mutation status have not yet been studied.
Gefitinib and erlotinib are two well-known inhibitors of EGFR1 and are in clinical use for the treatment of non-small cell lung and pancreatic cancer. Both inhibitors are also promising therapeutics in colorectal cancer (Gravalos et al. 2007). Similarly, gefitinib and erlotinib showed inhibitory effect on the proliferation and migration of breast cancer cells (Normanno et al. 2006; Khajah et al. 2012). In addition, gefitinib inhibited proliferation of malignant melanoma cells harboring wild type BRAF and NRAS (Djerf et al. 2009) but failed to show significant clinical efficacy as a single-agent therapy for unselected patients with metastatic melanoma (Patel et al. 2011). As a single therapy, erlotinib failed to reduce proliferation of melanoma cells but in combination with bevacizumab, a VEGF-A binding antibody, the decrease in proliferation was significant in vitro (Schicher et al. 2009). Similarly, monotherapy in in vivo xenografts of melanoma with unknown oncogenic mutations showed modest inhibition of tumor growth but, in combination with bevacizumab, tumor growth was significantly inhibited (Schicher et al. 2009). An additional EGFR inhibitor, pelitinib (EKB- 569), binding irreversibly to EGFR, inhibited the proliferation of hepatocellular carcinoma cells in vitro (Kim and Lim 2011). In another in vitro study, pelitinib inhibited proliferation of gefitinib- and erlotinib resistant non-small cell lung cancer cell lines (Kwak et al. 2005). In a phase I study, clinical benefit was seen with temsirolimus administered in combination with pelitinib (Bryce et al. 2012). A further compound inhibiting EGF signaling is the pan-EGFR tyrosine kinase inhibitor CI-1033 (also called canertinib or PD183805), which effectively inhibited the growth of esophageal cancer cells in a dose-dependent manner both in vitro and in vivo (Ako et al. 2007). Furthermore, CI-1033 was shown to be effective in inhibiting proliferation in vivo and tumor growth in vitro in malignant melanoma harboring wild type BRAF and NRAS (Djerf Severinsson et al. 2011). It can be seen from the above mentioned examples that EGFR inhibitors are effective in different kinds of solid tumors, though their systematical testing on melanoma cells with known oncogenic mutations have not performed yet.
Targeted therapies against FGF signaling have not been approved yet, nevertheless, numerous molecules inhibiting FGF signaling are available today. One of them is the small molecule kinase inhibitor BIBF-1120 (also known as nintedanib or intedanib or vargatef) inhibiting also VEGF and PDGF receptors. BIBF-1120 inhibits the proliferation of a large panel of tumor cells including kidney, pharyngeal, ovary, lung, colon, pancreatic cancer and glioma cells in vitro and antitumor effect in vivo (Hilberg et al. 2008; Torok et al. 2012; Katoh and Nakagama 2013). Furthermore, BIBF-1120 is considered to be a suitable treatment for
idiopathic pulmonary fibrosis (Antoniu 2012). Besides FGFRs, the tyrosine kinase inhibitor ponatinib (also named AP24534) has an affinity to VEGFR and ABL as well. In vitro treatment with ponatinib resulted in decreased proliferation of breast, lung, gastric, endometrial, bladder, colon cancer cells and reduced growth of tumor xenografts and prolonged survival of host mice in vivo (O'Hare et al. 2009; Gozgit et al. 2012; Katoh and Nakagama 2013). Due to the affinity to ABL, ponatinib has recently been approved for the treatment of chronic myeloid leukemia and Philadelphia chromosome positive acute lymphoblastic leukemia (http://clinicaltrials.gov; NCT01592136). Another substance, BGJ- 398, is a novel and highly selective inhibitor for FGFRs, which effectively reduces proliferation of bladder cancer cells in vitro and the amount of circulating tumor cells and lymph node as well as distant metastases in vivo (Guagnano et al. 2011; Cheng et al. 2013).
Recently, a phase II clinical study has started, where BGJ-398 is going to be tested in combination with the RAF inhibitor LGX818 on BRAF-mutant advanced melanoma (http://clinicaltrials.gov; NCT01820364). A further FGFR selective inhibitor is AZD-4547, which reduced the proliferation of breast cancer, multiple myeloma, acute myeloid leukemia and myeloproliferative syndrome-derived cells in vivo and demonstrated antitumor effect on colon cancer xenografts in vivo (Gavine et al. 2012; Katoh and Nakagama 2013). Thus, similarly to targeting EGFRs, anti-FGFR therapies are effective in different kinds of solid tumors. In addition, EGF and FGF signaling are potential emerging targets for tumor therapy, since these are central pathways and since these pathways are especially affected by the most common oncogenic mutations in malignant melanoma.
The small molecule inhibitor SB-431542 antagonizes activin signaling by binding to the type I activin receptors ALK4, ALK5 and ALK7 (Inman et al. 2002). It inhibits proliferation of osteosarcoma and proliferation as well as motility of glioma cells in vitro (Matsuyama et al.
2003; Hjelmeland et al. 2004; Harrison et al. 2005). Furthermore, SB-431542 augmented immune reactivity against cancer cells in vitro and in vivo (Tanaka et al. 2010).
Taken together, the investigation of the inhibition of GF signaling is still one of the promising leading edges in the development of anti-cancer therapies.
2. OBJECTIVES
In this thesis, we aimed to investigate the interplay between proliferation and migration in 2D and 3D cultures of human tumor cells. Further aim was to explore how this interplay would be regulated upon stimulation and inhibition of GF receptor pathways and would depend on oncogenic mutations. Thus, our questions were as follows.
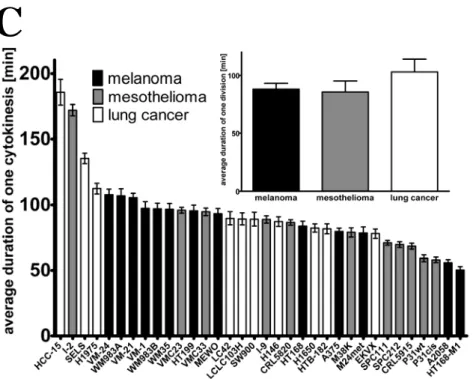
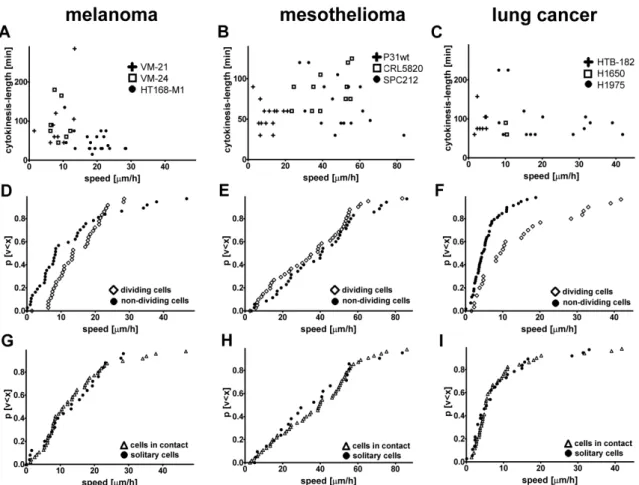
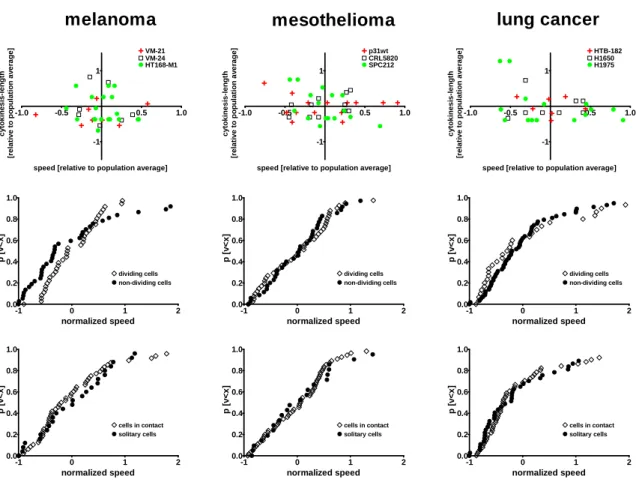
1. Do human tumor cells defer proliferation to cell migration in adherent cultures as it had been postulated in the “go or grow” hypothesis? Accordingly, we measured proliferation, migration and length of cytokinesis in 35 lung cancer, melanoma and mesothelioma cell lines by videomicroscopy and performed correlation analysis between these cellular processes at both single cell and population level.
2. Does invasion of the ECM from multicellular spheroids require concurrent cell proliferation? We raised this question because a number of mathematical models of 3D matrix invasion of tumor cells incorporate the assumption that proliferation is a prerequisite to invasive behavior, however, there was no experimental evidence available for this. In order to evaluate this hypothesis we characterized the invasion pattern of proliferating and proliferation-inhibited cells from multicellular spheroids into collagen type I gel.
3. Do BRAF and NRAS oncogenic mutations determine the migratory and proliferative response of melanoma cells to activation and inhibition of EGFR and FGFR? First, BRAF and NRAS oncogenic mutations as well as EGFR and FGFR expression of melanoma cells were determined. Then, migration and proliferation as well as the activation of downstream signaling were explored under baseline conditions and after treatment with EGF and/or FGF or with the inhibitors of these receptors.
4. Does prenylation inhibition interfere with migration, proliferation and the activity of Ras signaling pathway in human melanoma cells in vitro and in vivo? BRAF and NRAS mutation dependent effect of ZA treatment on cell migration, proliferation and apoptosis induction was determined in melanoma cells in vitro. Furthermore, the effect of ZA on
primary tumor growth and metastasis formation was assessed using animal models of melanoma cells with different mutational status.
5. Does activin signaling support or interfere with migration and proliferation of human mesothelioma cells? Accordingly, we assessed the effect of activin and activin-receptor inhibitor SB431542 treatment on cell proliferation, cytokinesis and migration in human mesothelioma cells via videomicroscopy.
3. METHODS
3.1. Cell cultures
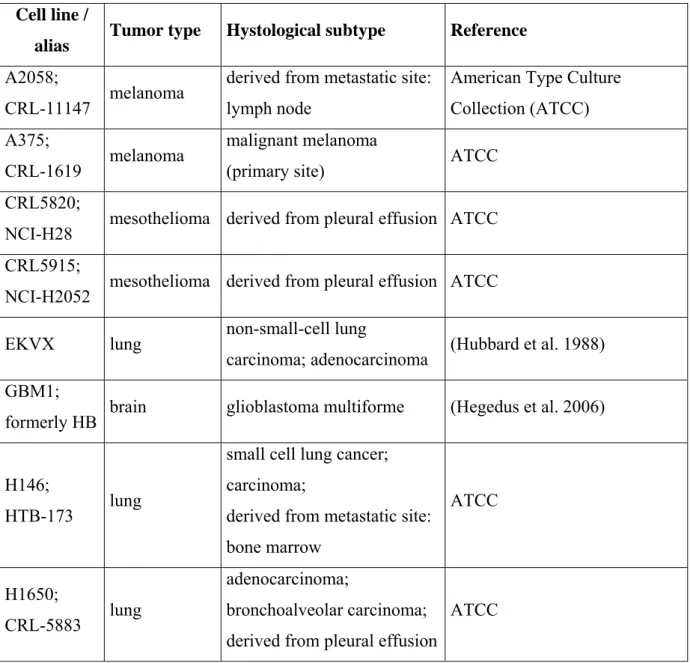
The complete list of cell lines used in this thesis together with their tumor of origin, histological subtype and references are presented in Table 2.
Table 2. Complete list of cell lines used in this thesis.
Cell line /
alias Tumor type Hystological subtype Reference A2058;
CRL-11147 melanoma derived from metastatic site:
lymph node
American Type Culture Collection (ATCC) A375;
CRL-1619 melanoma malignant melanoma
(primary site) ATCC
CRL5820;
NCI-H28 mesothelioma derived from pleural effusion ATCC CRL5915;
NCI-H2052 mesothelioma derived from pleural effusion ATCC
EKVX lung non-small-cell lung
carcinoma; adenocarcinoma (Hubbard et al. 1988) GBM1;
formerly HB brain glioblastoma multiforme (Hegedus et al. 2006)
H146;
HTB-173 lung
small cell lung cancer;
carcinoma;
derived from metastatic site:
bone marrow
ATCC
H1650;
CRL-5883 lung
adenocarcinoma;
bronchoalveolar carcinoma;
derived from pleural effusion
ATCC
H1975;
CRL-5908 lung adenocarcinoma; non-small
cell lung cancer ATCC
HCC-15;
ACC 496 lung squamous cell carcinoma
Deutsche Sammlung von Microorganismen and
Zellkulturen GmbH (DSMZ) HCC3 liver hepatocellular carcinoma (Sagmeister et al. 2008)
HL-HE lung
small cell lung cancer;
derived from metastatic site:
brain
Institute of Cancer Research, Vienna, Austria
HT168 melanoma
A2058 subline with low liver metastatic capacity in
immunosuppressed mice
(Ladanyi et al. 1990)
HT168-M1 melanoma
A2058 subline with high liver metastatic capacity in immunosuppressed mice
(Ladanyi et al. 1990)
HT199 melanoma (Ladanyi et al. 1995)
HTB-182;
NCI-H520 lung squamous cell carcinoma ATCC
I-2 mesothelioma University of Milano, Italy
I-9 mesothelioma University of Milano, Italy
LC42 lung adenocarcinoma Institute for Cancer Research, Oslo, Norway
LCLC103H;
ACC 384 lung
large cell lung carcinoma;
derived from pleural effusion
DSMZ
M24met melanoma
M24met is isolated from a nude mice xenograft of M24 (a lymphnode metastasis)
(Mueller et al. 1991)
M38K mesothelioma mixed histological type University of Helsinki, Helsinki, Finland MEWO;
melanoma derived from metastatic site:
ATCC
P31cis mesothelioma
human pulmonary mesothelioma cell line;
cisplatin resistant
University of Umea, Sweden
P31wt mesothelioma
human pulmonary mesothelioma cell line;
wild type
University of Umea, Sweden
SELS lung adenocarcinoma; derived
from lymph node metastasis (Endresen et al. 1985) SPC111 mesothelioma from pleural effusion with
mixed histology (male)
University of Zurich, Switzerland
SPC212 mesothelioma from tumor with mixed histology (female)
University of Zurich, Switzerland
SW900;
HTB-59 lung squamous cell carcinoma ATCC U87;
HTB-14 glioblastoma glioblastoma; astrocytoma ATCC VM-1
FTSLA melanoma derived from metastatic site:
lymph node
Institute of Cancer Research, Vienna, Austria
VM-15
MJZJ melanoma derived from metastatic site:
lymph node
Institute of Cancer Research, Vienna, Austria
VM-21
RHTP melanoma nodular melanoma Institute of Cancer Research, Vienna, Austria
VM-24
SHJT melanoma derived from metastatic site:
lymph node
Institute of Cancer Research, Vienna, Austria
VM-47
HOST melanoma derived from metastatic site:
brain
Institute of Cancer Research, Vienna, Austria
VMC23 mesothelioma epithelioid mesothelioma Institute of Cancer Research, Vienna, Austria
VMC33 mesothelioma epithelioid mesothelioma Institute of Cancer Research, Vienna, Austria
WM35 melanoma superficial spreading melanoma
Wistar Collection; Wistar Institute, Philadelphia, USA
WM983A melanoma
unclassified radial growth phase melanoma (primary site from WM983B)
Wistar Collection; Wistar Institute, Philadelphia, USA
WM983B melanoma derived from metastatic site:
lymph node
Wistar Collection; Wistar Institute, Philadelphia, USA Cell cultures were maintained, unless otherwise stated, at 37°C in a humidified 5% CO2
atmosphere in Dulbecco's modified Eagle's medium (DMEM) containing 4500mg/dm3 glucose, piruvate and L-glutamine (Lonza, Switzerland) and supplemented with 10% fetal calf serum (FCS; Lonza, Switzerland) and 1% penicillin-streptomycin-amphoterycin (Switzerland). For conventional 2D cultures, cells were grown in tissue culture flasks. For examining the EGFR and FGFR activation, cells were kept in medium supplemented with 5%
FCS.
3.2. Collagen invasion assay
For 3D cell aggregates, a modified version of our previous protocol (Hegedus et al. 2006) was applied. Briefly, GBM1 and U87 cells were trypsinized (0.1% trypsin, Sigma) at 80%
confluent conventional cell culture and cell suspensions were centrifuged at 2000×g for 3 min. Pellets were drawn into pipette tips of 200 μl and incubated for 30 minutes at 37°C. The resulting cylindrical aggregates were immediately embedded into collagen gel.
Collagen gel was prepared from rat-tail collagen type I (Sigma-Aldrich) by dissolving the powder in 1M acetic acid. Neutral pH of the solution was adjusted by adding 7.5% NaHCO3. The final concentration of 1 mg/ml was achieved by diluting the gel with regular culture medium or with medium complemented with the inhibitor compound. For the assay, 200 μl ice-cold collagen solution was added to each well of 96-well plates. Before embedding the cell aggregates, the plate had been kept at room temperature for 10 minutes and when seeding the cells, the plate was transferred to a 37°C incubator to achieve complete gelation. After 30 minutes of incubation, the gel was covered with 100 μl of complete growth medium and the samples were kept at 37°C in a humidified 5% CO2 atmosphere. Medium was changed every other day. To follow the invasion, images were taken daily using a phase-contrast Nikon