Identification of a claudin-4 and E-cadherin score to predict prognosis in breast cancer
Attila M. Szasz,1Zsuzsanna Nemeth,1Balazs Gyorffy,2Mariann Micsinai,3,4Tibor Krenacs,5Zsolt Baranyai,6 Laszlo Harsanyi,7Andras Kiss,1Zsuzsa Schaff,1Anna-Maria Tokes1and Janina Kulka1,8
1Second Department of Pathology, Semmelweis University, Budapest;2Research Laboratory of Pediatrics and Nephrology, Hungarian Academy of Sciences, Budapest, Hungary;3Center for Health Informatics and Bioinformatics, New York, New York;4Department of Pathology and Yale Cancer Center, New Haven, Connecticut, USA;5First Department of Pathology and Experimental Cancer Research, Semmelweis University, Budapest;6Department of Surgery and Vascular Surgery, Uzsoki Memorial Hospital, Budapest;7First Department of Surgery, Semmelweis University, Budapest, Hungary
(Received June 15, 2011⁄Revised August 8, 2011; August 16, 2011⁄Accepted August 22, 2011⁄Accepted manuscript online August 29, 2011)
The elevated expression of claudins (CLDN) and E-cadherin (CDH-1) was found to correlate with poor prognostic features. Our aim was to perform a comprehensive analysis to assess their potential to predict prognosis in breast cancer. The expression of CLDN-1, -3–5, -7, -8, -10, -15, -18, and E-cadherin at the mRNA level was evaluated in correlation with survival in datasets containing expression measurements of 1809 breast cancer patients. The breast cancer tissues of 197 patients were evaluated with tissue microarray technique and immunohistochemical method for CLDN-1–5, -7, and E-cadherin protein expression. An additional val- idation set of 387 patients was used to test the accuracy of the resulting prognostic score. Based on the bioinformatic screening of publicly-available datasets, the metagene of CLDN-3, -4, -7, and E-cadherin was shown to have the most powerful predictive power in the survival analyses. An immunohistochemical protein profile consisting of CLDN-2, -4, and E-cadherin was able to predict outcome in the most effective manner in the training set. Combin- ing the overlapping members of the above two methods resulted in the claudin-4 and E-cadherin score (CURIO), which was able to accurately predict relapse-free survival in the validation cohort (P= 0.029). The multivariate analysis, including clinicopathological variables and the CURIO, showed that the latter kept its predictive power (P= 0.040). Furthermore, the CURIO was able to further refine prognosis, separating good versus poor prognosis sub- groups in luminal A, luminal B, and triple-negative breast cancer intrinsic subtypes. In breast cancer, the CURIO provides additional prognostic information besides the routinely utilized diagnostic approaches and factors. (Cancer Sci, doi: 10.1111/j.1349-7006.
2011.02085.x, 2011)
I
nvestigation of the expression of tight junction molecules has recently gained increased importance due to its implicated prognostic value in breast cancer.(1,2) The recently-identified new subtypes, named ‘‘claudin-low’’ breast carcinomas, pro- pose a new challenge for the breast cancer research community due to their rarity. This subgroup typically exhibits high histo- logical grade, with stem cell and epithelial-to-mesenchymal transition features, low expression of cell–cell junction proteins, and probably poor response to systemic therapy.(3,4)E-cadherin (CDH-1), a transmembrane protein that functions in epithelial cell–cell interactions as part of adherent junctions, is linking the membrane to the cytoskeletal matrix through inter- actions with a- and b-catenin. It is used in routine diagnostic pathology to distinguish lobular and ductal carcinomas.(5)Studies evaluating the expression of E-cadherin report the loss of these molecules in approximately 80% of lobular carcinomas.(6–10)
Claudin (CLDN) tight junction molecules were originally described by Furuseet al.in 1998.(11)In the past decade, there have been multiple attempts to evaluate their expression in several pathological states and organs.(12)In 36 of 39 invasive
breast cancer samples that we reported on in an earlier study, there was either an absence or scattered presence of the CLDN- 1 protein.(13) Claudin-1 expression also correlated with recur- rence status and malignant potential in another study.(14) A decreased level of CLDN-4 expression was observed in the majority of grade 1 invasive ductal carcinomas (IDC).(15)Fur- thermore, CLDN-4 expression was significantly higher in basal- like breast carcinomas.(16) The loss of CLDN-7 was found to correlate with histological grade in both ductal carcinomain situ and IDC, and its expression was lost in the majority of lobular carcinomain situcases.(17)The reduced expression of CLDN-7 correlated not only with higher tumor grade, but also with the metastatic states, including loco-regional recurrences.(18) Reduced CLDN-16 expression was also described in metastatic breast tumors.(19)
Alterations in intercellular junctions and membrane proteins might lie behind some morphological and invasive properties of carcinomas. The changes of E-cadherin, CLDN-1, -4, and -7 expressions with their prognostic value and the recently-estab- lished intrinsic claudin-low subtype together underline the importance of the role of tight junction molecules in neoplastic transformation and the prognosis of breast cancer. Therefore, a systematic analysis of junctional protein families (CLDN and also cadherins) might be of prominent relevance. In the present study, we identified tight junction family molecules capable of acting as prognostic biomarkers in breast cancer.
Materials and Methods
Breast cancer datasets. Anin silicoanalysis of publicly-avail- able microarray data from 13 datasets was performed in the first line.(20–32) The refined and established database was based on the gene expression data (Affymetrix human genome unigene [HGU]133A and HGU133 + 2 microarrays only), and survival information of 1809 patients downloaded from gene expression omnibus (GEO) (Table 1).(33) The expression data of CDH-1, CLDN-1,-3–11, and-14–18were analyzed. All available probes were used for the analysis, excluding those that were not reliable across datasets (average expression <100, and maximal expres- sion <500 of micro array suite [MAS]-5-normalized value). The signature containing the average score for all of the abovemen- tioned CLDN and E-cadherin expression data was assigned as the complex junctional signature (CJS).
Breast cancer samples. The study was approved by the Insti- tutional Review Board of Semmelweis University (Budapest, Hungary).
A training cohort of 197 selected breast carcinomas diagnosed between 1982 and 2007 with known relapse, and cases with no recurrence of disease on long-term follow-up, was
8To whom correspondence should be addressed. E-mail: kj@korb2.sote.hu
set up (Table 1). Selected cases of formalin-fixed and paraffin-embedded (FFPE) tissues underwent histological re-examination, and regions of interests were marked for core punching. According to the diagnostic reports, which interpreted the immunophenotype as a surrogate of the molecular subtype, there were 98 luminal A, 41 luminal B, 20 HER-2-positive, and 38 triple-negative breast cancer (TNBC) tumors (Fig. S1).
The expression of CLDN-1–5, -7, and E-cadherin proteins were evaluated by immunohistochemistry (IHC).
The validation cohort consisted of 387 unselected breast can- cer samples diagnosed between 1999 and 2002 (Table 1). Of these, 148 (38.2%) received anthracycline- or taxane-based che- motherapy, and 101 additionally received irradiation (68.2%).
Of the remaining 239 patients undergoing surgical resection without chemotherapy, 112 (46.8%) received radiotherapy.
Recurrence-free survival curves according to histological type, grade, and molecular subtype are shown in Figure S1. The sam- ples were analyzed for CLDN-4 and E-cadherin protein expres- sion in the same fashion as the training set.
The tumors were previously classified during routine patho- logical examination into luminal A (estrogen receptor [ER]- and progesterone receptor [PgR]-expressing tumors with <20% Ki67 index and epidermal growth factor receptor-2 [HER-2] negativ- ity), luminal B (ER- or PgR- and HER-2-expressing tumors, and ER- and PgR-expressing carcinomas with more than 20% Ki67 index), HER-2 (ER- and PgR-negative and HER-2 expression of 3+ at IHC or amplified by FISH evaluation when the IHC score was 2+), and TNBC (no expression of ER, PgR, or HER-2, nor amplification of the latter with FISH) groups.(34)
Tissue microarray construction. Tissue microarray construc- tions (TMA) of all FFPE tumors were composed with the TMA builder instrument (Histopathology, Pe´cs, Hungary). The cores were 2 mm, in diameter and all the samples were investigated in duplicates.
Immunohistochemistry. The IHC reactions were performed on 4lm-thick sections obtained from the TMA blocks. After deparaffinization, the slides were heated in a microwave oven in target retrieval solution (DAKO, Carpinteria, CA, USA) for 30 min. The automated Ventana ES immunostainer system was used according to the protocol provided by the manufacturer (Ventana Medical Systems, Tucson, AZ, USA). The E-cadherin and CLDN antibodies were used as follows: CLDN-1 (cat. no.
18-7362; Zymed, South San Francisco, CA, USA) at 1:80, )2 (cat. no. 18-7363; Zymed) at 1:80,)3 (cat. no. 34-1700; Zymed) at 1:80,)4 (cat. no. 18-7341; Zymed) at 1:100,)5 (cat. no. 18- 7364; Zymed) at 1:120;)7 (cat. no. 34-9100; Zymed) at 1:100,
and E-cadherin (cat. no. M3612; DAKO) at 1:100. The tissues were counterstained with Mayer’s hemalaun (00-8011; Zymed).
Positive controls and negative control tissues were applied in all IHC runs.
Immunohistochemistry evaluation. The immunohistochemical reactions were considered positive when the CLDN (except CLDN-2, which was granular cytoplasmic, predominantly sub- membranous) and E-cadherin were expressed at the cell mem- branes (Fig. S2). Claudin-5 was not only expressed in the tumor cells, but in the endothelial cells as well. The stained slides were digitalized with a slide scanner (Mirax Scan; 3DHistech, Buda- pest, Hungary), and the intensity of the reaction (0, negative reaction; +1, weak positivity; +2, moderate positivity; and +3, strong reaction) and the frequency of positive cells (1, 0–5%; 2,
>5–10%; 3, >10–20%; 4, >20–33%; 5, >33–50%; 6, >50–66%;
7, >66–80%; and 8, >80–100%) were integrated into a scoring system using TMA module software (version 11.49; 3DHistech) resulting in a numerical variable (range: 0–11) consisting of the sum of the intensity and frequency scores above. The indices were created from the arithmetic means of the respective CLDN and E-cadherin.
Statistics. The analyses for the datasets were performed in the R statistical environment (R version 2.10.1; R Foundation for Statistical Computing, Vienna, Austria) using the prediction analysis of microarrays (PAM) (version 2.19; Stanford Univer- sity Labs, Stanford, CA, USA).(35)The PAM uses soft threshold- ing to produce a shrunken centroid, which allows the selection of genes with high predictive potential. This made it possible to derive the simplified junctional signature (SJS) from the CJS, including all investigated mRNA transcripts. The data analysis and the statistical evaluation of tissue samples were performed with the SPSS 15.0 Family Pack (SPSS, Chicago, IL, USA). In the training cohort, all proteins were included in the first analy- sis testing the complex junctional profile (CJP). The latter score was reached when considering all scores of all proteins, and tak- ing their arithmetic average as a numerical variable. All individ- ual values of the distinct scores of IHC were included in the statistical evaluation. The Mann–WhitneyU-test was performed for non-parametric statistical analyses. Hierarchical clustering was used to rank the protein expression data according to their contribution to the identification of prognostic groups. Similar to the gene expression signature, this helped to define those pro- teins (simplified junctional profile [SJP]) that were able to define the prognostic subgroups by themselves. Combining the over- lapping members of the gene and protein expression methods resulted in the claudin-4 and e-cadherin score (CURIO), which
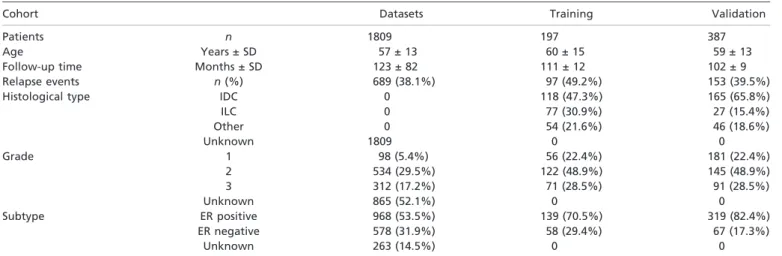
Table 1. Clinicopathological characteristics of the patients and tumor samples used in the study
Cohort Datasets Training Validation
Patients n 1809 197 387
Age Years ± SD 57 ± 13 60 ± 15 59 ± 13
Follow-up time Months ± SD 123 ± 82 111 ± 12 102 ± 9
Relapse events n(%) 689 (38.1%) 97 (49.2%) 153 (39.5%)
Histological type IDC 0 118 (47.3%) 165 (65.8%)
ILC 0 77 (30.9%) 27 (15.4%)
Other 0 54 (21.6%) 46 (18.6%)
Unknown 1809 0 0
Grade 1 98 (5.4%) 56 (22.4%) 181 (22.4%)
2 534 (29.5%) 122 (48.9%) 145 (48.9%)
3 312 (17.2%) 71 (28.5%) 91 (28.5%)
Unknown 865 (52.1%) 0 0
Subtype ER positive 968 (53.5%) 139 (70.5%) 319 (82.4%)
ER negative 578 (31.9%) 58 (29.4%) 67 (17.3%)
Unknown 263 (14.5%) 0 0
ER, estrogen receptor; IDC, invasive ductal carcinoma; ILC, invasive lobular carcinoma; SD, standard deviation.
was tested to predict survival in the validation cohort. The con- tribution of expression data to predict relapse-free survival (RFS), distant metastasis-free survival (DMFS), and overall survival (OS) was displayed according to the Kaplan–Meier method, and statistically supported with log–rank test. For the multivariate analysis, the Cox regression method was applied.
P-values of <0.05 were considered to be statistically significant.
Results
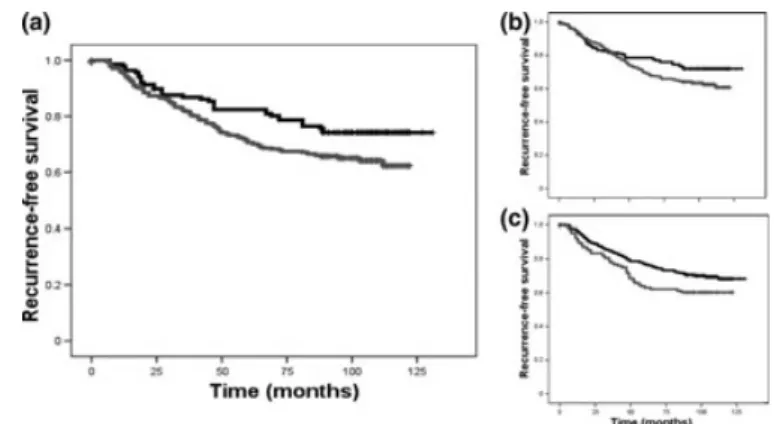
Claudin and E-cadherin mRNA expression in the public dataset- based training set. First, a CJS was used, including the average expression of the following genes:CDH-1,CLDN-1,-3–11, and -14–18(Fig. 1a). The predictive value of the CJS was significant in all the prognostic estimate aspects (P⁄RFS⁄ = 2.4E-07, P⁄DMFS⁄ = 0.0064, andP⁄OS⁄ = 0.00041).
To further refine our analysis, the top genes were ranked based on their centroid plots (displaying the contribution of genes to the definition of prognostic subgroups in order of their strength), resulting in a more powerful predictive capacity for outcome. Based on the average expression ofCDH-1,CLDN-3, -4, and-7, this SJS has performed as follows (P⁄RFS⁄ = 5.1E- 10,P⁄DMFS⁄ = 0.00041, andP⁄OS⁄ = 0.00018). The elevated expression (median <) of mRNA resulted in poor outcomes, as compared to the lower expression (< median) of this signature (Fig. 1b). Of note, these genes have the best estimated quality of the probe set (average expression >500 MAS-5-normalized value), as compared to other CLDN genes.
The database rendered feasible to test the SJS signature in the ER-positive and ER-negative patient cohorts separately. The SJS signature was predictive for DMFS in the ER-positive group (P= 0.043), especially in the ER-positive, lymph node (LN)- negative subgroup (P= 0.010). When considering ER-negative cancers, the SJS performed even better; it was able to predict RFS and DMFS in the ER-negative group (P⁄RFS⁄ = 0.0037 and P⁄DMFS⁄ = 0.0052), and even in the ER-negative, LN-negative subgroup (P⁄RFS⁄ = 0.0087;P⁄DMFS⁄ = 0.013).
The sample number was too low for meaningful analysis in the ER-negative, LN-positive group (Fig. S3).
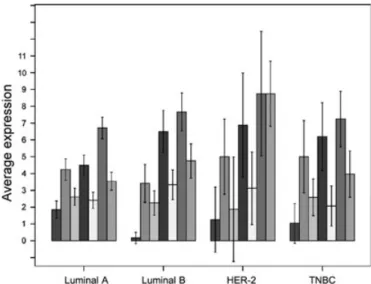
Expression of CLDN proteins in breast cancer intrinsic subtypes in our tissue-based training set. The expression of E-cadherin and the CLDN-1–5 and -7 proteins was examined in breast car- cinomas, according to previously-defined subtypes. The expres- sion of CLDN-1 was lowest in the luminal B subtype, and CLDN-4 was less expressed in luminal A cancers. E-cadherin showed the highest expression among HER-2+ tumors (Fig. 2).
There was no single marker distinguishing TNBC from other subgroups (Fig. 3).
Claudin proteins distinguish prognostic groups in the training set of breast cancers based on IHC. In line with bioinformatics, we investigated the expression of E-cadherin and the CLDN-1–
5 and -7 proteins in our breast carcinoma cases to test their rele- vance as prognostic factors. All scores of the evaluated proteins were included in the index signature (CJP), reflecting the aver- age of all individual expression values. Groups were created at the median level of the combined scores (P= 0.006; Fig. 4a).
In the next step, the CJP was investigated for its main drivers.
The proteins were ranked according to their contribution to the
Fig. 1. (a) Kaplan–Meier curve showing the distinguished groups according to expression of the complex junctional signature in the datasets. (b) Curve showing the distinguished groups according to the expression of the simplified junctional signature in the datasets. ( ) Gene_expression = 0, ( ) gene_expression = 1.
Fig. 2. Expression of claudin-1–5, -7, and E-cadherin in subtypes of breast cancer, and expression of claudins in intrinsic breast cancer subtypes luminal-1. HER-2, human epidermal growth factor receptor- 2; TNBC, triple-negative breast cancer. ( ) Claudin-1, ( ) claudin-2, ( ) claudin-3, ( ) claudin-4, ( ) claudin-5, ( ) claudin-7, ( ) E-cadherin.
CJP with hierarchical clustering (Fig. S4). The analysis revealed that the CLDN-2, -4, and E-cadherin protein expressions aver- aged were able to distinguish between poor versus good prog- nostic groups with similar confidence as the CJP, resulting in an SJP (P= 0.007). All components were able to distinguish prog- nostic subgroups by themselves (Fig. S5), but none performed as good as the SJP (Fig. 4b).
Identification and validation of CURIO based on correlation to survival in an independent cohort. We were able to select the SJSin silicobased on the combined mRNA expression ofCDH- 1,CLDN-3,-4, and-7for a robust prediction of outcome. This overlaps with the training cohort-defined protein expression- based SJP consisting of CLDN-2, -4, and E-cadherin. Thus, we aimed to validate the score-designated CURIO in an indepen- dent cohort of 387 patients.
Separated at the median, the CURIO was able to show stron- ger predictive power for RFS (hazard ratio [HR] = 1.51, 95%
confidence interval [CI]: 1.04–2.19,P= 0.029; Fig. 5) than the expression of CLDN-4 and E-cadherin individually (HR = 1.43, 95% CI: 1.02–2.03,P= 0.038, and HR = 1.39, 95% CI: 1.01–
1.90,P= 0.039, respectively).
Next, the treatment data were correlated to CURIO. None of the chemotherapy or radiotherapy data showed a correlation with CURIO based on the chi-square test (Pearson’s v2-test:
0.822, P= 0.191; Pearson’s v2-test: 5.124, P= 0.346, respec- tively). To support this, the treatment groups underwent further analysis: tumors with no treatment following surgery, either radiotherapy or chemotherapy, or both radiotherapy or chemo- therapy following surgical removal of the tumor, were sepa- rately tested for impact of the CURIO on prognosis. All the treatment groups showed the expected trend, although they did not turn out to be significant in either comparison (Fig. S6).
Cox multivariate regression analysis was performed, consider- ing the CURIO, grade, vascular invasion, necrosis, lymph node
status, and subtype. In the pretest, the CURIO was correlated with tumor size (P= 0.040), histological type (P= 0.001), and Not- tingham Prognostic Index (NPI) (P= 0.004) withv2-test analy- sis, thus these variables were omitted from the Cox multivariate regression test. The CURIO, vascular invasion, and intrinsic sub- type kept their predictive power after this analysis (Table 2).
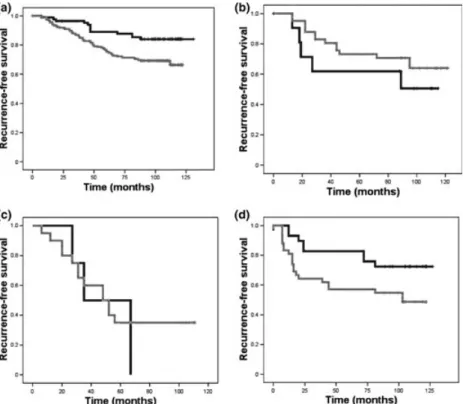
Performance of CURIO in the distinct intrinsic subtypes of the validation cohort. The CURIO was predictive for prognosis in luminal A breast tumors, showing the expected distribution of high expression, that is, worse prognosis (P= 0.006). In luminal B tumors, the trend was opposite: the higher expression value of the CURIO resulted in a better outcome, as compared to the lower expression split at the median again (Fig. 6), but the result was not significant (P= 0.198).
In the ER-negative subtypes, the CURIO did not provide any information on the outcome of HER-2-positive tumors (P= 0.547), while in TNBC, the same effect was seen as in the majority of cases; the lower CURIO value resulted in better outcome measures (P= 0.047).
Discussion
In the present study, we identified a signature (SJS) based on the expression of selected CLDN and E-cadherin in datasets con- taining mRNA expression data of 1809 breast cancer patients.(33) In a separate cohort of 197 patients using protein expression on TMA, we identified a similar index (SJP) overlapping with SJS.
Regarding the defined signature at the mRNA level,CLDN-3, -4,-7, andE-cadherinhave been identified by others at the same time as the present study was conducted,(1,4) emphasizing the role of these molecules’ expression in the prognosis of breast cancer. One has to note that these genes have the best estimated quality of the probe set, as compared to the CLDN genes, thus the selection might has technical origin.
Fig. 3. Expression of claudins in intrinsic breast cancer subtypes Luminal A and B 2. Significance levels of comparison based on the Mann–WhitneyU-test of the expressed claudins between the breast cancer subtypes. HER-2, human epidermal growth factor receptor-2; TNBC, triple-negative breast cancer.
The SJS was able to predict DMSF and its predictive power, even improved in ER-positive lymph node negative tumors. In the ER-negative group, the signature provided almost the same performance, predicting RFS and showing DMFS tendency. The same was true for the ER-negative, LN-negative cancers, although the lower number of ER-negative tumors did not make a complete analysis feasible. Therefore, analyses in an even lar- ger dataset are needed, because most HER-2-positive and TNBC tumors had high expression of these molecules in this analysis, which in the majority of cases, results in poor prognosis. Also regarding claudin-low tumors, a significantly larger number of patients need to be investigated in depth for CLDN tumor expression. Recent studies also focus on ER-negative carcino- mas to define their prognosis and to predict their response to treatment. Human epidermal growth factor receptor-2 amplified breast cancer has become the representative of targeted cancer therapy.(36) The results showed that triple-negative carcinomas
show the best response to chemotherapeutical agents(37) and came into focus in search of tailored therapeutic approaches (platinum agents and poly[ADP-ribose] polymerase [PARP]
inhibitors) and diagnostic key markers (e.g. CLDN).(1,38,39) In tissue-based investigations, there is a frequent discrepancy between reports regarding CLDN expression.(15–18,40) In this analysis, we investigated the expression of CLDN and E-cadher- in for breast cancer intrinsic subtypes. In 197 cases representing all subtypes reflected by IHC characterization, CLDN-1 was expressed predominantly in luminal A tumors, while CLDN-4 and E-cadherin tended to be expressed in ER-negative (HER-2 and TNBC) tumors at a higher level. The TNBC tumors seem to form a heterogenous group, according to CLDN expression. In our training cohort, we found that CLDN-2, -4, and E-cadherin expressions were the most powerful profile to predict the time of RFS, which was similar to earlier studies.
The CURIO, the combination of CLDN-4 and E-cadherin, was predictive for prognosis in general, according to high expression, that is, worse prognosis, and lower expression, resulting in a better outcome, especially in luminal A cases.
Additionally, TNBC might not only be heterogeneous according to the CLDN expression, but there is a group among the luminal tumors that might show the characteristics of claudin-low tumors. This might shed light on a previously described sub- group of luminal tumors, which did not detach themselves in repeated observations,(41)and shared features with triple-nega- tive and HER-2-amplified breast tumors.(42) In HER-2-positive tumors, the CURIO did not provide any information on out- come, while in TNBC, surprisingly, the same effect was seen as in the majority of cases; a lower CURIO resulted in better out- come measures. Thus, we suggest that with the addition of
Fig. 4. (a) Kaplan–Meier curve showing the distinguished groups according to expression of the complex junctional profile in the tissue samples. (b) Curve showing the distinguished groups according to expression of the simplified junctional profile in the tissue samples.
( ) Low (< median), ( ) high (< median).
Fig. 5. (a) Kaplan–Meier curve showing the distinguished groups according to expression of the claudin-4 and E-cadherin score in the tissue samples. (b) Kaplan–Meier estimates of E-cadherin on relapse- free survival. (c) Kaplan–Meier graph of claudin-4 expression predictive of relapse-free survival. ( ) Low (< median), ( ) high (< median).
Table 2. Results of the Cox multivariate analysis with hazard ratios (HR) and 95% confidence intervals (CI)
Parameter P-value HR 95% CI
Lower Upper
CURIO 0.040 1.503 1.02 2.216
Subtype 0.001 1.064 0.59 1.918
Vascular invasion 0.011 0.704 0.31 1.808
Lymph node mets 0.091 0.791 0.6 1.038
Grade 0.767 1.037 0.82 1.32
Necrosis 0.232 2.233 0.72 8.435
CURIO, claudin-4 and E-cadherin score.
CLDN-4 and E-cadherin IHC, the prognosis of breast cancer can be further refined in the routine setting.
There are two major advances of the CURIO over the vari- ables (grade, vascular invasion, necrosis, lymph node status, and subtype). First, these variables depend on the pathologi- cal examination of the tissue, second, their examination is less objective than the CURIO.(43)Evaluation of IHC is semi- quantitative; therefore, we position the CURIO in between the interobserver variable clinicopathological classifiers and the microarray⁄PCR-based, more objective tests, especially for those practices with limited resources.
As chemotherapeutical and radiotherapeutic treatment data were available, the CURIO was also tested in treatment groups.
Although this comparison could show that the score might be prognostic in all the different treated cohorts, a study with a larger number of patients needs to evaluate this question; this is a limitation of the study.
Numerous parameters were implicated in the prediction of breast cancer prognosis. We slowly start to understand that the picture is extensively complicated: a certain factor and its rela- tion to a biological function and prognosis can only be used under certain circumstances (e.g. different prognostic informa-
tion according to intrinsic subtype of breast cancer). The classi- fication of tumors based on expression signatures and marker profiles can help us to understand the diversity of neoplastic disease and change a paradigm in our concept regarding breast cancer.
Acknowledgments
The study was supported by the following grants: ETT-049⁄2006 and OTKA-49559⁄2005. AMSz was supported by the Roszto´czy Foundation and TA´ MOP.4.2.1.B-09⁄1⁄KMR-2010-0001 grant. The study sponsors had no role in the study design; the collection, analysis, and interpreta- tion of data; the writing of the manuscript; and in the decision to submit the manuscript for publication. The authors thank the useful comments of Dr Jo´zsef Tı´ma´r. The authors are also grateful for the kind help from Erzsebet Azumah, Magdolna Peka´r, and Erika Samodai in the prepara- tion of slides and immunohistochemistry.
Disclosure Statement
There is no financial or personal interest in relation to the work described.
References
1 Herschkowitz JI, Simin K, Weigman VJ et al. Identification of conserved gene expression features between murine mammary carcinoma models and human breast tumors.Genome Biol2007;8: R76.
2 Creighton CJ, Li X, Landis Met al.Residual breast cancers after conventional therapy display mesenchymal as well as tumor-initiating features.Proc Natl Acad Sci USA2009;106: 13820–5.
3 Hennessy BT, Gonzalez-Angulo AM, Stemke-Hale Ket al.Characterization of a naturally occurring breast cancer subset enriched in epithelial-to- mesenchymal transition and stem cell characteristics.Cancer Res2009;69:
4116–24.
4 Prat A, Parker J, Karginova O et al. Phenotypic and molecular characterization of the claudin-low intrinsic subtype of breast cancer.Breast Cancer Res2010;12: R68.
5 Lehr HA, Folpe A, Yaziji H, Kommoss F, Gown AM. Cytokeratin 8 immunostaining pattern and E-cadherin expression distinguish lobular from ductal breast carcinoma.Am J Clin Pathol2000;114: 190–6.
6 Hashizume R, Koizumi H, Ihara A, Ohta T, Uchikoshi T. Expression of beta- catenin in normal breast tissue and breast carcinoma: a comparative study with epithelial cadherin and alpha-catenin.Histopathology1996;29: 139–46.
7 De Leeuw WJ, Berx G, Vos CBet al.Simultaneous loss of E-cadherin and catenins in invasive lobular breast cancer and lobular carcinoma in situ.
J Pathol1997;183: 404–11.
Fig. 6. Kaplan–Meier curve showing the prognostic groups according to the expression of the claudin-4 and E-cadherin score in the luminal A (a), luminal B (b), human epidermal growth factor receptor-2 (HER-2) (c), and triple-negative breast cancer (d) subtypes. ( ) Low (< median), ( ) high (< median).
8 Karayiannakis AJ, Nakopoulou L, Gakiopoulou H, Keramopoulos A, Davaris PS, Pignatelli M. Expression patterns of beta-catenin inin situand invasive breast cancer.Eur J Surg Oncol2001;27: 31–6.
9 Mastracci TL, Tjan S, Bane AL, O’Malley FP, Andrulis IL. E-cadherin alterations in atypical lobular hyperplasia and lobular carcinomain situof the breast.Mod Pathol2005;18: 741–51.
10 Kuroda H, Tamaru J, Takeuchi Iet al. Expression of E-cadherin, alpha- catenin, and beta-catenin in tubulolobular carcinoma of the breast.Virchows Arch2006;448: 500–5.
11 Furuse M, Fujita K, Hiiragi T, Fujimoto K, Tsukita S. Claudin-1 and -2: novel integral membrane proteins localizing at tight junctions with no sequence similarity to occludin.J Cell Biol1998;141: 1539–50.
12 Hewitt KJ, Agarwal R, Morin PJ. The claudin gene family: expression in normal and neoplastic tissues.BMC Cancer2006;6: 186.
13 Kulka J, Tokes AM. Claudin expression in breast tumors.Hum Pathol2005;
36: 859; author reply 60.
14 Morohashi S, Kusumi T, Sato Fet al. Decreased expression of claudin-1 correlates with recurrence status in breast cancer.Int J Mol Med2007;20:
139–43.
15 Tokes AM, Kulka J, Paku Set al.Claudin-1, -3 and -4 proteins and mRNA expression in benign and malignant breast lesions: a research study.Breast Cancer Res2005;7: R296–305.
16 Kulka J, Szasz AM, Nemeth Zet al. Expression of tight junction protein claudin-4 in basal-like breast carcinomas.Pathol Oncol Res2009;15: 59–64.
17 Kominsky SL, Argani P, Korz Det al. Loss of the tight junction protein claudin-7 correlates with histological grade in both ductal carcinomain situ and invasive ductal carcinoma of the breast.Oncogene2003;22: 2021–33.
18 Sauer T, Pedersen MK, Ebeltoft K, Naess O. Reduced expression of claudin-7 in fine needle aspirates from breast carcinomas correlate with grading and metastatic disease.Cytopathology2005;16: 193–8.
19 Martin TA, Harrison GM, Watkins G, Jiang WG. Claudin-16 reduces the aggressive behavior of human breast cancer cells.J Cell Biochem2008;105:
41–52.
20 Bos PD, Zhang XH, Nadal C et al. Genes that mediate breast cancer metastasis to the brain.Nature2009;459: 1005–9.
21 Desmedt C, Giobbie-Hurder A, Neven Pet al.The Gene Expression Grade Index: a potential predictor of relapse for endocrine-treated breast cancer patients in the BIG 1-98 trial.BMC Med Genomics2009;2: 40.
22 Desmedt C, Piette F, Loi Set al. Strong time dependence of the 76-gene prognostic signature for node-negative breast cancer patients in the TRANSBIG multicenter independent validation series.Clin Cancer Res2007;
13: 3207–14.
23 Ivshina AV, George J, Senko Oet al.Genetic reclassification of histologic grade delineates new clinical subtypes of breast cancer.Cancer Res2006;66:
10292–301.
24 Loi S, Haibe-Kains B, Desmedt C et al. Definition of clinically distinct molecular subtypes in estrogen receptor-positive breast carcinomas through genomic grade.J Clin Oncol2007;25: 1239–46.
25 Loi S, Haibe-Kains B, Desmedt Cet al.Predicting prognosis using molecular profiling in estrogen receptor-positive breast cancer treated with tamoxifen.
BMC Genomics2008;9: 239.
26 Miller LD, Smeds J, George Jet al.An expression signature for p53 status in human breast cancer predicts mutation status, transcriptional effects, and patient survival.Proc Natl Acad Sci USA2005;102: 13550–5.
27 Minn AJ, Gupta GP, Padua D et al. Lung metastasis genes couple breast tumor size and metastatic spread.Proc Natl Acad Sci USA2007;104: 6740–5.
28 Pawitan Y, Bjohle J, Amler Let al.Gene expression profiling spares early breast cancer patients from adjuvant therapy: derived and validated in two population-based cohorts.Breast Cancer Res2005;7: R953–64.
29 Schmidt M, Bohm D, von Torne Cet al.The humoral immune system has a key prognostic impact in node-negative breast cancer.Cancer Res2008;68:
5405–13.
30 Sotiriou C, Wirapati P, Loi Set al.Gene expression profiling in breast cancer:
understanding the molecular basis of histologic grade to improve prognosis.
J Natl Cancer Inst2006;98: 262–72.
31 Wang Y, Klijn JG, Zhang Yet al.Gene-expression profiles to predict distant metastasis of lymph-node-negative primary breast cancer.Lancet2005;365:
671–9.
32 Zhang Y, Sieuwerts AM, McGreevy Met al.The 76-gene signature defines high-risk patients that benefit from adjuvant tamoxifen therapy.Breast Cancer Res Treat2009;116: 303–9.
33 Gyo¨rffy B, Lanczky A, Eklund Aet al.An online survival analysis tool to rapidly assess the effect of 22,277 genes on breast cancer prognosis using microarray data of 1,809 patients.Breast Cancer Res Treat2009;123: 725–
31.
34 Colleoni M, Rotmensz N, Peruzzotti Get al.Minimal and small size invasive breast cancer with no axillary lymph node involvement: the need for tailored adjuvant therapies.Ann Oncol2004;15: 1633–9.
35 Tibshirani R, Hastie T, Narasimhan B, Chu G. Diagnosis of multiple cancer types by shrunken centroids of gene expression.Proc Natl Acad Sci USA 2002;99: 6567–72.
36 Ross JS, Fletcher JA. The HER-2⁄neu oncogene in breast cancer: prognostic factor, predictive factor, and target for therapy.Oncologist1998;3: 237–52.
37 Liedtke C, Mazouni C, Hess KRet al.Response to neoadjuvant therapy and long-term survival in patients with triple-negative breast cancer.J Clin Oncol 2008;26: 1275–81.
38 Fong PC, Boss DS, Yap TAet al.Inhibition of poly(ADP-ribose) polymerase in tumors from BRCA mutation carriers.N Eng J Med2009;361: 123–34.
39 Silver DP, Richardson AL, Eklund ACet al.Efficacy of neoadjuvant cisplatin in triple-negative breast cancer.J Clin Oncol2010;28: 1145–53.
40 Lanigan F, McKiernan E, Brennan DJet al.Increased claudin-4 expression is associated with poor prognosis and high tumour grade in breast cancer.Int J Cancer2009;124: 2088–97.
41 Sorlie T, Tibshirani R, Parker Jet al.Repeated observation of breast tumor subtypes in independent gene expression data sets.Proc Natl Acad Sci USA 2003;100: 8418–23.
42 Sorlie T, Perou CM, Tibshirani Ret al.Gene expression patterns of breast carcinomas distinguish tumor subclasses with clinical implications.Proc Natl Acad Sci USA2001;98: 10869–74.
43 Paik S, Shak S, Tang Get al. A multigene assay to predict recurrence of tamoxifen-treated, node-negative breast cancer. N Engl J Med2004;351:
2817–26.
Supporting Information
Additional Supporting Information may be found in the online version of this article:
Fig. S1.Recurrence-free survival curves according to histology, grade, and intrinsic subtype are shown in the training and validation cohort of patient samples.
Fig. S2.Immunostaining for E-cadherin and claudin-4.
Fig. S3.Kaplan–Meier graphs showing the simplified tight junction signature’s performance in the prediction of relapse-free, overall, and distant metastasis-free survival.
Fig. S4.Hierarchical clustering showing the contribution of the investigated proteins to the delineation of breast cancer cohorts.
Fig. S5.Kaplan–Meier graphs of the groups defined by the expression (below and above median) of evaluated claudin and E-cadherin proteins, individually.
Fig. S6.Performance of the claudin-4 and E-cadherin score on Kaplan–Meier graphs in the breast cancer groups with different oncological treat- ment.
Please note: Wiley-Blackwell are not responsible for the content or functionality of any supporting materials supplied by the authors. Any queries (other than missing material) should be directed to the corresponding author for the article.
![confidence interval [CI]: 1.04–2.19, P = 0.029; Fig. 5) than the expression of CLDN-4 and E-cadherin individually (HR = 1.43, 95% CI: 1.02–2.03, P = 0.038, and HR = 1.39, 95% CI: 1.01–](https://thumb-eu.123doks.com/thumbv2/9dokorg/1368943.112040/4.892.222.678.59.491/confidence-interval-ci-fig-expression-cldn-cadherin-individually.webp)