R E S E A R C H Open Access
A genome-wide approach to link genotype to clinical outcome by utilizing next
generation sequencing and gene chip data of 6,697 breast cancer patients
Lőrinc Pongor1,2, Máté Kormos1, Christos Hatzis3, Lajos Pusztai3, András Szabó2and Balázs Győrffy1,2,4*
Abstract
Background:The use of somatic mutations for predicting clinical outcome is difficult because a mutation can indirectly influence the function of many genes, and also because clinical follow-up is sparse in the relatively young next generation sequencing (NGS) databanks. Here we approach this problem by linking sequence databanks to well annotated gene-chip datasets, using a multigene transcriptomic fingerprint as a link between gene mutations and gene expression in breast cancer patients.
Methods:The database consists of 763 NGS samples containing mutational status for 22,938 genes and RNA-seq data for 10,987 genes. The gene chip database contains 5,934 patients with 10,987 genes plus clinical characteristics. For the prediction, mutations present in a sample are first translated into a ‘transcriptomic fingerprint’ by running ROC analysis on mutation and RNA-seq data. Then correlation to survival is assessed by computing Cox regression for both up- and downregulated signatures.
Results: According to this approach, the top driver oncogenes having a mutation prevalence over 5 % included AKT1, TRANK1, TRAPPC10, RPGR, COL6A2, RAPGEF4, ATG2B, CNTRL, NAA38, OSBPL10, POTEF, SCLT1, SUN1, VWDE, MTUS2, and PIK3CA, and the top tumor suppressor genes included PHEX, TP53, GGA3, RGS22, PXDNL, ARFGEF1, BRCA2, CHD8, GCC2, and ARMC4. The system was validated by computing correlation between RNA-seq and microarray data (r2= 0.73, P< 1E-16). Cross-validation using 20 genes with a prevalence of approximately 5 % confirmed analysis reproducibility.
Conclusions: We established a pipeline enabling rapid clinical validation of a discovered mutation in a large breast cancer cohort. An online interface is available for evaluating any human gene mutation or
combinations of maximum three such genes (http://www.g-2-o.com).
Background
Tumor evolution involves the accumulation of muta- tions during tumorigenesis enabling acquisition of the well-known hallmarks of cancer [1]. Current anticancer therapy presupposes a direct connection between muta- tional status and phenotype, therefore clinical decisions are often directly based on the genotype. For instance, KRAS status is considered an indicator of a patient’s
response to the EGFR inhibitor panitumumab [2] and BRAF V600E status is used to predict response to the BRAF inhibitor vemurafenib [3]. However, such direct associations are not consistent among different clinical cohorts. For instance, vemurafenib was effective in BRAF V600E mutant melanoma but had no activity in BRAF V600E mutant colon cancer [4]. Similarly, mTOR and PI3K inhibitors have the same activity in PI3K mutant and normal breast tumors [5]. Also, the recently approved CDK4/6 inhibitor palbociclib had the same level of activity in breast tumors harboring altered and normal CDK4/6 [6].
* Correspondence:gyorffy.balazs@ttk.mta.hu
1MTA TTK Lendület Cancer Biomarker Research Group, Research Centre for Natural Sciences, Magyar tudósok körútja 2, Budapest H-1117, Hungary
22nd Department of Pediatrics, Semmelweis University, Budapest, Hungary Full list of author information is available at the end of the article
© 2015 Pongor et al.Open AccessThis article is distributed under the terms of the Creative Commons Attribution 4.0 International License (http://creativecommons.org/licenses/by/4.0/), which permits unrestricted use, distribution, and reproduction in any medium, provided you give appropriate credit to the original author(s) and the source, provide a link to the Creative Commons license, and indicate if changes were made. The Creative Commons Public Domain Dedication waiver (http://creativecommons.org/publicdomain/zero/1.0/) applies to the data made available in this article, unless otherwise stated.
The first NGS studies of breast cancer (BC) identified only three genes mutated in more than 10 % of BC tu- mors: TP53 (mutation rate 40 % of tumors), PI3K (25 % of tumors), and GATA3 (10 % of tumors). In particular, the most important genes identified in 100 primary breast cancers included AKT1, BRCA1, CDH1, GATA3, PIK3CA, PTEN, RB, TP53, ARID1B, CASP8, and MAP3K1 [7]. Banerji and coworkers studied 103 BC pa- tients with NGS and recognized AKT1, PIK3CA, GATA3, TP53, and MAP3K1 as the most significant genes [8]. In the TCGA project, the most prevalent mu- tations hit PIK3CA, PTEN, AKT1, TP53, GATA3, CDH1, RB1, MLL3, MAP3K1, and CDKN1B [9]. Ellis and associates performed NGS on biopsies from two neoadjuvant aromatase inhibitor clinical trials and found PIK3CA, TP53, GATA3, CDH1, RB1, MLL3, MAP3K1, and CDKN1B to be the primary genes affected [10].
Despite differences in study design, these studies have a few common messages. First of all, NGS for a few hun- dreds of breast tumors has revealed new cancer genes.
Additionally, NGS allowed the survey of intratumoral heterogeneity and has shown that there was always a dominant clone comprising at least 50 % of the tumor cells [11]. Therapeutically targeting the driver genetic aberrations will have the most significant effect on this clone. Targeted NGS in primary and metastatic breast cancers revealed that almost 85 % of tumors have a gen- etic aberration in a gene which is already actionable [12].
We must, however, note that some of the most import- ant genes including TP53 and KRAS are not yet directly targetable.
The relationship between somatic mutations and clin- ical outcome is multi-layered, complex, and to a large extent unknown, therefore the assumption of a direct in- fluence of genotype on phenotype is a key limitation in the generally accepted paradigm. An empirical analysis to associate sequence variations to outcome would need thousands of patients with sufficient follow up to be se- quenced with next generation sequencing (NGS) tech- nologies. We are far from this desirable goal. For instance, among the patients included in the Cancer Genome Atlas (TCGA) [13] – the largest breast cancer NGS database available today – approximately 89 % of the patients are censored. While one can expect fewer events because TCGA reports overall survival only, but this is coupled with a median follow up of merely 1.3 years.1Thus, the paucity of clinical annotation of the TCGA and other mutation datasets makes direct testing of the prognostic impact both limited and underpowered especially if one is interested in survival differences in selected sub-cohorts of patients.
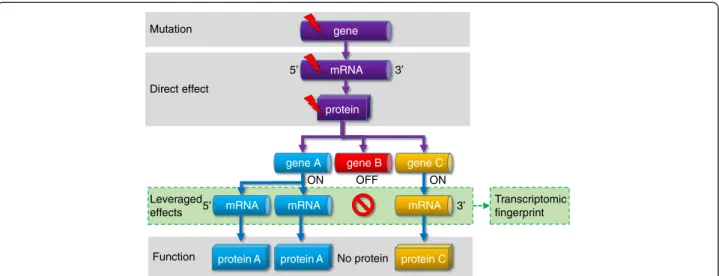
Here we propose an approach that could circumvent this limitation. We postulate that a somatic mutation perturbs not only the mutated gene but the perturbation
will propagate to a network of functionally related genes from the same or other cellular pathways. As a result, the effect of the mutation will be leveraged by a set of genes, and the changes in the expression of these genes that we term a ‘transcriptomic fingerprint’ can be used as a surrogate marker of the mutation status (Fig. 1).
Naturally, the genes indirectly affected by a mutation are unknown, but can be inferred by statistical means if there are sufficient data available. As we have recently shown, genome-wide transcriptomic analysis across all genes can identify genes affected by a given mutation [14]. In brief, a large number of patients with known genotype are divided into two cohorts (those with muta- tions in a given gene or wild type), and transcripts associ- ated with mutational status are identified by ROC analysis across all genes. These genes can then be evaluated for correlation with clinical outcome including therapy re- sponse [14].
In the present work we extend this analysis to predict the probability of patient survival from mutational data of breast cancer patients. As already mentioned, there is a growing body of samples with both mutation and gene expression data, but only a few datasets include relapse events on the same patients. At the same time, micro- array (gene chip) data have been collected that have sub- stantially longer follow up times and extensive clinical annotations. Harvesting the combined prognostic value of these two kinds of data is a challenging task with a potential for exceptional clinical relevance. Here, our aim was to combine available genotype and RNA-seq data generated by NGS with gene expression data gener- ated by gene chips, in order to develop a tool that could estimate the complex prognostic impact of a genomic anomaly. We believe that this method and the associated online tool can be used to prioritize genes for further functional study.
Methods
We implemented an approach to predict survival by sim- ultaneously using gene mutation status and gene expres- sion data. Main steps of the algorithm termed G-2-O (genotype to outcome) involve splitting TCGA samples into two cohorts using mutation status of the gene(s), then identifying differentially expressed genes between these cohorts using ROC analysis, and rendering a survival ana- lysis using an independent dataset established using gene chip data. The entire statistical pipeline is summarized in Fig. 2 and the individual steps as well as database con- struction are described below. An online interface for the G2O algorithm is available at http://www.g-2-o.com.
NGS data download
Whole exome sequencing data and RNA-seq data for breast cancer patients were obtained from The Cancer
Genome Atlas (TCGA) of the National Cancer Institute (http://cancergenome.nih.gov/) [13]. The aligned TCGA datasets were downloaded from the CGHub repository (website: https://cghub.ucsc.edu/) using the CGHub download client software GeneTorrent (version 3.8.5) for both tumor samples and matched normal samples (total n = 1,526).
Mutation calling
Mutation calling and annotation was done with MuTect [15] using default parameters. The human reference
genomes GRCh37, GRCh37-lite, and HG19 used for mu- tation calling were downloaded according to the CGHub websites’ ‘Reference Assemblies’ guideline (available at https://browser.cghub.ucsc.edu/help/assemblies). To re- duce the total number of mutations, we only accepted somatic mutations that were labeled as‘KEEP’according to theMutTectjudgment algorithm, and were present in at least four reads with a minimum of 20-fold read coverage. Our rationale behind the selection of a lower stringency threshold was intra-tumor heterogeneity, that is, the presence of multiple, genetically diverse clones in
Mutation
Function Direct effect
Leveraged effects
gene
protein mRNA
protein A mRNA
protein C mRNA gene C gene A gene B
5’
5’
3’
3’
ON OFF ON
No protein
Transcriptomic fingerprint mRNA
protein A
Fig. 1Complex effects of a single mutation. A cornerstone of our model is the leveraged effect of gene regulation network influencing the final consequence of a mutation. Some target genes will be suppressed while others will be amplified resulting in a markedly changed transcriptomic fingerprint for important genes
Fig. 2Overview of the analysis setup. Mutation status and gene expression levels obtained from the TCGA repository are compared using ROC analysis to identify a gene expression signature for each mutation. Then, the ability to predict survival for this signature is assessed in the gene chip dataset. The entire analysis can be made for a single gene or for up to three genes together
a single tumor which may affect tumor growth and pa- tients survival. During treatment minor clones can also have a prominent effect on the patients’ response to therapy and survival [16]. Finally, the identified muta- tions were annotated with MuTect using the dbSNP (build 139) and COSMIC (version 68) databases [17].
Hit annotation
The identified sequence variations were functionally an- notated using SNPeff v3.5 [18]. The reference databases used with SNPEff were downloaded with the SNPeff downloader. SNPeff is capable of annotating VCF files generated by MuTect. The annotation generated two outputs including a functionally annotated VCF file and a list containing all the genes and the effect the muta- tions had on the genes. The applied filters for the‘Func- tion class’ were: coding non-synonymous, stop gain, coding synonymous, locus region of gene, and splice site.
The complete gene list comprising of n = 22,938 genes from SNPeff was used during the functional annotation (see Additional file 1: Table S1).
Processing of copy number variations
Copy-number variation (CNV) data were downloaded from the TCGA repository on 1 February 2015. The CNV data were filtered according to two parameters: at least 10 probes had to be present at a position with a segment mean above 0.2 for amplification, and under
−0.2 for deletions, as suggested in [19]. The filtered seg- ments were annotated using the Human Gene Sets GTF annotation file downloaded from the Ensembl database of the Human Genome version GRCh37.
Processing of RNA-seq data
RNA-seq data for breast cancer patients was obtained from the TCGA repository for the same patients who also had mutation data. We downloaded the pre- processed level 3 data generated using the Illumina HiSeq 2000 RNA Sequencing Version 2 platform. Ex- pression levels for these samples were determined using a combination of MapSplice and RSEM. Individual pa- tient files were merged into a single database using the plyr R package [20].
Gene chip data
Set-up of microarray-database using GEO and EGA- available microarray datasets was established as described previously [21]. The entire breast cancer gene chip data- base contains 5,934 patients. The raw Affymetrix .CEL files were MAS5 normalized in the R v3.0.2 statistical en- vironment (http://www.r-project.org) using the Affy Bio- conductor library. We selected MAS5 for normalization because it performed among the top normalization methods compared to RT-PCR measurements in our
previous project [22]. Array quality control was computed as described previously [23]. For each gene, the most reli- able probe set was selected usingJetSet[24].
Validation dataset
As a starting point of our analysis, we wanted to confirm the correlation between the Affymetrix microarray and Illumina RNA-seq platforms. For this purpose, we used the TCGA lung squamous cell carcinoma dataset (LUSC), because it contains matched RNA-seq and Affymetrix gene chip data on the same samples. A matched gene list comprising 10,987 genes was prepared and pre-processed as described above for the breast can- cer datasets. For each gene, we used the Spearman rank correlation to compare RNA-seq and gene-chip based expression levels. The correlation and a P value were calculated R using thercorr function of theHmiscpack- age (http://biostat.mc.vanderbilt.edu/wiki/Main/Hmisc).
G-2-O algorithm
The first step of the algorithm involves assigning each sample to one of two cohorts based on the mutation sta- tus of the investigated gene. Generally, the type of DNA mutation used to split the samples can be any alteration in the gene. As an output of this step a binary vector termed ‘mutation pattern’ is calculated. In this, affected samples are represented by a‘1’and unaffected samples are represented as‘0’.
In certain settings one might be interested in a custom selection of gene variations – we performed such an analysis to compare mutations resulting in altered mRNA sequence (including start gain, exon, splice site, non-synonymous coding, stop gain, and stop loss muta- tions) to silent mutations (including mutations in in- trons and synonymous coding mutations). In the final analysis interface we enabled the user to custom-select a combination of the alterations.
The next step is categorizing genes whose expression is different between the two cohorts designated in the previous step. For this, a univariate receiver operating characteristic (ROC) analysis is separately performed using the expression values of each gene. In other words, samples are compared based by the previously identified
‘mutation pattern’and significantly altered genes are se- lected based on the area under the curve (AUC) value, and the associated P value computed in the ROC ana- lysis. The AUC value is calculated by the ROCR package using the prediction() and performance() functions. The G2O algorithm calculates the P values where the null hypothesis is that the AUC value equals to 0.5. First, the script calculates the standard error of the null hypothesis [25] from which the function derives the z-score. The P value is then calculated by transformation of the z-score using the normal distribution. Only genes passing both
AUC and P value thresholds are considered significant.
The final output of this step is a list of up- and downreg- ulated genes whose expression is significantly associated with the given genotype alteration of the original input gene.
The final step involves the calculation of survival in the gene chip database using the‘metagenes’selected in the TCGA data – the average expression of the set of significant genes identified by the ROC analysis are des- ignated as the ‘metagene’ for the given genotype. This survival analysis is therefore independent from the geno- type and RNA-seq data.
We then assessed the correlation with survival for each metagene using Cox proportional hazards regres- sion and by plotting Kaplan-Meier survival plots for median-dichotomized metagenes. In each analysis, meta- genes for up- and downregulated gene sets are treated separately resulting in two survival analyses for each genotype (up- and downregulated genes in tumors hav- ing a mutation of the gene).
Statistical packages utilized in the G-2-O algorithm The ROC analysis is performed using the ROCR [26]
Bioconductor (http://www.bioconductor.org/) library in the R statistical environment (http://www.r-project.org).
The AUC values are calculated automatically by the ROCR package using theprediction() and performance() functions. By default, a significance threshold of 0.01 and a minimal AUC of 0.65 are required for each gene to be considered as significant. Cox regression analysis is executed with the ‘survival’ R package version 2.38 downloaded from CRAN (http://CRAN.R-project.org/
package=survival). The Kaplan-Meier plots are generated using the‘survplot’R package developed by Aron Eklund (http://www.cbs.dtu.dk/~eklund/survplot/). Threshold for statistical significance in the survival analysis was set at P <0.05 and average HR >1.4 (average HR is based on the mean of HR in the cohort having a higher HR and 1/HR of the cohort having a lower HR value). In the entire analysis pathway, none of the samples in- volved in the training (ROC analysis) are included in the test (survival analysis) as well.
Permutation test and random holdout
To assess the robustness of the results, we performed the entire analysis 100× with 100 randomly selected genes in each run and counted the number of significant results. To assess the false positive rate, we plotted the number of significant genes against the number of runs delivering the given number of significant genes.
In a second cross-validation analysis set up to estimate the reproducibility of the results, we excluded 20 % of the samples at random and re-ran the entire analysis 10 times for a set of 20 selected top driver candidate genes.
We derived the averageP value as well as the standard deviation of all analyses for the given gene. Up- and downregulated gene sets were treated separately in this analysis.
Results Database setup
Central to our approach is the joint analysis of three breast cancer datasets, including somatic mutations and RNA-seq gene expression from the TCGA project and microarray and detailed survival data for a separate large cohort of breast cancer patients. Mutations were identi- fied in 20,938 genes in 763 patients. RNA-seq expression data for 10,987 genes was also available for the same tu- mors - only genes also present in the gene chips were utilized to facilitate translation between the two plat- forms. The microarray data for the matched 10,987 genes, and detailed follow-up including survival were available for 5,934 patients from 39 independent breast cancer datasets.
Comparison of RNA-seq and gene chip data
A total of 129 LUSC patients had matched RNA-seq and microarray data. In these, Spearman correlation was computed across all genes within each patient separately, the median correlation was 0.73 with aP value <1E-16.
The coefficient was higher than 0.68 in all cases, indicat- ing a robust correlation. Thus, we concluded that the planned utilization of gene chips as a surrogate of RNA- seq data is a feasible strategy for our analysis.
Analysis interface
We have set up an integrated web server that takes a few user-selected genes as input. Then, it: (1) looks up somatic mutations in the gene(s); (2) computes the com- bined transcriptional fingerprint of the mutation(s) using ROC analysis of breast cancer RNAseq data; and (3) uses the top up and down metagenes to estimate patient sur- vival using Cox regression on gene chip data. An im- portant element is estimation of the transcriptional signature for each somatic mutation, which is carried out by ROC analysis on the mutation and RNA-seq data.
The output includes Kaplan-Meier plots for both up-and downregulated signatures. As an example, see Fig. 3 for the gene RFC1.
Mutation landscape of the training database
We compared the output generated by our mutation de- tection method derived from the raw exome sequencing data to previously reported common mutations in breast cancer. Here we omitted any post-processing to truly as- sess the established pipeline without the influence of confounding additional steps. The computed mutation prevalence for the known cancer genes overlapped with
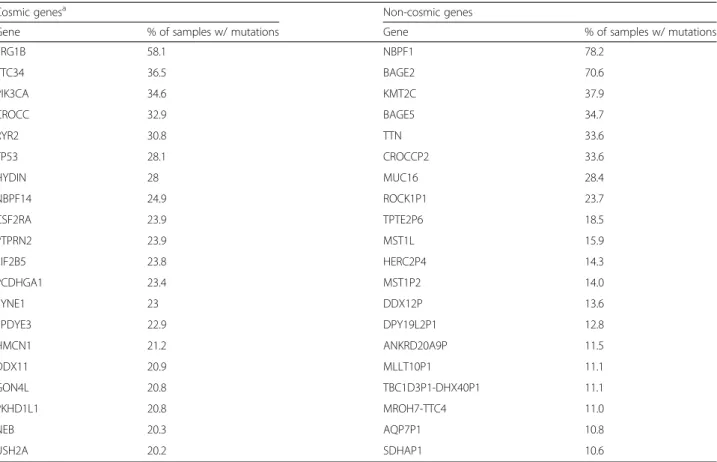
those of previous studies. We listed the top 20 cancer- related and non-cancer-related genes in Table 1. Genes listed in the COSMIC database [17] were designated as cancer-related.
Comparison of mutation calling results to the published TCGA data
Since our method using MuTect identified more mu- tations than the available mutations downloaded from the publicly available TCGA Data Matrix repository (https://tcga-data.nci.nih.gov/tcga/dataAccessMatrix.htm), we performed a mutation comparison between our results and the downloaded TCGA MAF files. Our mutation call- ing and annotating pipeline identified a significantly higher number of mutations (mean ± standard deviation of identified alterations by MuTect: 644 ± 69/sample and TCGA: 102 ± 14/sample), which spawn from (1) lower coverage threshold; (2) lower mutation frequency thresh- old; (3) mutation annotation with snpEff generated multi- gene annotations; and (4) we accepted mutations that were found either in intronic or upstream regions of a gene.
While the TCGA processing using a consensus call of three different centers was set up to achieve high true positive rate, the proportion of false negatives may also be high. On the contrary, while MuTect identified more somatic mutations, only 16 % of these fall into gene cod- ing regions (usually with lower coverage and/or muta- tion frequencies). The majority (84 %) of mutations identified were either found in introns, or upstream
regions of a gene. When examining the 10 genes with the highest prevalence in the TCGA MAF files, the differences in prevalence compared to the MuTect mutation calling were minimal (see Additional file 2:
Table S2). To validate MuTect results, we visualized a few examples in the IGV Browser [27] (see Additional file 3: Figure S1a–f ). When evaluating the entire set of all single nucleotide variations across all 763 samples, our analysis pipeline identified 1,636 of the 1,752 alter- ations published in the TCGA repository, which trans- lates to an intersection of 93 %.
Identification of strongest driver genes
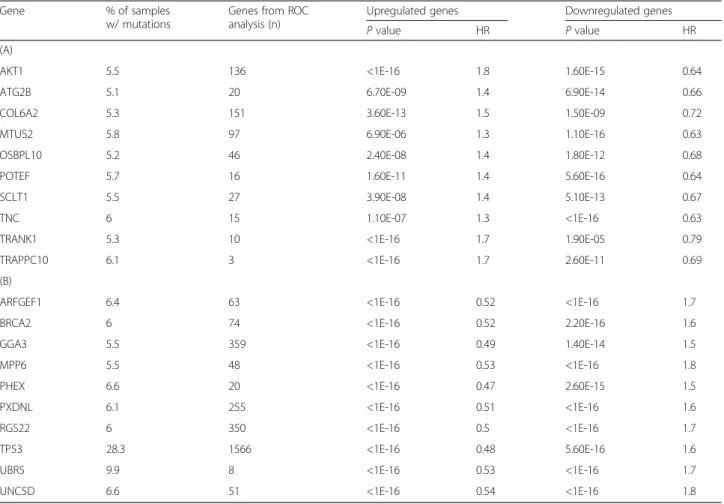
To focus on genes with high clinical relevance, we aimed to identify the strongest driver gene candidates. These analyses were run by accepting an AUC value over 0.65 and a P value below 0.01 as significant in the ROC analysis and accepting a HR over 1.4 and a P value below 0.01 in the survival analysis. The complete ana- lysis results for both up- and downregulated genes sets for each of these 176 genes are listed in Additional file 4: Table S3 and the 20 best performing genes based on the computed HR are listed in Table 2. The complete set of all genes included in the metagenes for each of these drivers is listed in Additional file 2: Table S2.
To compare our results to more stringent mutation calling criteria, we re-computed the entire analysis by using the mutation calls published by TCGA. Out of the 176 driver genes identified by the basic G-2-O algorithm 61 genes were found significant, 61 genes delivered‘NA’
Fig. 3A sample analysis result for the AKT1 gene. The plots show the effect of both upregulated genes (a) and downregulated genes (b). Notice the robust inverse correlation: higher expression of upregulated genes results in worse relapse free survival while lower expression of downregulated genes also leads to worse survival. High and low: compared to the median of the surrogate gene expression signature
results, and 54 genes were not significant. The result was always ‘NA’ in cases when there were fewer than seven patients with a mutation in the given gene. Of the 61 significant genes, the correlation with survival was matching for 55 genes, an opposite correlation was ob- served for six genes. In other words, by introducing the TCGA thresholds, 65 % of the driver genes were not identified, mainly because of insufficient number of genotype alterations.
Computation of expected positive rate
To estimate the expected false positive rate, we per- formed a random resampling test in which we repeated the analysis 100 times, each time running the pipeline on 100 random genes. The mean number of significant genes was 9.24, none of the runs delivered more than 15 significant genes, and there were at least three genes sig- nificant in each analysis. The number of runs having a given number of significant genes is depicted in Fig. 4.
To estimate the number of false positive hits we com- pared the results (924 hit per 10 k genes) to the number of COSMIC cancer consensus genes (n = 571) using fol- lowing formula: FPR = FP/(FP + TN), where FPR = false
positive rate, FP = false positives, TN = true negatives.
The estimated FPR was at 5 % on average (range 0–10 %).
Assessing reproducibility by random holdout
In order to estimate the reproducibility of the results, we excluded 20 % of the samples at random and re-ran the entire analysis ten times for a selected set of high preva- lence genes including 20 top driver candidate genes (AKT1, PIK3CA, TP53, BRCA2, and so on). Titin (TTN) was also selected as a non-cancer gene because it has a high mutation prevalence probably due to its massive size. Across all analyses, the AKT1 gene upregulated gene signature had an average hazard ratio of 1.7 (range 1.6–1.8) with an average P value of <1E-16 (<1E-16 – <1E-16), paired with a downregulated gene signature average hazard ratio of 0.72 (0.59–0.87) with an average P value of 2.5E-3 (<1E-16–1.4E-2). In the case of PIK3CA, the upregulated gene signature hazard ratio was 1.3 (1.2–1.6) with an average P value of 1.6E-4 (<1E-16–8.8E-4), paired with a downregu- lated gene signature hazard ratio of 0.64 (0.53–0.7) with an average P value of 7.2E-12 (<1E-16–4.3E-11).
Table 1A list of the top 20 most common cancer and non-cancer (based on Cosmic) mutations identified by analyzing 763 breast cancer samples
Cosmic genesa Non-cosmic genes
Gene % of samples w/ mutations Gene % of samples w/ mutations
FRG1B 58.1 NBPF1 78.2
TTC34 36.5 BAGE2 70.6
PIK3CA 34.6 KMT2C 37.9
CROCC 32.9 BAGE5 34.7
RYR2 30.8 TTN 33.6
TP53 28.1 CROCCP2 33.6
HYDIN 28 MUC16 28.4
NBPF14 24.9 ROCK1P1 23.7
CSF2RA 23.9 TPTE2P6 18.5
PTPRN2 23.9 MST1L 15.9
EIF2B5 23.8 HERC2P4 14.3
PCDHGA1 23.4 MST1P2 14.0
SYNE1 23 DDX12P 13.6
SPDYE3 22.9 DPY19L2P1 12.8
HMCN1 21.2 ANKRD20A9P 11.5
DDX11 20.9 MLLT10P1 11.1
GON4L 20.8 TBC1D3P1-DHX40P1 11.1
PKHD1L1 20.8 MROH7-TTC4 11.0
NEB 20.3 AQP7P1 10.8
USH2A 20.2 SDHAP1 10.6
aVersion: COSMICv71
A significance threshold of 0.01 and a minimal AUC of 0.65 are required for each gene to be considered as significant in the ROC analysis, and the threshold for significance in the survival analysis was set atP<0.05 and average HR >1.4. This analysis included all genes (including the established driver genes as well)
Table 2Analysis results for the top genes including new and already established driver gene candidates. The table is split according to top 10 oncogene candidates (A) and top 10 tumor suppressor gene candidates (B)
Gene % of samples
w/ mutations
Genes from ROC analysis (n)
Upregulated genes Downregulated genes
Pvalue HR Pvalue HR
(A)
AKT1 5.5 136 <1E-16 1.8 1.60E-15 0.64
ATG2B 5.1 20 6.70E-09 1.4 6.90E-14 0.66
COL6A2 5.3 151 3.60E-13 1.5 1.50E-09 0.72
MTUS2 5.8 97 6.90E-06 1.3 1.10E-16 0.63
OSBPL10 5.2 46 2.40E-08 1.4 1.80E-12 0.68
POTEF 5.7 16 1.60E-11 1.4 5.60E-16 0.64
SCLT1 5.5 27 3.90E-08 1.4 5.10E-13 0.67
TNC 6 15 1.10E-07 1.3 <1E-16 0.63
TRANK1 5.3 10 <1E-16 1.7 1.90E-05 0.79
TRAPPC10 6.1 3 <1E-16 1.7 2.60E-11 0.69
(B)
ARFGEF1 6.4 63 <1E-16 0.52 <1E-16 1.7
BRCA2 6 74 <1E-16 0.52 2.20E-16 1.6
GGA3 5.5 359 <1E-16 0.49 1.40E-14 1.5
MPP6 5.5 48 <1E-16 0.53 <1E-16 1.8
PHEX 6.6 20 <1E-16 0.47 2.60E-15 1.5
PXDNL 6.1 255 <1E-16 0.51 <1E-16 1.6
RGS22 6 350 <1E-16 0.5 <1E-16 1.7
TP53 28.3 1566 <1E-16 0.48 5.60E-16 1.6
UBR5 9.9 8 <1E-16 0.53 <1E-16 1.7
UNC5D 6.6 51 <1E-16 0.54 <1E-16 1.8
Significant signatures identified had to have an AUC value over 0.65 and aPvalue below 0.01 in the ROC analysis and an average HR over 1.4 and aPvalue below 0.01 in the survival analysis
HR andPvalue: results of the Cox regression for both up- and downregulated genes
Fig. 4Distribution of significant hits in random analyses. To assess the expected false positive rate of the method, the entire pipeline was run 100 times each time on 100 randomly selected genes. The mean number of significant genes was 9.24, the number of significant genes was not more than 15 in any run
The remaining putative driver genes delivered similar outcomes, the complete results for all genes are listed in Additional file 5: Table S4. The TTN gene had no significant results in any of the analyses.
Finally, we set up the ROC analysis to enable utilization of different thresholds for accepting a gene as significant. These include an AUC value between 0.6 and 0.75 and aPvalue between 0.05 and 0.0001. To estimate the effect of different cutoffs on classification perform- ance, we performed the analysis using each available cut- off (for example, for AUC andP value) combinations for TP53, PIK3CA, and EGFR. In these analyses, the result- ing HR and P values showed less than 2 % deviations (data not shown).
Discussion
We developed a genome-wide approach to link genotype to clinical outcome by consecutively utilizing next gener- ation sequencing and gene chip data of 6,697 breast cancer patients. The two key elements of this system are: (1) the link between NGS datasets and the well- annotated gene-chip datasets; and (2) the assumption that the link is not one-to-one, but includes a set of genes (transcriptomic fingerprint) indirectly affected by a somatic mutation. We have set up a web-based system that enables utilization of the entire analysis pipeline to assess the correlation between mutational status and survival for 10,987 genes. Raw data for each of the avail- able samples were downloaded and re-processed using the same analysis pipeline to enable robust utilization of the data. Genes correlated with a given genotype were identified by employing a ROC analysis across all genes.
Simultaneous utilization of RNA-seq and gene chip as- says to measure expression of the same genes is sup- ported by the recent validation of high concordance between these technologies [28].
While microarray and RT-PCR based assays are lim- ited to measuring the expression of selected, a priori chosen genomic features, next generation sequencing (NGS) technologies are not subject to this limitation and can be used to evaluate whole genomes, targeted gen- ome regions, transcriptomes, and epigenomes. A pri- mary goal of an NGS analysis is the identification of driver mutations – changes conferring selective advan- tages to cancer cells and thus contributing to tumor ex- pansion. However, driver mutations are often buried inside a cloud of passenger mutations–changes without biological significance, most likely products of the gen- omic instability in cancer cells.
As of today, there are no validated drivers of meta- static disease and drivers of therapy resistance. In addition, genes imperative for therapy decision including HER2 (mutation in 1.5 % of samples) and ESR1 (muta- tion in 0.6 % of samples) show a very low mutational
prevalence. These facts emphasize that many driver genes are not yet identified. Here, we provide an al- ternative approach to identify new driver genes. We hypothesize that by measuring the leveraged effect of a given mutation on the overall transcriptomic profile of the tumor the effects of that genomic change can be evaluated. The utilization of this approach on already established driver genes confirmed our method. We have to note that some genes tend to have high false discovery rate in mutation calling, for instance HYDIN, SYNE1, and USH2A [29] – it is an advantage of the proposed methodology is that des- pite the high mutation rate, none of these genes reached the significance necessary to be included in the list of putative driver genes.
A potential limitation of our method is the assumption that a direct link exists between mutation changes and gene expression. In fact, a mutation in a driver gene can be silent without changes in the transcriptional finger- print – for example activation of certain signaling pathways like PIK3, which has been shown to be inde- pendent of changes in expression [30]. Another restric- tion of our approach is that it cannot be validated for genes with mutation in a few patients only (low muta- tion prevalence below 1 %). A further limitation is that due to lack of data we had to disregard epigenetic effects on transcription. The same mutation with or without a methylation event might result in different transcrip- tional consequences.
We have also computed the expected number of sig- nificant genes selected at random, which yielded an aver- age of 9.2 significant genes per 100 randomly picked genes. This analysis includes a proportion of false posi- tive hits in addition to the known driver genes (5 % of all genes based on COSMIC consensus genes). Nonethe- less, an alternative explanation is that there are still a large number of unidentified driver genes. Altogether, the overall number of false positive results is far below the output of random multigene signatures – 90 % of which delivered significant association with survival in breast cancer in a previous study [31]. We have to note that these random signatures contained more than 100 genes and the G-2-O metagenes contain less than 100 genes in most of the analyses.
Direct analysis on the prognosis of a given mutation based on the TCGA data is possible using the cBioPortal [32]. However, shortcomings of the cBio portal include utilization of overall survival data only, short follow-up, few death events, and unbalanced cohorts dependent on prevalence of the mutation. Furthermore, today we know that breast cancer subtypes carry different sets of mutations and are linked with different baseline prognoses – these differences can be easily detected using the G-2-O analysis platform which enables one
to investigate the effect on prognosis in each of the molecular subtypes separately. For example, the haz- ard ratio associated with a PIK3CA mutation in ER positive and negative tumors deliver completely dif- ferent prognostic implications (for the upregulated gene signature is the HR in ER negative samples 0.66 and HR in ER positive tumors is 1.2).
Previously, an integrated algorithmic approach termed DriverNet was set up to analyze population-based genomic and transcriptomic interrogations of a tumor to identify pathogenic driver mutations [33]. Para- digm, another similar project was developed to iden- tify driver pathways [34]. Both of these approaches were based on incorporating known associations or interactions between genes. In contrast, the G-2-O approach is fundamentally different as no recognized gene or pathway interaction data are included in the analysis. Rather, the association between genes is re- computed for each gene in each analysis – this approach delivers results not influenced by a priori association networks.
Conclusions
To date, targeting of recognized driver genes deliv- ered suboptimal results in breast cancer [35]. There are two major reasons behind this phenomenon – only a handful of genes are already actionable while most of these known driver genes have a prevalence below 10 % of patients. Thus, we need to identify clinically relevant mutations to spot candidate genes for targeted therapy or for new personalized clinical trials. Here, we have set up a pipeline enabling the functional validation of a discovered mutation for any gene in a large breast cancer cohort by computation- ally connecting genotype to an extended, surrogate gene expression signature and utilizing this signature in gene chip datasets. Gene chip databases already serve as transcriptomic basis for cross-dataset analysis tools like Breast-Mark [36] or the KM-plotter [37].
Since the gene expression datasets are large and rea- sonably well annotated, we can use the gene expres- sion surrogate to test the prognostic significance of a DNA level change. The registration-free, online inter- face of the Genotype To Outcome (http://www.g-2- o.com) web server enables researchers, bioinformati- cians, and clinicians to query the genetic background of a patient by performing an express evaluation of a discovered mutation, or combinations of mutations for any gene.
Endnotes
1Overall survival event available for 87 patients out of 763, median follow-up 487 days. TCGA repository quer- ied 23 February 2015.
Additional files
Additional file 1: Table S1.List of genes used during mutation annotation with SnpEff. (TXT 973 kb)
Additional file 2: Table S2.The complete set of all genes included in the metagenes for each of the putative driver genes listed in Table 2.
(XLSX 156 kb)
Additional file 3: Figure S1.Somatic mutation found by MuTect and not present in the TCGA MAF file for the genes RNU5-F1 (A), SH3PXD2A (B), PSD3 (C), MYOC (D), CES3 (E), and GPR113 (F). (PPTX 378 kb) Additional file 4: Table S3.Analysis results for both up- and downregulated genes whose AUC value was over 0.65 andPvalue below 0.01 in the ROC analysis and accepting a HR over 1.4 and a Pvalue below 0.01 in the survival analysis. (XLSX 18 kb)
Additional file 5: Table S4.Complete results of the random holdout analysis. The table contains the average HR andPvalues computed in the survival analysis, as well as their minimum and maximum values. (XLS 27 kb)
Competing interests
The authors declare that they have no competing interests.
Authors’contributions
LSP contributed to the data acquisition, data analysis, data interpretation, and drafting of the manuscript. MK contributed to the development of the analysis methods used in the pipeline. CH contributed to the interpretation of data and results, and drafting of the manuscript. LP contributed to the interpretation of data and results, and drafting of the manuscript. AS contributed to the interpretation of data and results, and drafting of the manuscript. BG contributed to the conception and design, data acquisition, interpretation of data and results, and drafting of the manuscript. All authors approved the final manuscript.
Acknowledgements
The study was supported by the OTKA K108655 grant of the Hungarian Scientific Research Fund.
Author details
1MTA TTK Lendület Cancer Biomarker Research Group, Research Centre for Natural Sciences, Magyar tudósok körútja 2, Budapest H-1117, Hungary.22nd Department of Pediatrics, Semmelweis University, Budapest, Hungary.3Yale Comprehensive Cancer Center, Yale School of Medicine, New Haven, CT, USA.4MTA-SE Pediatrics and Nephrology Research Group, Budapest, Hungary.
Received: 20 July 2015 Accepted: 5 October 2015
References
1. Hanahan D, Weinberg RA. Hallmarks of cancer: the next generation. Cell.
2011;144(5):646–74.
2. Amado RG, Wolf M, Peeters M, Van Cutsem E, Siena S, Freeman DJ, et al.
Wild-type KRAS is required for panitumumab efficacy in patients with metastatic colorectal cancer. J Clin Oncol. 2008;26(10):1626–34.
3. Flaherty KT, Puzanov I, Kim KB, Ribas A, McArthur GA, Sosman JA, et al.
Inhibition of mutated, activated BRAF in metastatic melanoma. N Engl J Med. 2010;363(9):809–19.
4. Prahallad A, Sun C, Huang S, Di Nicolantonio F, Salazar R, Zecchin D, et al.
Unresponsiveness of colon cancer to BRAF(V600E) inhibition through feedback activation of EGFR. Nature. 2012;483(7387):100–3.
5. Janku F, Wheler JJ, Westin SN, Moulder SL, Naing A, Tsimberidou AM, et al.
PI3K/AKT/mTOR inhibitors in patients with breast and gynecologic malignancies harboring PIK3CA mutations. J Clin Oncol. 2012;30(8):777–82.
6. Migliaccio I, Di Leo A, Malorni L. Cyclin-dependent kinase 4/6 inhibitors in breast cancer therapy. Curr Opin Oncol. 2014;26(6):568–75.
7. Stephens PJ, Tarpey PS, Davies H, Van Loo P, Greenman C, Wedge DC, et al.
The landscape of cancer genes and mutational processes in breast cancer.
Nature. 2012;486(7403):400–4.
8. Banerji S, Cibulskis K, Rangel-Escareno C, Brown KK, Carter SL, Frederick AM, et al. Sequence analysis of mutations and translocations across breast cancer subtypes. Nature. 2012;486(7403):405–9.
9. Cancer Genome Atlas Network. Comprehensive molecular portraits of human breast tumours. Nature. 2012;490(7418):61–70.
10. Ellis MJ, Ding L, Shen D, Luo J, Suman VJ, Wallis JW, et al. Whole-genome analysis informs breast cancer response to aromatase inhibition. Nature.
2012;486(7403):353–60.
11. Desmedt C, Voet T, Sotiriou C, Campbell PJ. Next-generation sequencing in breast cancer: first take home messages. Curr Opin Oncol. 2012;24(6):597–604.
12. Vasan N, Yelensky R, Wang K, Moulder S, Dzimitrowicz H, Avritscher R, et al.
A targeted next-generation sequencing assay detects a high frequency of therapeutically targetable alterations in primary and metastatic breast cancers: implications for clinical practice. Oncologist. 2014;19(5):453–8.
13. The Cancer Genome Atlas Network. Comprehensive molecular portraits of human breast tumours. Nature. 2012;490(7418):61–70.
14. Gyorffy B, Bottai G, Lehmann-Che J, Kéri G, Orfi L, Iwamoto T, et al. TP53 mutation-correlated genes predict the risk of tumor relapse and identify MPS1 as a potential therapeutic kinase in TP53-mutated breast cancers. Mol Oncol. 2014;8(3):508–19.
15. Cibulskis K, Lawrence MS, Carter SL, Sivachenko A, Jaffe D, Sougnez C, et al.
Sensitive detection of somatic point mutations in impure and heterogeneous cancer samples. Nat Biotechnol. 2013;31(3):213–9.
16. Keats JJ, Chesi M, Egan JB, Garbitt VM, Palmer SE, Braggio E, et al. Clonal competition with alternating dominance in multiple myeloma. Blood.
2012;120(5):1067–76.
17. Forbes SA, Beare D, Gunasekaran P, Leung K, Bindal N, Boutselakis H, et al.
COSMIC: exploring the world’s knowledge of somatic mutations in human cancer. Nucleic Acids Res. 2015;43(Database issue):D805–11.
18. Cingolani P, Platts A, Wang le L, Coon M, Nguyen T, Wang L, et al. A program for annotating and predicting the effects of single nucleotide polymorphisms, SnpEff: SNPs in the genome of Drosophila melanogaster strain w1118; iso-2; iso-3. Fly (Austin). 2012;6(2):80–92.
19. Laddha SV, Ganesan S, Chan CS, White E. Mutational landscape of the essential autophagy gene BECN1 in human cancers. Mol Cancer Res.
2014;12(4):485–90.
20. Wickham H. The split-apply-combine strategy for data analysis. J Stat Softw.
2011;40(1):1–29.
21. Gyorffy B, Karn T, Sztupinszki Z, Weltz B, Müller V, Pusztai L. Dynamic classification using case-specific training cohorts outperforms static gene expression signatures in breast cancer. Int J Cancer. 2015;136(9):2091–8.
22. Gyorffy B, Molnar B, Lage H, Szallasi Z, Eklund AC. Evaluation of microarray preprocessing algorithms based on concordance with RT-PCR in clinical samples. PLoS One. 2009;4:e5645.
23. Gyorffy B, Benke Z, Lánczky A, Balázs B, Szállási Z, Timár J, et al.
RecurrenceOnline: an online analysis tool to determine breast cancer recurrence and hormone receptor status using microarray data. Breast Cancer Res Treat. 2012;132(3):1025–34.
24. Li Q, Birkbak NJ, Gyorffy B, Szallasi Z, Eklund AC. Jetset: selecting the optimal microarray probe set to represent a gene. BMC Bioinformatics. 2011;12:474.
25. Hanley JA, McNeil BJ. The meaning and use of the area under a receiver operating characteristic (ROC) curve. Radiology. 1982;143(1):29–36.
26. Sing T, Sander O, Beerenwinkel N, Lengauer T. ROCR: visualizing classifier performance in R. Bioinformatics. 2005;21(20):3940–1.
27. Robinson JT, Thorvaldsdóttir H, Winckler W, Guttman M, Lander ES, Getz G, et al. Integrative genomics viewer. Nat Biotechnol. 2011;29(1):24–6.
28. Wang C, Gong B, Bushel PR, Thierry-Mieg J, Thierry-Mieg D, Xu J, et al. The concordance between RNA-seq and microarray data depends on chemical treatment and transcript abundance. Nat Biotechnol. 2014;32(9):926–32.
29. Doggett NA, Xie G, Meincke LJ, Sutherland RD, Mundt MO, Berbari NS, et al.
A 360-kb interchromosomal duplication of the human HYDIN locus.
Genomics. 2006;88(6):762–71.
30. Samuels Y, Wang Z, Bardelli A, Silliman N, Ptak J, Szabo S, et al. High frequency of mutations of the PIK3CA gene in human cancers. Science.
2004;304(5670):554.
31. Venet D, Dumont JE, Detours V. Most random gene expression signatures are significantly associated with breast cancer outcome. PLoS Comput Biol.
2011;7(10):e1002240.
32. Cerami E, Gao J, Dogrusoz U, Gross BE, Sumer SO, Aksoy BA, et al. The cBio cancer genomics portal: an open platform for exploring multidimensional cancer genomics data. Cancer Discov. 2012;2(5):401–4.
33. Bashashati A, Haffari G, Ding J, Ha G, Lui K, Rosner J, et al. DriverNet:
uncovering the impact of somatic driver mutations on transcriptional networks in cancer. Genome Biol. 2012;13(12):R124.
34. Vaske CJ, Benz SC, Sanborn JZ, Earl D, Szeto C, Zhu J, et al. Inference of patient-specific pathway activities from multi-dimensional cancer genomics data using PARADIGM. Bioinformatics. 2010;26(12):i237–45.
35. Andre F, Bachelot T, Commo F, Campone M, Arnedos M, Dieras V, et al.
Comparative genomic hybridisation array and DNA sequencing to direct treatment of metastatic breast cancer: a multicentre, prospective trial (SAFIR01/UNICANCER). Lancet Oncol. 2014;15(3):267–74.
36. Madden SF, Clarke C, Gaule P, Aherne ST, O'Donovan N, Clynes M, et al.
BreastMark: an integrated approach to mining publicly available transcriptomic datasets relating to breast cancer outcome. Breast Cancer Res. 2013;15(4):R52.
37. Gyorffy B, Surowiak P, Budczies J, Lánczky A. Online survival analysis software to assess the prognostic value of biomarkers using transcriptomic data in non-small-cell lung cancer. PLoS One. 2013;8(12):e82241.
Submit your next manuscript to BioMed Central and take full advantage of:
• Convenient online submission
• Thorough peer review
• No space constraints or color figure charges
• Immediate publication on acceptance
• Inclusion in PubMed, CAS, Scopus and Google Scholar
• Research which is freely available for redistribution
Submit your manuscript at www.biomedcentral.com/submit
![Table S2). To validate MuTect results, we visualized a few examples in the IGV Browser [27] (see Additional file 3: Figure S1a–f )](https://thumb-eu.123doks.com/thumbv2/9dokorg/1344068.109101/6.892.88.807.134.477/validate-mutect-results-visualized-examples-browser-additional-figure.webp)