Integrated molecular analysis of Tamoxifen-resistant invasive lobular breast cancer cells identi fi es MAPK and GRM/mGluR signaling as therapeutic vulnerabilities
Hillary Stires
a, Mary M. Heckler
a, Xiaoyong Fu
b, Zhao Li
c, Catherine S. Grasso
d, Michael J. Quist
e, Joseph A. Lewis
a, Uwe Klimach
a, Alan Zwart
a, Akanksha Mahajan
a, Bal azs Gy} orffy
f, Luciane R. Cavalli
a, Rebecca B. Riggins
a,*aDepartment of Oncology, Lombardi Comprehensive Cancer Center, Georgetown University, Washington, DC, USA
bLester and Sue Smith Breast Center, Dan L. Duncan Cancer Center, Department of Molecular and Cellular Biology, Baylor College of Medicine, Houston, TX, USA
cDepartment of Genomic Medicine, The University of Texas MD Anderson Cancer Center, Houston, TX, USA
dUniversity of California Los Angeles (UCLA), Los Angeles, CA, USA
eFred Hutchinson Cancer Research Center, Seattle, WA, USA
fMTA TTK Lendület Cancer Biomarker Research Group, 2nd Department of Pediatrics, Semmelweis University, Budapest, Hungary
a r t i c l e i n f o
Article history:
Received 28 February 2017 Received in revised form 26 July 2017
Accepted 15 September 2017 Available online 19 September 2017
Keywords:
Invasive lobular breast cancer (ILC) Tamoxifen resistance
MAPK/ERK (MAPK1) ESRRG (ERRgamma) mGluR (GRM) Riluzole
a b s t r a c t
Invasive lobular breast cancer (ILC) is an understudied malignancy with distinct clinical, pathological, and molecular features that distinguish it from the more common invasive ductal carcinoma (IDC).
Mounting evidence suggests that estrogen receptor-alpha positive (ERþ) ILC has a poor response to Tamoxifen (TAM), but the mechanistic drivers of this are undefined. In the current work, we compre- hensively characterize the SUM44/LCCTam ILC cell model system through integrated analysis of gene expression, copy number, and mutation, with the goal of identifying actionable alterations relevant to clinical ILC that can be co-targeted along with ER to improve treatment outcomes. We show that TAM has several distinct effects on the transcriptome of LCCTam cells, that this resistant cell model has acquired copy number alterations and mutations that impinge on MAPK and metabotropic glutamate receptor (GRM/mGluR) signaling networks, and that pharmacological inhibition of either improves or restores the growth-inhibitory actions of endocrine therapy.
©2017 The Authors. Published by Elsevier Ireland Ltd. This is an open access article under the CC BY-NC- ND license (http://creativecommons.org/licenses/by-nc-nd/4.0/).
1. Introduction
Invasive lobular breast cancer (ILC) is a special histologic sub- type of breast cancer that accounts for 10e15% of annually diag- nosed cases e an identical percentage to triple negative breast cancer. ILC has unique clinical features that distinguish it from the more common invasive ductal breast cancer (IDC) (Barroso-Sousa and Metzger-Filho, 2016; Christgen et al., 2016; Sledge et al., 2016)eit forms a long, thin mass that is often missed by screening mammograms, and metastatic ILC frequently spreads to distinct sites (e.g. peritoneum, gastrointestinal tract, orbital cavity) that
differ from IDC. This unique biology of ILC impacts disease prog- nosis. ILC has a greater risk of late recurrence and death (>10 years post-diagnosis) than IDC (Pestalozzi et al., 2008; Rakha et al., 2008).
Grade 2 (moderately differentiated) ILC has an equally poor breast cancer-specific survival to grade 3 (poorly differentiated) IDC (Engstrøm et al., 2015). The most common genetic lesion in ILC is mutation ofCDH1leading to loss of E-cadherin expression, which is thought to underlie ILC's unusual metastatic pattern as well as its tendency to be multifocal and affect the contralateral breast. Recent studies have performed genomic, transcriptomic, and proteomic characterization of ILC clinical specimens to identify additional events that are enriched in ILC vs. IDC; these include higher rates of PTENloss,FOXA1mutation, and AKT phosphorylation (Ciriello et al., 2015; Desmedt et al., 2016; Michaut et al., 2016).
Molecular profiling of breast cancer classifies most ILC as Luminal Aeestrogen receptor positive (ERþ), and slow-growinge
*Corresponding author. 3970 Reservoir Rd NW, E412 Research Bldg., Washing- ton, DC 20057, USA.
E-mail address:rebecca.riggins@georgetown.edu(R.B. Riggins).
Contents lists available atScienceDirect
Molecular and Cellular Endocrinology
j o u r n a l h o m e p a g e :w w w . e l s e v i e r . c o m / l o c a t e / m c e
https://doi.org/10.1016/j.mce.2017.09.024
0303-7207/©2017 The Authors. Published by Elsevier Ireland Ltd. This is an open access article under the CC BY-NC-ND license (http://creativecommons.org/licenses/by-nc- nd/4.0/).
for which 10 years of treatment with the antiestrogen Tamoxifen (TAM) or an aromatase inhibitor (AI) is recommended (Azim et al., 2016; Rugo et al., 2016). Within ILC, there are 2e3 additional mo- lecular subtypes (Ciriello et al., 2015; Michaut et al., 2016). Among ERþor Luminal A breast tumors, lobular histology is still inde- pendently and significantly associated with worse long-term sur- vival outcome than ductal histology (Pestalozzi et al., 2008; Rakha et al., 2008), and multiple studies show that ER þ ILC has a significantly worse response to TAM than the non-steroidal AIs letrozole or anastrozole (Knauer et al., 2015; Metzger Filho et al., 2015). ILC patients also have inferior overall survival on the ste- roidal AI exemestane vs. anastrozole, while in IDC they have equivalent efficacy (Strasser-Weippl et al., 2016).
ILC is an understudied malignancy and thus the reasons for its relatively poor response to TAM are not well defined. We previously established the first cellular model of TAM-resistant ILC (Riggins et al., 2008); SUM44 cells are the parental, TAM sensitive cell line while LCCTam cells are TAM-resistant. These initial studies identi- fied an orphan member of the nuclear receptor superfamily, estrogen-related receptor gamma (ERRg,ESRRG), as a key mediator of the TAM-resistant phenotype. In the current work, we compre- hensively characterize this ILC model system through integrated analysis of genome-wide gene expression, copy number, and whole exome sequencing (WES), with the goal of identifying actionable alterations relevant to clinical ILC that can be targeted to improve therapeutic outcomes. Wefind that 4-hydroxytamoxifen (4HT) has a distinct effect on the transcriptome of LCCTam cells, that this resistant cell model has acquired copy number alterations and specific gene mutations that impinge on MAPK and metabotropic glutamate receptor (GRM/mGluR) signaling networks, and that pharmacological inhibition of either improves or restores the growth-inhibitory actions of endocrine therapy.
2. Materials and methods 2.1. General study design
We have previously reported the establishment and initial validation of a TAM-resistant ILC cell line (LCCTam) established from the parental SUM44 (Riggins et al., 2008). Here, we demon- strate the utility of this model system for studying TAM-resistant ILC by comparing SUM44 with publicly available breast cancer patient datasets. Subsequent comprehensive molecular analysis of LCCTam cells was performed in comparison to SUM44 cells utilizing gene expression array, Whole Exome Sequencing (WES), and Array Comparative Genomic Hybridization (aCGH). Selected molecular targets from this analysis were validated and functional analyses were performed using drugs of interest that resensitize TAM- resistant cells to endocrine therapy as measured by growth inhibition.
2.2. TCGA and METABRIC datasets, and tumor-derived ILC signature (TIS)
cBioPortal (Cerami et al., 2012; Gao et al., 2013) was used to query processed gene expression microarray, whole-exome, and RNA sequencing data for Luminal A IDC and Luminal A ILC tumors from The Cancer Genome Atlas (TCGA, (Ciriello et al., 2015)) and the Molecular Taxonomy of Breast Cancer International Consortium (METABRIC, (Curtis et al., 2012; Pereira et al., 2016)). To establish the tumor-derived ILC signature (TIS, Fig. 1A), RNA-seq data for Luminal A ILC (n¼106) and IDC (n¼201) were downloaded from the TCGA Portal (http://cbio.mskcc.org/cancergenomics/tcga/brca_
tcga/). The differentially expressed genes between these two his- tologic subtypes were identified using the
‘ComparativeMarkerSelection’ module from GenePattern (Reich et al., 2006), and plotted by alignment of their tested t-score after permutation. The top 100 genes including both directions (250) were defined as a‘tumor-derived ILC gene signature’(TIS) for the comparison of signature profiles among different cell models, using a t-score method as described previously (Creighton et al., 2010).
Supplementary Table 1 shows sample identifiers for TCGA and METABRIC datasets. Distant metastasis-free survival (DMFS) data for GRM2 and GRM4 mRNA expression by Affymetrix gene expression microarray in ERþ, TAM-treated, chemotherapy-naïve patients were obtained from multiple combined datasets as described previously (Mihaly et al., 2013) (Supplementary Fig. 2).
The final database included patients from GSE2990, GSE3494, GSE6532, GSE12093, GSE9195, GSE16391, GSE17705, GSE19615, GSE26971, and GSE45255.
2.3. Cell culture and general reagents
The ILC-derived, ERþparental SUM44 breast cancer cells were initially characterized by (Ethier et al., 1993), and the ERþ, TAM- resistant variant LCCTam were first reported in (Riggins et al., 2008). SUM44 cells were maintained in serum-free Ham's F12 media (Life Technologies, Carlsbad, CA; 100 nM glutamate) con- taining 5mg/ml insulin and 1 mg/ml hydrocortisone (SFIH) plus other supplements as follows: 5 mM ethanolamine, 10 mM HEPES, 5 mg/ml Transferrin, 10 nM Tri-iodo thyronine, 50 mM sodium selenite, 0.5 g/L bovine serum albumin, 2.5mg/ml amphotericin B, and 5mg/ml gentamicin (all purchased from either Life Technolo- gies or Sigma Aldrich, St. Louis, MO). LCCTam cells were maintained in SFIH with the addition of 500 nM 4HT (Sigma Aldrich), and switched to SFIH lacking 4HT as indicated below. The IDC-derived, ER- MDA-MB-231 cell line was obtained from the Lombardi Comprehensive Cancer Center (LCCC) Tissue Culture Shared Resource (TCSR), and was maintained in phenol red-containing improved minimal essential media (IMEM) supplemented with 5% heat-inactivated fetal bovine serum (FBS). All cells routinely tested negative for Mycoplasmaspp., and were maintained in a 37C, humidified incubator with 95% air: 5% carbon dioxide. Cells werefingerprinted by the TCSR to verify their authenticity using 9 standard short tandem repeat (STR) loci and the Y chromosome- specific amelogenin, most recently in October 2016. Fulvestrant (ICI), Riluzole (RIL), and U0126 were purchased from Tocris Bioscience (RNDSystems, Minneapolis, MN) and used at the indi- cated concentrations. Unless otherwise specified, general labora- tory chemicals were obtained from Sigma Aldrich.
2.4. Gene expression
Gene expression microarray data for parental SUM44 breast cancer cells, and the resistant variant LCCTam maintained in the presence of 500 nM 4HT, have been previously published and deposited with Gene Expression Omnibus (GEO; GSE12708, (Riggins et al., 2008)). Total RNA was isolated from SUM44 cells treated with 500 nM 4HT for 24 h, or LCCTam cells cultured in the absence of 4HT for 14 days, using TRIzol (ThermoFisher, Waltham, MA) and the RNEasy Mini Kit (Qiagen, Germantown, MD). Total RNA was labeled and processed for hybridization to Affymetrix U133A GeneChips as described previously (Gomez et al., 2007;
Riggins et al., 2008). These data are available through GEO acces- sion number GSE96570, and together as SuperSeries GSE96670.
Raw data for these and our previously published data (GSE12708, (Riggins et al., 2008)) were preprocessed together using the Robust Multiple-Array Average (RMA) method (Irizarry et al., 2003) using Bioconductor.
2.5. Array comparative genomic hybridization (aCGH)
Genomic DNA was isolated from SUM44 and LCCTam cells, the latter cultured in the absence of 4HT for 14 days, using the illustra triplePrep kit (GE Healthcare, Buckinghamshire, UK) according to manufacturer's instructions. DNA copy number analysis was per- formed using an oligonucleotide array-CGH platform (SurePrint G3 Human CGH Microarray 860 K; Agilent Technologies Inc., Santa Clara, CA), as published previously (Torresan et al., 2014). DNA isolated from peripheral blood from multiple normal individuals was used as reference DNA. Briefly, equal amounts of cell line and reference DNA were directly labeled with Cy3 and Cy5, respectively, using the SureTag Labeling Kit (Agilent Technologies) and hybrid- ized in the presence of human Cot1-DNA (Life Technologies) to the array for 40 h. The array was scanned using an Agilent array scanner and data was extracted using Feature Extraction (FE) software v10.10. For data analysis we used two different global analysis methods: Aberration Detection Module-2 (ADM-2, Agilent Tech- nologies) and Circular Binary Segmentation (CBS). Raw data can be found athttps://doi.org/10.17605/OSF.IO/7X8NG.
ADM-2. Data were analyzed using the Genome Workbench
version 7.0 software (Agilent Technologies). For each sample, FE gave a log10ratio (log of sample processed signal over reference processed signal for each gene) that was imported into Genome Workbench and transformed and viewed as a log2-based ratio.
Outliers detected by the FE were excluded from the analysis. The algorithm ADM-2 and a threshold value of 6.0 were applied with an aberrationfilter with a minimum number of 3 consecutive probes.
Gene amplifications and deletions were considered when the cor- responding plotted oligo-probes presented values of log2ratio in- tensity of the Cy5 dye (reference DNA)/intensity of the Cy3 dye (test DNA)>7/6 and log2<5/6, respectively.
CBS. To calculate log2(copy number ratio) for each probe, we considered only probes that had ControlType equal to '0'. We took the log2 of the ratio of the green to red signal after correction (gProcessedSignal/rProcessedSignal) for each probe. Segmentation analysis for the aCGH copy number log-ratio was then performed through the use of the Circular Binary Segmentation (CBS) Algo- rithm, as implemented in the DNAcopy package in R version 3.1.2 (Olshen et al., 2004; Venkatraman and Olshen, 2007). Default values for all parameters were used, except that consecutive seg- ments were merged using the undo.splits¼“sdundo”option with Fig. 1.Expression ofESRRGand receptor target genes in Luminal A ILC. A, Tumor-derived ILC Signature (TIS) comprises top discriminant genes (50 up, 50 down) differentially expressed between Luminal A ILC and Luminal A IDC in the TCGA dataset from (Ciriello et al., 2015). Down-regulated genes in ILC vs. IDC includeCDH1andPTEN, which are mutated and deleted in ILC respectively. B,ESRRGmRNA expression is significantly higher in Luminal A ILC vs. Luminal A IDC in the combined METABRIC dataset in cBioPortal. Gene expression microarray data were compared by Mann-WhitneyUtest. C and D, mRNA expression of a four-geneESRRGtarget signature is associated with poor outcome in Luminal A ILCs from TCGA (C) and METABRIC (D). mRNA levels are as measured by RNAseq (TCGA) or gene expression microarray (METABRIC), and high or low expression corresponds to above or below the median, respectively. Log-rank values calculated by cBioPortal.
the undo.SD parameter set to 0.3/DLRS, where DLRS (derivative log ratio spread) represents the local SD in log ratio units, a well-known measure of local variability for aCGH microarrays. In this way, the segmentation algorithm was tuned to detect copy number changes of at least 0.3 in magnitude on the log2 scale. Segments were re- ported as amplified or deleted if the corresponding estimated copy number ratio was greater than 1.3 or less than 0.7, respectively.
Copy-number plots were created in R showing the log2 green:red ratios as colored points and the CBS-generated segments as black lines; any segments falling outside the plot range are indicated as labeled black points.
2.6. Whole-exome sequencing (WES)
Genomic DNA was isolated from SUM44 and LCCTam cells, the latter cultured in the absence of 4HT for 14 days, using the DNeasy Mini kit (Qiagen). Exome enrichment was performed using the Illumina TruSeq Exome Library Prep Kit (San Diego, CA), then sequenced on an Illumina HiScanQ instrument at Children's Na- tional Medical Center. Paired-end sequencing reads were obtained for all samples. NGS reads were mapped to the hg19 human reference genome using BWA-MEM (Li and Durbin, 2009), dupli- cate reads were removed using Picard (unpublished, http://
broadinstitute.github.io/picard/), local realignments were per- formed using GATK (McKenna et al., 2010), and .bamfiles of bio- logical replicates were merged using SAMtools (Li et al., 2009) to increase the total coverage. The variants were called using Atlas2 Suite (Challis et al., 2012). A population frequency threshold of 1%
was used to filter out common variants. Four next-generation sequencing (NGS) cohort databases were used to determine allele frequencies in population, including 1000 Genome Project (Abecasis et al., 2012), Human Genetic Variation Database (Higasa et al., 2016), Exome Aggregation Consortium (Lek et al., 2016) and CHARGE cohort (Psaty et al., 2009). After the frequency-based filtering step, the putative functional consequences of remaining rare variants were annotated using ANNOVAR (Wang et al., 2010).
The synonymous variants were furtherfiltered out and dbNSFP (Liu et al., 2013) was used to compilein silicopredictions about the deleteriousness of nonsynonymous variants. Raw data can be found athttps://doi.org/10.17605/OSF.IO/7X8NG.
2.7. Quantitative real-time PCR (qRTPCR) and endpoint PCR
Total RNA was isolated from SUM44 cells or LCCTam cells cultured in the absence of 4HT for 14 days, using TRIzol (Thermo- Fisher) and the RNEasy Mini Kit (Qiagen). RNA was reverse tran- scribed using the High Capacity cDNA Reverse Transcription kit (ThermoFisher). Primers were synthesized by Integrated DNA Technologies (Coralville, IA) and sequences are listed in Table 1.
qRTPCR was performed using Power SYBR Green PCR Master Mix (ThermoFisher) in 384-well plates using the Applied Biosystems 7900HT Fast Real-Time PCR System. For each gene of interest, the 2DDctmethod described by Applied Biosystems (Life Technologies) compared with the geometric mean of the Ct values forb-actin (ACTB) andb-tubulin (TUBB) acting as housekeeping genes was used to calculate relative expression.
2.8. Western blot
SUM44 and LCCTam cells were seeded in 6-well plastic tissue culture plates at 250,000 cells/well 24e48 h prior to treatment with the indicated concentrations of drug, or prior to lysis in the case of untreated cells. Cell lysate preparation in modified RIPA buffer, SDS-PAGE, and transfer to nitrocellulose membrane were carried out as described previously (Heckler et al., 2014, 2016;
Riggins et al., 2008). Membranes were blocked in 5% nonfat dry milk in TBST buffer, then probed overnight with the following primary antibodies: phospho-MAPK (1:500e1:1000) and total MAPK (1:500e1:1000) from Cell Signaling (Danvers, MA);
phospho-Serine 118 ERalpha (1:500) from EMD Millipore (Billerica, MA); and total ERalpha (clone 6F11, 1:500e1:1000) from Vector Labs (Burlingame, CA). Incubation with horseradish peroxidase (HRP)-conjugated secondary antibodies from GE Healthcare (1:5000) and exposure tofilm were performed as described pre- viously (Heckler et al., 2014, 2016; Riggins et al., 2008). Membranes were reprobed for beta-actin (Sigma Aldrich, 1:10,000) or GAPDH (Santa Cruz Biotechnology, 1:5000) for1 h at room temperature as a loading control.
2.9. Immunofluorescence microscopy
SUM44 and LCCTam cells were seeded on poly-l-lysine (Sigma) coated 18 mm diameter round coverslips in 24-well plastic tissue culture plates at 80,000 cells/well. 48 h later, cells werefixed in 3.2% paraformaldehyde for 5 min, washed with PBS, then per- meabilized with 0.2% Triton X-100 for 5 min. Cells were incubated with an anti-GRM1/mGluR1 primary antibody (Cell Signaling, 1:200) in antibody diluent (0.1% gelatin, 10% normal donkey serum in PBS). Staining negative controls were incubated in antibody diluent only. All coverslips were then co-incubated for 20 min with AlexaFluor594-conjugated anti-rabbit secondary antibody (Life Technologies, 1:200), DAPI (Life Technologies, 1:500), and Alexa- Fluor488-conjugated phalloidin (Cytoskeleton, Denver, CO, 1:300).
Phalloidin was used to establish consistent focal planes across samples for image capture, but not included in the final image stack. Stained cells were imaged on a Leica SP8 AOBSþþ laser scanning confocal microscope in the LCCC Microscopy and Imaging Shared Resource (MISR). Gain and exposure time were established for LCCTam cells prior to imaging SUM44 and negative control coverslips, changing only focus to acquire these images.
2.10. Cell proliferation
SUM44 and LCCTam cells were seeded in 96-well plastic tissue culture plates at 10,000 cells/well. MDA-MB-231 cells were seeded at 1000 cells/well. 24e48 h later, cells were treated with the indi- cated concentrations of 4HT, U0126, Riluzole (RIL), Fulvestrant (ICI), or combinations thereof. For 4HT/U0126 experiments, SUM44 and LCCTam cells were treated for 10 days while MDA-MB-231 cells were treated for 6 days. For RIL/ICI experiments, SUM44 and LCCTam cells were treated for 8 days. At the conclusion of each experiment, cells were stained with a solution of 0.5% crystal violet in 25% methanol. Once dry, the crystal violet stain was resolubilized with citrate buffer and a dual-wavelength absorbance measure- ment was obtained from an ELx808 plate reader (BioTek, Winooski, VT) in the LCCC Genomics and Epigenomics Shared Resource (GESR) at 562 and 405 nm as previously described (Heckler et al., 2016).
Table 1 qRTPCR primers.
Gene Forward Reverse
NF1 GAAGTAGGCAGCTGACAGAAA TCAACCACCATGGACTGAAC
MAPK1 TCCCAAATGCTGACTCCAAA TCGTCACTCGGGTCGTAATA
FOXA1 GGGGGTTTGTCTGGCATAGC GCACTGGGGGAAAGGTTGTG
GRM2 AACTTCAACGAGGCCAAG TCACTGGAGGTGACATAGAA
ACTB GAGCACAGAGCCTCGCCTTT TCATCATCCATGGTGAGCTGG
TUBB ATTCCAACCTTCCAGCCTGC CCAGAACTTGGCACCGATCT
2.11. Image and statistical analysis
Image compilation was performed using Adobe Photoshop Creative Suite 5.1 (San Jose CA), and all statistical analyses other than those discussed above for eomics assays were performed using GraphPad Prism 6.0 or 7.0 (La Jolla CA). Venn diagrams were generated using Venny 2.1 (http://bioinfogp.cnb.csic.es/tools/
venny/index.html). Statistical significance is defined as p0.05, with the following labeling convention: *p < 0.05; **p < 0.01;
***p<0.001; and ****p<0.0001. The details of each test performed are shown in the relevant Figure Legends. In the survival analysis including multiple genes the mean expression of the signature was computedfirst and the median of the mean was used as thefinal cutoff in the Cox regression analysis. Relative index (RI) calculations were used to test the nature of the interaction between U0126 and 4HT, or Riluzole (RIL) and Fulvestrant (ICI) (Romanelli et al., 1998).
Briefly, the R index is calculated as the expected cell survival (Sexp; the product of relative survival in 4HT or ICI and relative survival in U0126 or RIL) divided by the observed relative survival in the presence of the combination (Sobs, 4HTþU0126 or ICIþRIL). Sexp/ Sobs¼1.0 denotes an additive interaction, while>1.0 denotes a synergistic interaction, though R index values approaching 2.0 are indicative of more robust synergy (Romanelli et al., 1998).
3. Results and discussion
3.1. Relevance of ESRRG and the SUM44/LCCTam model system to Luminal A ILC clinical specimens
We previously demonstrated that ERRg stimulates TAM- resistance in the SUM44/LCCTam model of ILC (Riggins et al., 2008), now characterized as belonging to the hormone related (HR) ILC subtype (Michaut et al., 2016). Exogenous expression of ESRRGwas later shown to induce TAM-resistance in other, non-ILC breast cancer models (Girard et al., 2015; Lü et al., 2015).ESRRGis located at chromosome 1q41, which is more often amplified in ILC vs. IDC (Desmedt et al., 2016; Gruel et al., 2010; Michaut et al., 2016). Accordingly,ESRRGmRNA expression is significantly higher in primary Luminal A ILC vs. IDC tumors in both The Cancer Genome Atlas (TCGA) (Fig. 1A) and METABRIC datasets (Fig. 1B). In TCGA,ESRRGis among the top ~100 genes that discriminate ILC from IDC. We recently published a signature of 37 validated tran- scriptional target genes ofESRRGthat is prognostic in TAM-treated breast tumors irrespective of histologic subtype (Madhavan et al., 2015), and show here that a 4-gene subset of this signature (AHSA1, TIMM17A, TRRAP, SPTLC2) has better prognostic value in Luminal A ILC (Fig. 1C) than Luminal A IDC (Supplementary Fig. 1A) in the TCGA dataset. There is a similar trend in Luminal A ILC from the METABRIC dataset, but it does not reach statistical significance (Fig. 1D,Supplementary Fig. 1B). These data support the relevance of the SUM44/LCCTam model system as a platform to identify additional alterations in gene expression, as well as copy number and mutations, in ILC that are associated with poor response to TAM.
3.2. Gene expression analysis identifies differential transcriptome response to 4HT in LCCTam cells
The LCCTam cell line was selected by growing cells in increasing doses of 4HT, and thus microarray analysis of how SUM44 and LCCTam cells respond to 4HT gives insight into what drives resis- tance. We previously reported that, in conjunction withESRRG, aberrant activating protein 1 (AP1) activity plays a key functional role in the TAM-resistant phenotype of LCCTam cells, and identified candidate AP1-regulated genes whose expression is increased in
LCCTam cells (Riggins et al., 2008). This was based on gene expression microarray analysis comparing parental SUM44 cells with LCCTam cells continually maintained in 500 nM 4HT (GSE12708). To extend these findings and determine how 4HT might differentially affect the transcriptome of SUM44 and LCCTam cells, we performed additional gene expression microarrays on RNA extracted from SUM44 cells treated with 500 nM 4HT for 24 h, and from LCCTam cells cultured in the absence of 4HT for 14 days.
Affymetrix U133A raw data from all four experimental conditions (2 pre-existing, 2 new) were preprocessed together, and we iden- tified genes with a fold change of1.45 for each pairwise com- parison with a univariate p value 0.05 (Fig. 2A). Specifically, SUM44 cells treated with 4HT were compared with untreated cells, and LCCTam grown in 4HT were compared with those removed from 4HT. As anticipated, there are fewer overall changes in gene expression in response to 4HT in LCCTam cells. The 1980 genes that are differentially expressed in response to 4HT in both SUM44 and LCCTam are largely regulated in the same direction, and presum- ably represent genes that do not drive TAM-resistance, since their induction or repression by 4HT occurs despite differences in growth response between these two cell lines.
We then compared gene networks and pathways that are altered in response to 4HT in sensitive (SUM44) and resistant (LCCTam) cell lines using Ingenuity Pathway Analysis (IPA,Fig. 2B and C andSupplementary Tables 2 and 3). The PI3K/AKT pathway is differentially regulated in response to 4HT in SUM44 and LCCTam, whereby “PI3K/AKT Signaling” is increased in LCCTam in the presence of 4HT (Z score 0.7303) but decreased in SUM44 in the presence of 4HT (Z score0.8485).PIK3CAmutation is enriched in Luminal A ILC (Ciriello et al., 2015) and a likely driver of ILC endocrine resistance that could be targeted with PI3K inhibitors (Bosch et al., 2015). Pharmacological inhibition of this pathway is critical for overcoming endocrine resistance in long-term estrogen deprived (LTED) models of AI resistance (Miller et al., 2010) and in PTEN-knockdown breast cancer cells (Fu et al., 2014), though these are all of IDC origin.
Changes in gene expression seen only in SUM44 in response to 4HT should represent changes that drive growth inhibition, as this phenotype is not seen in LCCTam. “Aryl Hydrocarbon Receptor (AHR) Signaling”is the 5th most enriched pathway in SUM44, but the 26th for LCCTam. AHR signaling is repressed by 4HT in SUM44, but induced in LCCTam. Normally, AHR signals the presence of xenobiotics, but has also been implicated as important for organ- ogenesis and the renewal of breast cancer stem-like cells (Bock and K€ohle, 2006; Stanford et al., 2016). In an IDC xenograft model, TAM- resistant tumors treated with an AHR antagonist and 4HT exhibit decreased tumor growth compared with those treated with 4HT alone, or non-resistant tumors treated with an AHR antagonist (Dubrovska et al., 2012). Finally, significant differences are observed in components of the“Androgen Signaling”pathway. This pathway is the 4th most regulated pathway for the LCCTam list while it is 89th for SUM44 cells. Increased androgen receptor (AR) signaling can drive TAM-resistance in a model of IDC (De Amicis et al., 2010) and women treated with TAM have increased risk for resistance if their tumors have a high AR:ER protein expression ratio (Cochrane et al., 2014). We have previously reported that ER mRNA and pro- tein levels are reduced in LCCTam cells (Riggins et al., 2008), sug- gesting that LCCTam cells may have a functional increase in the AR:ER ratio that contributes to TAM resistance.
3.3. aCGH implicates MAPK1 amplification and FOXA1 gain in acquisition of TAM-resistance
Multiple studies have identified recurrent chromosomal am- plifications, gains, losses, and deletions characteristic of ILC
(Desmedt et al., 2016; Gruel et al., 2010; Michaut et al., 2016). By array comparative genomic hybridization (aCGH) we confirm that the parental SUM44 cell line has many of these features, including broad gain of chromosome 1q, losses on the p arm of chromosome 10 that encompass PTEN, and focal amplification of fibroblast growth factor receptor 1 (FGFR1) and cyclin D1 (CCND1) (Fig. 3A and (Forozan et al., 1999; Turner et al., 2010)). When wefirst established the TAM-resistant variant of SUM44 (LCCTam), we reported that there are no gross chromosomal rearrangements in LCCTam as compared to SUM44 (Riggins et al., 2008). Here, we use aCGH to morefinely map focal alterations that have emerged in LCCTam cells (Fig. 3B and C). Using two different global analysis methods (CBS and ADM-2), we identify a chromosome 22 amplification that encompasses mitogen activated protein kinase 1 (MAPK1, also known as extracellular signal regulated kinase 2 or ERK2) and a chromosome 8 deletion that includes CCAAT/Enhancer Binding Protein Delta (CEBPD). The ADM-2 method further identifies a chromosome 14 gain that includes the gene encoding forkhead box
A1 (FOXA1). All three of these genes have been previously impli- cated in altered response to endocrine therapy or ER signaling in ERþbreast cancer, whileFOXA1mutation is significantly enriched in Luminal A ILCs from TCGA (Ciriello et al., 2015; Fu et al., 2016;
Hurtado et al., 2011; Mendoza-Villanueva et al., 2016; Oyama et al., 2011; Wright et al., 2014). FOXA1 is a pioneer factor known to influence how ER and other steroid hormone receptors function (Fu et al., 2016; Hurtado et al., 2011; Jozwik and Carroll, 2012), including SUM44 cells, where FOXA1 motifs are highly enriched at sites of ER chromatin binding in the presence and absence of 17b- estradiol (Irish et al., 2016). It has been recently shown thatFOXA1 is amplified in TAM-resistant MCF7 cells and copy-number gain exists in 20% of TCGA breast tumors, especially in the Luminal B subtype (Fu et al., 2016). We subsequently validated a statistically significant increase in MAPK1 and FOXA1 mRNA expression (Fig. 3D), as well as elevated MAPK1 (ERK2) total protein and activating phosphorylation (Fig. 3E), in the resistant LCCTam cells.
Use of an insertional mutational screen in mice with Cdh1 Fig. 2.Response to 4HT differs in SUM44 and LCCTam and suggests targetable pathways of TAM-resistance. A, SUM44 cells were treated with 500 nM 4HT for 24 h and compared with controls while LCCTam maintained in 500 nM 4HT were compared with cells that were not treated with 4HT for 2 weeks. Affymetrix probe IDs for each comparison that had a fold change of1.45 with a univariate p-value0.05 were compared. B and C, Ingenuity Pathway Analysis (IPA) of Canonical Pathways for each cell line was completed and the top 20 affected pathways are shown; those discussed in the Results section are bolded. Red denotes pathways predicted to be downregulated in response to 4HT while green denotes upregulation. (For interpretation of the references to colour in thisfigure legend, the reader is referred to the web version of this article.)
inactivation implicated the MAPK pathway as a second hit neces- sary for ILC development in mouse models (Kas et al., 2017). Serine 118 of ER is a known substrate of ERK/MAPK signaling, and ER phosphorylation at this site has been implicated in poor response to TAM (Chen et al., 2013), though other studies contradict this (Kuske et al., 2006; Murphy et al., 2004). Here, we show that ER phos- phorylation at Serine 118 is markedly increased in the LCCTam resistant variant, in the presence and absence of 4HT. Recently developed LTED variants of ILC, which mimic resistance to AIs, also have increased MAPK activity (Sikora et al., 2016), demonstrating MAPK pathway deregulation in multiple, independent endocrine resistant ILC models. PI3K and MAPK pathways overlap and require a delicate balance for normal growth signaling (Aksamitiene et al., 2012; Mendoza et al., 2011), and these pathways are both altered in LCCTam. Further study of their functional interaction would be helpful to determine treatment options targeting either or both.
This is also relevant clinically, since primary Luminal A ILC tumors are enriched forPTENloss and AKT activation as compared to IDC (Ciriello et al., 2015).
3.4. Whole-exome sequencing identifies NF1 and multiple GRM/
mGluR mutations in acquired TAM-resistance
Mutations inCDH1are a hallmark of ILC, while those affecting PIK3CAandFOXA1are overrepresented in Luminal A ILC vs. Luminal A IDC. SUM44 cells have known loss of heterozygosity (LOH) and mutation ofCDH1(van de et al., 2001), but aside from this and LOH/
mutation ofTP53(p53) (Wasielewski et al., 2006), the mutational status of key drivers or breast cancer-associated genes in this ILC cell line is not known. With respect to mutations that arise during progression on endocrine therapy, multipleESR1(ER) mutations are increasingly appreciated as drivers of clinical resistance to AIs, and are also observed in a proportion of TAM- or Fulvestrant- resistant disease (Chandarlapaty et al., 2016; Fribbens et al., 2016;
Gelsomino et al., 2016; Paoletti et al., 2016; Schiavon et al., 2015;
Spoerke et al., 2016; Wang et al., 2016). However, none of these studies have specifically examined ILC.
We performed whole-exome sequencing (WES) analysis of SUM44 and LCCTam cells to identify mutations that arise during Fig. 3.MAPK1amplification andFOXA1gain in TAM-resistant ILC cells. A, Copy number plot for parental SUM44 cell line. Log2 copy number (CN) ratios (Y axis) are shown as colored points and the circular binary segmentation (CBS)-generated segments are shown as black lines. Gains and losses characteristic of ILC are shown. B, Copy number alterations in LCCTam vs. SUM44 cells. Genes with the largest amplification and deletion as determined by CBS are labeled as black squares. C, Table of selected chromosome locations, cytobands, and genes showing significant amplification, gain, or deletion in LCCTam cells as determined by ADM-2. *denotes chromosome 14 gain identified only by ADM-2, whereas others were identified by both CBS and ADM-2. D, Quantitative real-time polymerase chain reaction (RTPCR) validation of increasedMAPK1andFOXA1mRNA expression in LCCTam cells.
Data are presented as relative expression calculated by the 2DDCtmethod and are the mean of 5 biological replicates±standard deviation, with each biological replicate comprised of 3 technical replicates. Data were analyzed by Mann-WhitneyUtest. E, Western blot analysis of phosphorylated and total ERK1/2 (MAPK1gene¼ERK2 protein), phosphorylated and total ER, and GAPDH as a loading control. LCCTam -4HT cells were cultured in the absence of 4HT for 48 h. Data shown are from a single representative experiment that was performed independently twice. (For interpretation of the references to colour in thisfigure legend, the reader is referred to the web version of this article.)
acquisition of TAM-resistance. Both the parental SUM44 and resistant variant LCCTam contain wild typeESR1,ERBB2(HER2), and FOXA1, and maintain their previously reported CDH1 and TP53 mutations (Supplementary Table 4). Comparison of LCCTam to SUM44 cells identifies one hundred eighty (180) unique predicted protein- or splice site-altering mutations in one hundredfifty two (152) unique genes (Fig. 4A). The distribution of mutations is not uniform, with chromosomes 16 and 17 having more and chromo- somes 10 and 13 having fewer mutations per megabase (Mb) of chromosome length than predicted. We focused on three specific mutations (Fig. 4B). A splice-disrupting mutation is present in exon 43 of Neurofibromin 1 (NF1), a tumor suppressor that is a key negative regulator of the Ras/MAPK pathway, and while NF1 is frequently mutated in sporadic breast cancers (Philpott et al., 2017), its role in ILC is not fully understood. We confirm thatNF1mRNA is expressed in both cell lines (Fig. 4C). Phenotypically, these data are consistent with our aCGH, PCR, and Western blot results inFig. 3
(where we show that MAPK pathway activation is deregulated in LCCTam cells) and with prior studies that implicateNF1 loss or mutation with reduced efficacy of endocrine therapy or poor prognostic factors, respectively (Mendes-Pereira et al., 2012;
Uusitalo et al., 2017).
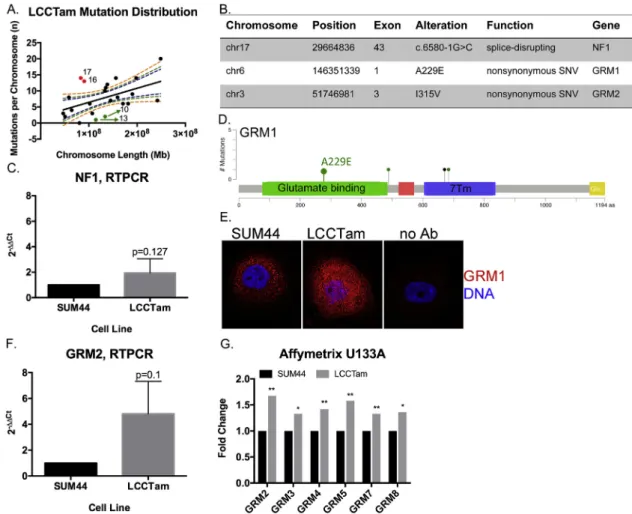
We further identify missense mutations in two members of the GRM/mGluR family,GRM1on chromosome 6 andGRM2on chro- mosome 3 (Fig. 4B). These members of the G-protein coupled re- ceptor (GPCR) superfamily are key players in normal and pathologic neurologic function, and there is a growing appreciation of their contribution to cancer (Feigin, 2013). TheGRM1A229E andGRM2 I315V mutations found in LCCTam cells reside in the extracellular glutamate binding regions of the receptors (Fig. 4D forGRM1). In TCGA,GRM1 mutations occur at a greater frequency in primary Luminal A ILC tumors (3%,Fig. 4D) than primary Luminal A IDC tumors (0.5%,c2¼0.08), whileGRM2mutations are not observed in ILC. Byfluorescent immunocytochemistry, mGluR1/GRM1 protein
Fig. 4.NF1and multiple GRMs/mGluRs are mutated in TAM-resistant ILC cells. A, Distribution of mutations in LCCTam cells by chromosome. Number of mutations per chromosome were analyzed in relation to chromosome length in megabases (Mb) by linear regression analysis. Dashed lines represent the 90%, 95%, and 99% confidence intervals. Red points denote chromosomes (numbers shown) with a greater than expected number of mutations, while green points denote those with fewer than expected. B, Table of selected chromosome locations, exons, alterations, and predicted functional consequences for genes mutated in LCCTam cells. C, Quantitative RTPCR validation ofNF1mRNA expression in LCCTam cells. Data are presented as relative expression calculated by the 2DDCtmethod and are the mean of 5 biological replicates±standard deviation, with each biological replicate comprised of 3 technical replicates. Data were analyzed by Mann-WhitneyUtest. D, Lollipop plot showing location ofGRM1mutations in Luminal A ILC from the TCGA dataset, and the A229E mutation detected in LCCTam cells. Green denotes missense and black denotes nonsense mutations. Positions of the extracellular ligand (glutamate) binding domain (green rectangle) and 7-pass transmembrane domain (7 Tm, blue rectangle) are shown. E, GRM1 protein expression in SUM44 and LCCTam cells byfluorescent immu- nocytochemistry. Negative staining control¼no Ab (no primary antibody). Data shown are from a single representative experiment that was performed independently twice. F, Quantitative RTPCR validation ofGRM2mRNA expression in LCCTam cells. Data are presented as relative expression calculated by the 2DDCtmethod and are the mean of 3 biological replicates±standard deviation, with each biological replicate comprised of 3 technical replicates. Data were analyzed by Mann-WhitneyUtest. G, Multiple GRMs/mGluRs are upregulated in LCCTam cells. Affymetrix gene expression microarray data are presented as mean fold change (increase) in LCCTam -4HT vs. SUM44 cells for three biological replicates compared by unpairedt-test.
expression is markedly upregulated in LCCTam cells (Fig. 4E), while mRNA for GRM2 andfive (5) other GRM family genes are increased in LCCTam cells (Fig. 4F and G). There is precedent for a functional interaction betweenGRM1,GRM2andGRM4and loss ofCDH1, a hallmark of ILC. (Telford et al., 2015) used a genome-wide small inhibitory ribonucleic acid (siRNA) library in isogenic mammary epithelial cellsewild type vs.CDH1-deletedeto identify synthetic lethal vulnerabilities in cells lacking CDH1. The most enriched functional category that preferentially inhibits CDH1-null cell viability (when silenced) contains>200 genes that code for GPCR signaling components, including these three GRMs/mGluRs. Finally, high expression of GRM1, GRM2, or GRM4 mRNA is each associated with poor distant-metastasis free survival in women with ERþbreast cancer treated with TAM, independent of lobular his- tology ((Mehta et al., 2013) andSupplementary Fig. 2). However, mechanistic studies of GRM/mGluR function in breast cancer have largely focused on the triple negative or basal type (Banda et al., 2014; Teh et al., 2015). Altogether these data suggest multiple GRMs/mGluRs as potential players in TAM-resistant breast tumors, including ILC.
3.5. MEK or glutamate release inhibitors restore or enhance endocrine response in SUM44/LCCTam cells
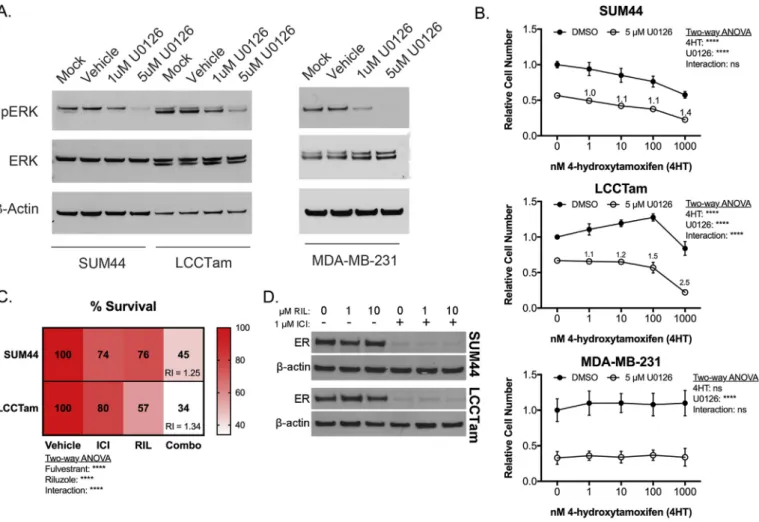
Hyperactivation of the MAPK/ERK cascade is a common feature of endocrine resistance in ERþbreast cancer patients (Rugo et al., 2016) and preclinical models (Creighton et al., 2006; Riggins et al., 2007). Here, we identifyNF1mutation,MAPK1amplification and upregulation, and increased MAPK substrate phosphorylation (ER Serine 118) in TAM-resistant ILC cells. MAPK activity is also increased in ILC-derived LTED cells, a model for resistance to AIs (Sikora et al., 2016). Accordingly, U0126ea potent and selective MEK inhibitor chemical probe (Duncia et al., 1998) known to enhance TAM responsiveness (Donovan et al., 2001; Kronblad et al., 2005; Kurokawa et al., 2000)esuppresses MAPK/ERK phosphor- ylation in ILC cells (Fig. 5A), and is additive or better-than-additive in combination with TAM in suppressing the growth of responsive (SUM44) or resistant (LCCTam) ILC cells, respectively (Fig. 5B).
U0126 does not confer TAM response to ER-negative MDA-MB- 231 cells (Fig. 5B), suggesting that interaction between MEK inhi- bition and TAM requires ER.
The clinical efficacy of MEK inhibitors is unfortunately quite
Fig. 5.The MEK inhibitor U0126 or the glutamate release inhibitor Riluzole enhances or restores endocrine response in ILC cells. A, MEK inhibitor U0126 suppresses ERK phos- phorylation. Cells were treated as indicated for 48 h prior to Western blot analysis for phosphorylated ERK1/2 (MAPK1gene¼ERK2 protein), andb-actin as a loading control. Data shown are from a single representative experiment. B, Crystal violet cell proliferation assays conducted for 10 days (SUM44, LCCTam) or 6 days (MDA-MB-231) in the presence of the indicated concentrations of 4HT and/or U0126. Media were changed twice (SUM44, LCCTam) or once (MDA-MB-231) during the course of the experiment. Data are presented as mean relative cell number±standard deviation for 5e6 technical replicates from an independent experiment performed at least twice. Data were analyzed by two-way ANOVA with post hoc Bonferroni correction. Relative index (RI) values¼1 are additive,>1 are synergistic. C, Crystal violet proliferation assays conducted for 8 days in the presence of 1mM Fulvestrant (ICI), 10mM Riluzole (RIL), or the combination (Combo). Media were changed once during the course of the experiment. Data are presented as mean % survival for 5e6 technical replicates from an independent experiment performed three times. Data were analyzed by two-way ANOVA with post hoc Tukey's test. Relative index (RI) values¼1 are additive,>1 are synergistic. D, Expression of ER protein in SUM44 and LCCTam cells following 24 h treatment with the indicated concentrations of Riluzole (RIL) alone or in combination with 1mM Fulvestrant (ICI), withb-actin as a loading control. Data shown are from a single representative experiment performed independently three times.
variable, even in malignancies like non-small cell lung cancer and melanoma where mutations in MAPK/ERK pathway components are very common (Brant et al., 2017). These drugs also have frequent dose-limiting toxicities. An attractive alternative to MEK inhibition as a therapeutic strategy in ERþILC may be inhibition of GRMs/mGluRs. Multiple GRMs upregulated in LCCTam cells (Fig. 4G) are transducers of pro-proliferative glutamate signaling (Feigin, 2013; Willard and Koochekpour, 2013; Yu et al., 2016), and GRM1mutations can lead to hyperactivation of the MAPK pathway in response to paracrine or autocrine glutamate (Esseltine et al., 2013). Riluzole (Rilutek, RIL) is a broad-spectrum glutamate release inhibitor that can inhibit paracrine or autocrine signaling through multiple GRM family members (Abushahba et al., 2012;
Martino et al., 2013; Wen et al., 2014), and has preclinical efficacy in several different cancer models (Speyer et al., 2016; Teh et al., 2015; Yu et al., 2016). We therefore tested RIL's ability to inhibit ILC cell growth alone or in combination with endocrine therapy. RIL has single agent growth-inhibitory activity and is significantly better than additive in combination with Fulvestrant (ICI), a se- lective estrogen receptor degrader (SERD) in both cell lines (Fig. 5C). RIL alone has no effect on ER expression, nor does it modify downregulation of ER by ICI (Fig. 5D). Together these data show that perturbation of two different actionable alterations identified in this study (MAPKamplification and hyperactivation, GRM/mGluR mutation and upregulation) are effective against TAM- resistant and responsive ILC cells. These data also provide (to our knowledge) thefirst preclinical proof of concept for the combina- tion of RIL with endocrine therapy in ER þ breast cancer, and specifically ILC.
4. Conclusions and future directions
A comprehensive analysis of genetic alterations in a preclinical model of TAM-resistant ILC provides an opportunity to identify novel pathways of resistance, ultimately leading to better treat- ment options for patients. We completed Affymetrix gene expres- sion arrays, Agilent aCGH, and Illumina WES on the parental SUM44 and TAM-resistant LCCTam cell lines to gain insight into similarities and differences in affected pathways across all three platforms.
Analysis of AHR ChIPseq data shows enrichment of a consensus FOXA1binding motif in MCF7 cells (Lo and Matthews, 2012).FOXA1 mutation is a defining feature of Luminal A ILC (Ciriello et al., 2015), and in LCCTam cells we reportFOXA1gain and increased mRNA expression, although its sequence is wild type based on our WES data. Altogether, these data suggest that further study of the cross talk betweenFOXA1and AHR in this and other ILC models is war- ranted. In prostate cancer, FOXA1 directs where AR binds in the genome (Sahu et al., 2011; Wang et al., 2011), and in a TNBC AR- positive cell line, AR binding sites almost completely overlap with FOXA1 (Robinson et al., 2011). While AR signaling is predicted to be upregulated in LCCTam, knowledge of how FOXA1 influences AR signaling in ILC requires further study. Therapies targeting FOXA1 in breast cancer are in early stages of development, and may prove useful in the treatment of ILC as they mature (Johnston et al., 2016).
Multiple alterations in copy number, sequence, and mRNA or protein expression acquired by LCCTam cells impinge on the MAPK/
ERK signaling network, includingMAPK1amplification, upregula- tion, and hyperactivation, as well as NF1 mutation. Functional validation further shows that MEK inhibition by U0126 improves or restores TAM response in SUM44 and LCCTam cells. These data suggest that MAPK deregulation is a core feature of the TAM resistant phenotype of LCCTam cells, but we cannot rule out the potential contributions of other alterations detected by aCGH and/
or WES. For example, LCCTam cells have acquired a frameshift
deletion mutation in X-box binding protein 1 (XBP1, c.333delA, K111fs).XBP1is a known mediator of endocrine resistance (Davies et al., 2008; Gomez et al., 2007; Hu et al., 2015) and, if translated, this truncated XBP1 protein product would encode thefirst 111 amino acids, which contain the region required for binding and activating ER in the absence of estrogen (Ding et al., 2003). Whether this mutantXBP1may contribute to TAM resistance in LCCTam cells requires further study.
In the TCGA dataset GRM1 mutations are more prevalent in primary Luminal A ILC than IDC, and most somaticGRM1mutations lead to hyperactivation of the MAPK pathway in response to glutamate (Esseltine et al., 2013). Here, we show that multiple members of the GRM/mGluR family are mutated and/or upregu- lated at the mRNA and protein level in LCCTam cells. The most novel finding of our study is that RIL, a broad-spectrum glutamate release inhibitor that inhibits paracrine or autocrine signaling through multiple GRM family members, has significant single-agent and combinatorial activity with ICI in TAM-responsive anderesistant ILC cells. RIL's activity in other breast cancer models is not specif- ically dependent upon GRM1, since silencing or overexpression of GRM1 does not alter RIL-mediated growth inhibition (Speyer et al., 2016). This is in contrast to RIL efficacy in melanoma, which is tightly associated with GRM1 expression. It may be that multiple GRM/mGluR family members are required to transduce RIL's anti- proliferative effect in breast cancer, an attractive idea given that our data show multiple GRMs/mGluRs are simultaneously mutated and/or upregulated in TAM-resistant ILC cells. RIL is currently FDA approved for slowing the progression of Amyotrophic Lateral Sclerosis (ALS), and in Phase 1 clinical trials for melanoma (NCT01303341). RIL is also the subject of a Phase 4 study testing its ability to inhibit inflammation-associated fatigue and cognitive dysfunction in breast cancer survivors by lowering levels of gluta- mate in the central nervous system (NCT02796755). Our data provide novel evidence supporting the rational combination of RIL with endocrine agents, specifically in ILC where there already ap- pears to be a GRM/mGluR dependency in the presence ofCDH1loss (Telford et al., 2015). The extensive pre-existing clinical experience with RIL in other disease settings makes repurposing this drug for endocrine resistant, ER þbreast cancer, and in particular ILC, a viable strategy to improve treatment outcomes in the near term.
There remains a lack of clear consensus whether patients with ILC have a worse outcome than patients with IDC (Brouckaert et al., 2014; Colleoni et al., 2012; Fritz et al., 2010; Pestalozzi et al., 2008).
What is clear is that IDC and ILC have distinct molecular signaling and treatment regimens should consider these histologic subtypes as distinct (Fritz et al., 2010; Weigelt et al., 2010). ILC tumors are more commonly ERþ (Pestalozzi et al., 2008), historically sug- gesting endocrine therapies should be beneficial for these patients.
However, recent retrospective studies now show that patients with ILC do not fare as well on TAM (Metzger Filho et al., 2015) or exemestane (Strasser-Weippl et al., 2016) as compared to those with IDC. Two ongoing prospective clinical trials seek to clarify which endocrine therapy is most effective for ERþILC. Thefirst, NCT02206984, is a neoadjuvant window trial comparing 21e24 days of Fulvestrant, TAM, or Anastrazole in women with ERþ, HER2- ILC. The second, NCT02764541, is a perioperative study in which the neoadjuvant phase will compare 15 days of Letrozole to TAM in cohorts of women with either ERþ ILC or IDC; in the adjuvant phase, women will continue on endocrine therapy with or without the addition of the CDK4/6 inhibitor palbociclib. In each study, the primary objective is to determine change in proliferation (Ki67) pre- and post-neoadjuvant treatment, with secondary ob- jectives that include assessments of ER, ER-regulated genes and other measures with the goal of identifying markers of endocrine response and resistance unique to ILC. Coupled with our preclinical
models and those of others in thefield (Jambal et al., 2013; Sikora et al., 2014, 2016), these efforts should identify a number of actionable alterations that can be targeted to improve therapeutic outcomes for women with ERþILC.
Funding sources
These studies were supported in part by a Career Catalyst Research Grant from Susan G. Komen for the Cure (KG090187) to RBR, by pilot and start-up funds to RBR from the Lombardi Comprehensive Cancer Center (LCCC) Support Grant (P30-CA- 051008; Principal Investigator Louis M. Weiner), U54-CA-149147 (Principal Investigator Robert Clarke) and HHSN2612200800001E (co-Program Directors Robert Clarke and Subha Madhavan), as well as by a Department of Defense Breast Cancer Research Program Breakthrough Award (W81XWH-14-1-0326) to XF. This work was also generously supported by funds from Georgetown Lombardi Women&Wine, a philanthropic group that supports research at the Nina Hyde Center for Breast Cancer Research. HS and MMH were supported by the LCCC's Training Grant in Tumor Biology (T32-CA-009686; Principal Investigator Anna T. Riegel). MMH was also supported by the LCCC's Post Baccalaureate Training in Breast Cancer Health Disparities Research grant (PBTDR12228366; Prin- cipal Investigator Lucile L. Adams-Campbell). Technical services were provided by the LCCC Genomics & Epigenomics Shared Resource (GESR), Microscopy and Imaging Shared Resource (MISR) and Tissue Culture Shared Resource (TCSR), which are also sup- ported in part by P30-CA-051008. The content of this article is solely the responsibility of the authors and does not necessarily represent the official views of the National Cancer Institute, the National Institutes of Health, Susan G. Komen for the Cure, or the Department of Defense Breast Cancer Research Program.
Acknowledgements
We are grateful to C. Savio Chan, Aileen Fernandez, Britta Jacobsen, Michael Johnson, Filipa Lynce, Raquel Nunes, Matthew Sikora, Deanna Tiek, and members of the Georgetown Breast Can- cer Advocates (https://breastcanceradvocacy.georgetown.edu) for their insights and/or critical reading of the manuscript. We would also like to thank Peter Johnson (MISR) and Dionyssia Clagett (TCSR) for technical assistance.
Appendix A. Supplementary data
Supplementary data related to this article can be found at https://doi.org/10.1016/j.mce.2017.09.024. Raw aCGH and WES data can be found athttps://doi.org/10.17605/OSF.IO/7X8NG.
References
Abecasis, G.R., Auton, A., Brooks, L.D., DePristo, M.A., Durbin, R.M., Handsaker, R.E., Kang, H.M., Marth, G.T., McVean, G.A., Consortium GP, 2012. An integrated map of genetic variation from 1,092 human genomes. Nature 491, 56e65.
Abushahba, W., Olabisi, O.O., Jeong, B.S., Boregowda, R.K., Wen, Y., Liu, F., Goydos, J.S., Lasfar, A., Cohen-Solal, K.A., 2012. Non-canonical Smads phos- phorylation induced by the glutamate release inhibitor, riluzole, through GSK3 activation in melanoma. PLoS One 7, e47312.
Aksamitiene, E., Kiyatkin, A., Kholodenko, B.N., 2012. Cross-talk between mitogenic Ras/MAPK and survival PI3K/Akt pathways: afine balance. Biochem. Soc. Trans.
40, 139e146.
Azim, H.A., Davidson, N.E., Ruddy, K.J., 2016. Challenges in treating premenopausal women with endocrine-sensitive breast cancer. Am. Soc. Clin. Oncol. Educ. Book 35, 23e32.
Banda, M., Speyer, C.L., Semma, S.N., Osuala, K.O., Kounalakis, N., Torres Torres, K.E., Barnard, N.J., Kim, H.J., Sloane, B.F., Miller, F.R., et al., 2014. Metabotropic glutamate receptor-1 contributes to progression in triple negative breast can- cer. PLoS One 9, e81126.
Barroso-Sousa, R., Metzger-Filho, O., 2016. Differences between invasive lobular and
invasive ductal carcinoma of the breast: results and therapeutic implications.
Ther. Adv. Med. Oncol. 8, 261e266.
Bock, K.W., K€ohle, C., 2006. Ah receptor: dioxin-mediated toxic responses as hints to deregulated physiologic functions. Biochem. Pharmacol. 72, 393e404.
Bosch, A., Li, Z., Bergamaschi, A., Ellis, H., Toska, E., Prat, A., Tao, J.J., Spratt, D.E., Viola-Villegas, N.T., Castel, P., et al., 2015. PI3K inhibition results in enhanced estrogen receptor function and dependence in hormone receptor-positive breast cancer. Sci. Transl. Med. 7, 283ra251.
Brant, R.G., Sharpe, A., Liptrot, T., Dry, J., Harrington, E.A., Barrett, J.C., Whalley, N., Womack, C., Smith, P.D., Hodgson, D., 2017. Clinically viable gene expression assays with potential for predicting benefit from MEK inhibitors. Clin. Cancer Res. 23, 1471e1480.
Brouckaert, O., Laenen, A., Smeets, A., Christiaens, M.R., Vergote, I., Wildiers, H., Moerman, P., Floris, G., Neven, P., Leuven, M., 2014. Prognostic implications of lobular breast cancer histology: new insights from a single hospital cross- sectional study and SEER data. Breast 23, 371e377.
Cerami, E., Gao, J., Dogrusoz, U., Gross, B.E., Sumer, S.O., Aksoy, B.A., Jacobsen, A., Byrne, C.J., Heuer, M.L., Larsson, E., et al., 2012. The cBio cancer genomics portal:
an open platform for exploring multidimensional cancer genomics data. Cancer Discov. 2, 401e404.
Challis, D., Yu, J., Evani, U.S., Jackson, A.R., Paithankar, S., Coarfa, C., Milosavljevic, A., Gibbs, R.A., Yu, F., 2012. An integrative variant analysis suite for whole exome next-generation sequencing data. BMC Bioinforma. 13, 8.
Chandarlapaty, S., Chen, D., He, W., Sung, P., Samoila, A., You, D., Bhatt, T., Patel, P., Voi, M., Gnant, M., et al., 2016. Prevalence of ESR1 mutations in cell-free DNA and outcomes in metastatic breast cancer: a secondary analysis of the BOLERO- 2 clinical trial. JAMA Oncol. 2, 1310e1315.
Chen, M., Cui, Y.K., Huang, W.H., Man, K., Zhang, G.J., 2013. Phosphorylation of es- trogen receptoraat serine 118 is correlated with breast cancer resistance to tamoxifen. Oncol. Lett. 6, 118e124.
Christgen, M., Steinemann, D., Kühnle, E., L€anger, F., Gluz, O., Harbeck, N., Kreipe, H., 2016. Lobular breast cancer: clinical, molecular and morphological character- istics. Pathol. Res. Pract. 212, 583e597.
Ciriello, G., Gatza, M.L., Beck, A.H., Wilkerson, M.D., Rhie, S.K., Pastore, A., Zhang, H., McLellan, M., Yau, C., Kandoth, C., et al., 2015. Comprehensive molecular por- traits of invasive lobular breast cancer. Cell 163, 506e519.
Cochrane, D.R., Bernales, S., Jacobsen, B.M., Cittelly, D.M., Howe, E.N., D'Amato, N.C., Spoelstra, N.S., Edgerton, S.M., Jean, A., Guerrero, J., et al., 2014. Role of the androgen receptor in breast cancer and preclinical analysis of enzalutamide.
Breast Cancer Res. 16, R7.
Colleoni, M., Rotmensz, N., Maisonneuve, P., Mastropasqua, M.G., Luini, A., Veronesi, P., Intra, M., Montagna, E., Cancello, G., Cardillo, A., et al., 2012.
Outcome of special types of luminal breast cancer. Ann. Oncol. 23, 1428e1436.
Creighton, C.J., Fu, X., Hennessy, B.T., Casa, A.J., Zhang, Y., Gonzalez-Angulo, A.M., Lluch, A., Gray, J.W., Brown, P.H., Hilsenbeck, S.G., et al., 2010. Proteomic and transcriptomic profiling reveals a link between the PI3K pathway and lower estrogen-receptor (ER) levels and activity in ERþbreast cancer. Breast Cancer Res. 12, R40.
Creighton, C.J., Hilger, A.M., Murthy, S., Rae, J.M., Chinnaiyan, A.M., El-Ashry, D., 2006. Activation of mitogen-activated protein kinase in estrogen receptor alpha-positive breast cancer cells in vitro induces an in vivo molecular phenotype of estrogen receptor alpha-negative human breast tumors. Cancer Res. 66, 3903e3911.
Curtis, C., Shah, S.P., Chin, S.F., Turashvili, G., Rueda, O.M., Dunning, M.J., Speed, D., Lynch, A.G., Samarajiwa, S., Yuan, Y., et al., 2012. The genomic and tran- scriptomic architecture of 2,000 breast tumours reveals novel subgroups. Na- ture 486, 346e352.
Davies, M., Barraclough, D., Stewart, C., Joyce, K., Eccles, R., Barraclough, R., Rudland, P., Sibson, D., 2008. Expression and splicing of the unfolded protein response gene XBP-1 are significantly associated with clinical outcome of endocrine-treated breast cancer. Int. J. Cancer 123, 85e88.
De Amicis, F., Thirugnansampanthan, J., Cui, Y., Selever, J., Beyer, A., Parra, I., Weigel, N.L., Herynk, M.H., Tsimelzon, A., Lewis, M.T., et al., 2010. Androgen receptor overexpression induces tamoxifen resistance in human breast cancer cells. Breast Cancer Res. Treat. 121, 1e11.
Desmedt, C., Zoppoli, G., Gundem, G., Pruneri, G., Larsimont, D., Fornili, M., Fumagalli, D., Brown, D., Rothe, F., Vincent, D., et al., 2016. Genomic charac- terization of primary invasive lobular breast cancer. J. Clin. Oncol. 34, 1872e1881.
Ding, L., Yan, J., Zhu, J., Zhong, H., Lu, Q., Wang, Z., Huang, C., Ye, Q., 2003. Ligand- independent activation of estrogen receptor alpha by XBP-1. Nucleic Acids Res.
31, 5266e5274.
Donovan, J.C.H., Milic, A., Slingerland, J.M., 2001. Constitutive MEK/MAPK activation leads to p27Kip1 deregulation and antiestrogen resistance in human breast cancer cells. J. Biol. Chem. 276, 40888e40895.
Dubrovska, A., Hartung, A., Bouchez, L.C., Walker, J.R., Reddy, V.A., Cho, C.Y., Schultz, P.G., 2012. CXCR4 activation maintains a stem cell population in tamoxifen-resistant breast cancer cells through AhR signalling. Br. J. Cancer 107, 43e52.
Duncia, J.V., Santella III, J.B., Higley, C.A., Pitts, W.J., Wityak, J., Frietze, W.E., Rankin, F.W., Sun, J.H., Earl, R.A., Tabaka, A.C., et al., 1998. MEK inhibitors: the chemistry and biological activity of U0126, its analogs, and cyclization products.
Bioorg. Med. Chem. Lett. 8, 2839e2844.
Engstrøm, M.J., Opdahl, S., Vatten, L.J., Haugen, O.A., Bofin, A.M., 2015. Invasive lobular breast cancer: the prognostic impact of histopathological grade, E-