Cadaverine, a metabolite of the
microbiome, reduces breast cancer aggressiveness through trace
amino acid receptors
tünde Kovács
1, edit Mikó
1,5, András Vida
1,5, Éva Sebő
6, Judit toth
3, tamás Csonka
4, Anita Boratkó
1, Gyula Ujlaki
1, Gréta Lente
1, patrik Kovács
1, Dezső tóth3, péter Árkosy
3, Borbála Kiss
2, Gábor Méhes
4, James J. Goedert
7& péter Bai
1,5,8Recent studies showed that changes to the gut microbiome alters the microbiome-derived metabolome, potentially promoting carcinogenesis in organs that are distal to the gut. In this study, we assessed the relationship between breast cancer and cadaverine biosynthesis. Cadaverine treatment of Balb/c female mice (500 nmol/kg p.o. q.d.) grafted with 4T1 breast cancer cells ameliorated the disease (lower mass and infiltration of the primary tumor, fewer metastases, and lower grade tumors). Cadaverine treatment of breast cancer cell lines corresponding to its serum reference range (100–800 nM) reverted endothelial- to-mesenchymal transition, inhibited cellular movement and invasion, moreover, rendered cells less stem cell-like through reducing mitochondrial oxidation. Trace amino acid receptors (TAARs), namely, TAAR1, TAAR8 and TAAR9 were instrumental in provoking the cadaverine-evoked effects. Early stage breast cancer patients, versus control women, had reduced abundance of the CadA and LdcC genes in fecal DNA, both responsible for bacterial cadaverine production. Moreover, we found low protein expression of E. coli LdcC in the feces of stage 1 breast cancer patients. In addition, higher expression of lysine decarboxylase resulted in a prolonged survival among early-stage breast cancer patients. taken together, cadaverine production seems to be a regulator of early breast cancer.
Microbes that live on the surface or the cavities of the human body affect a large set of pathophysiological pro- cesses ranging from metabolic diseases to psychiatric disorders1–4 or neoplastic dieases3,5–7. The number of directly tumorigenic bacteria is extremely low (~10 species)8, however, dysbiosis is associated with cancers of the urinary tract9, cervix10, skin11, airways12, the colon8, lymphomas13,14, prostate9 and breast cancer15–22. Dysbiosis is often reflected as a loss of diversity of the microbiota (e.g.16). In colon carcinogenesis, immunogenic microbes probably promote the malignancy. However, the majority of the aforementioned cancers are located distantly from larger depots of microbes, hence, suggesting indirect induction or promotion mechanisms. Indeed, bacterial metabolites emerge as “endocrine” agents that are produced by the microbiome, are absorbed into the circulation, and exert their biological effects distantly.
Deconjugated estrogens17,18, secondary bile acids23–28, lipopolysaccharide29 or propionate (a short chain fatty acid (SCFA))30 were proposed to be involved in regulating transformation or cancer cell proliferation.
Nonetheless, the molecular mechanisms, through which bacterial metabolites expert their effects are largely unknown. Deoxycholic acid (DCA) was shown to reprogram the hepatocyte secretome, thereby, promoting hepa- tocellular carcinoma23,24. Another secondary bile acid, lithocholic acid was shown to inhibit proliferation of breast cancer cells through inhibiting Warburg metabolism and endothelial-to-mesenchymal transition, as well as by
1Department of Medical Chemistry, Faculty of Medicine, University of Debrecen, Debrecen, 4032, Hungary.
2Department of Dermatology, Faculty of Medicine, University of Debrecen, Debrecen, 4032, Hungary. 3Department of Oncology, Faculty of Medicine, University of Debrecen, Debrecen, 4032, Hungary. 4Department of Pathology, Faculty of Medicine, University of Debrecen, Debrecen, 4032, Hungary. 5MTA-DE Lendület Laboratory of Cellular Metabolism, Debrecen, 4032, Hungary. 6Kenézy Breast Center, Kenézy Gyula County Hospital, Debrecen, 4032, Hungary. 7National Cancer Institute, National Institutes of Health, Bethesda, 20982 MD, USA. 8Research center for Molecular Medicine, Faculty of Medicine, University of Debrecen, Debrecen, 4032, Hungary. Correspondence and requests for materials should be addressed to P.B. (email: baip@med.unideb.hu)
Received: 24 July 2018 Accepted: 5 December 2018 Published: xx xx xxxx
opeN
enhancing antitumor immunity26. LCA exerted its antitumor effects through the TGR5 receptor26. Importantly, the latter study showed that in early stages of breast cancer bacterial LCA biosynthesis was decreased suggesting a loss of an antiproliferative bacterial metabolite26.
Cadaverine (CAD) is produced by the decarboxylation of lysine that is performed by lysine decarboxylase (LDC) enzymes. Human cells code and express LDC, but numerous bacterial species of the human microbiome also expresses LDC either in a constant (LdcC in the LDC operon) or in an inducible (CadA in the Cad operon) fashion31,32. Bacteria use diamines, like cadaverine or putrescine, generated by the decarboxylation of lysine or arginine, to buffer the pH of their environment27. The effects of cadaverine on cancer cells and its role in car- cinogenesis is not characterized in detail. Therefore, we wanted to assess whether cadaverine can influence the behavior of breast cancer cells.
Results
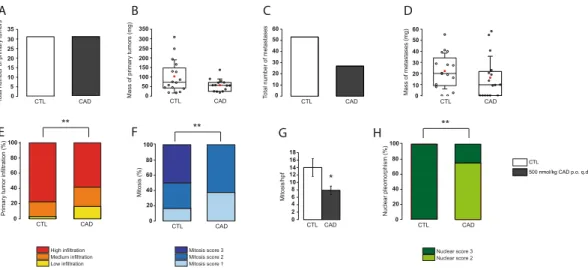
Cadaverine treatment reduces metastasis formation in 4T1-grafted mice. As first step, we tested the effects of cadaverine supplementation (500 nmol/kg) to mice homotopically grafted with 4T1 breast cancer cells. Cadaverine supplementation did not alter the number of primary tumors that grew from the grafted cells (Fig. 1A), but there was a trend towards tumors with lower mass (Fig. 1B). In line with that, the number of metas- tases decreased (Fig. 1C) and, as with the primary tumors, there was a trend for smaller metastases in the cadav- erine-treated mice (Fig. 1D). Importantly, cadaverine treatment decreased the invasivity of the primary tumors (Fig. 1E). Histological examination of the primary tumors revealed that cadaverine treatment decreased the rate of mitosis (Fig. 1F,G), the heterogeneity of nuclear morphology (Fig. 1H).
Cadaverine administration does not impair breast cancer proliferation.
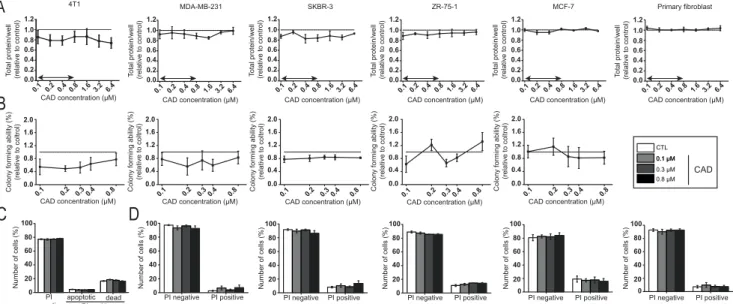
We investigated whether cadaverine administration could influence the proliferation of cultured breast cancer cell lines. We used five different established breast cancer cell lines of which four were of human (MD-MBA-231, SKBR3, ZR-75-1 and MCF7), while one was of murine origin (4T1). The cadaverine concentration that we used corresponded to the reference concentration of cadaverine in human serum (100–800 nM)33,34. Cadaverine slowed proliferation of 4T1, MDA-MB-231 and SKBR-3 cells as measured in SRB assay (Fig. 2A) or in colony forming assays (Fig. 2B), although the changes were not statistically significant. Importantly, the same concentrations of cadaverine did not hinder the proliferation of non-transformed primary human skin fibroblasts (Fig. 2A). We assessed whether slower proliferation could be due to the toxicity of cadaverine to cells. The proportion of the PI positive cells did not increase upon cadaverine treatment (Fig. 2D), nor did the apoptotic fraction in 4T1 cells (Fig. 2C).Cadaverine induced a mesenchymal-to-epithelial (MET) transition and invasion. We assessed whether cadaverine treatment can revert mesenchymal-like cancer cells to epithelial-like cells. First, we
**
A B C D
E F G H
Primary tumor infiltration (%)
CTL CAD
*
Mitosis/hpf
02 46 108 1214 16 18
0 20 40 60 80 100
High infiltration Medium infiltration Low infiltration
CTL CAD
Total number of metastases
CTL CAD
0 10 20 30 40 50 60
Mass of primary tumors (mg)
CTL CAD
350 300 250 200 150 100 50
0 Mass of metastases (mg)
CTL CAD
0 10 20 30 40 50 60
CTL
500 nmol/kg CAD p.o. q.d.
Total number of primary tumors
CTL CAD
35 30 25 20 15 10 5 0
Nuclear pleomorphism (%)
CTL CAD
0 20 40 60 80 100
Nuclear score 3 Nuclear score 2
**
Mitosis (%)
CTL CAD
0 20 40 60 80 100
Mitosis score 3 Mitosis score 2 Mitosis score 1
**
Figure 1. Cadaverine treatment reduces breast cancer aggressiveness in vivo. Female Balb/c mice were grafted with 4T1 cells as described and were treated with cadaverine (500 nmol/kg q.d. p.o.; CAD group) or vehicle (CTL) (n = 16/16) for 16 days before sacrifice. 6 samples from CTL group and 8 samples from cadaverine group underwent histological analysis. In CTL and CAD group (A) the number and (B) mass of primary tumors were counted and the (C) number and (D) mass of metastases were measured upon autopsy. (E) Upon autopsy, the infiltration rate of the primary tumor was scored. Significance (p = 0.002) was calculated using Fisher’s exact test with 2 × 3 Contingency Table. (F–H) Primary tumors were formalin-fixed and were embedded into paraffin, then sections were hematoxylin-eosin stained and were scored for (F) mitosis (p = 0.0031), (G) mitosis/hpf (p = 0.027) and (H) nuclear pleomorphism (p = 0.0097). Data is plotted as mean ± SEM. In box- whiskers charts (panels B and D) middle lines indicate the median, while red square symbol the mean. * and **
indicate statistically significant difference between CTL and CAD groups at p < 0.05 or p < 0.01, respectively.
Significance was calculated using two-sample student t-test (two-tailed) except for panel E, F and H, where Chi- square or Fisher’s exact test was used.
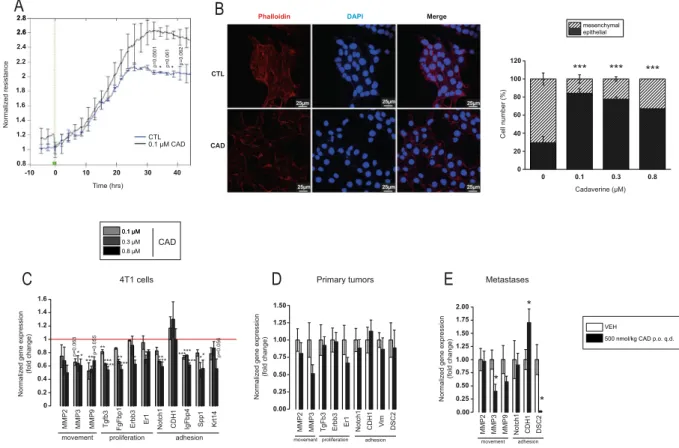
performed a measurement in the ECIS system in which 0.1 µM cadaverine increased resistance, suggesting bet- ter adherence of cells (Fig. 3A). To verify these findings, we stained cells with Phalloidin-Texas Red to visualize the arrangement of the actin cytoskeleton. Cadaverine treatment changed the fibroblast-like morphology of the 4T1 cells to a rather cobblestone-like morphology (Fig. 3B) that is characteristic for epithelial cells26. Treatment of MDA-MB-231 and SKBR-3 breast cancer cell lines with cadaverine led to similar morphological changes (Fig. S1A,D).
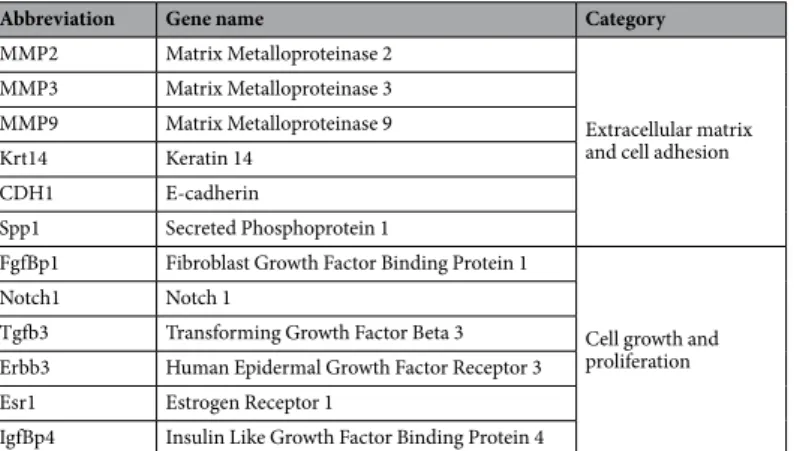
To gain insight into the molecular mechanism through which MET takes place we performed an RT-qPCR screen on EMT genes. The assay revealed differential expression of 11 genes after cadaverine treatment (Table 1), most were suppressed. MMP2, MMP3 and MMP9 support movement; Tgfb3, FgFbp1, Erbb3 and Er1 support proliferation; while Krt14, Notch1, CDH1, IgFbp4 and Spp1 support cell adhesion (Fig. 3C–E).
In line with these observations, cadaverine-treated cells were slower in migrating to open areas in scratch assays (Fig. 4A) and also performed worse in Boyden-chamber transmigration tests (Fig. 4B). These data were further supported by the observation that MMP9 expression was suppressed by cadaverine treatment in 4T1 cells (Fig. 4C), as well as in MDA-MB-231 and SKBR-3 breast cancer cell lines (Fig. S1B,E). We assessed metabolic changes evoked by cadaverine administration using the Seahorse flux analyzer. Cadaverine treatment reduced gly- colytic flux (Fig. 4D) that is a characteristic of breast cancer stromal cells35. Therefore, we assessed the “stem-ness”
of 4T1 cells using the aldefluor assay and found a mild reduction in cancer cell stem-ness (Fig. 4E). We found similar reductions in cancer cell stem-ness in MDA-MB-231 cells upon cadaverine treatment (Fig. S1C). We did not detect changes in lipid oxidation (Fig. S2).
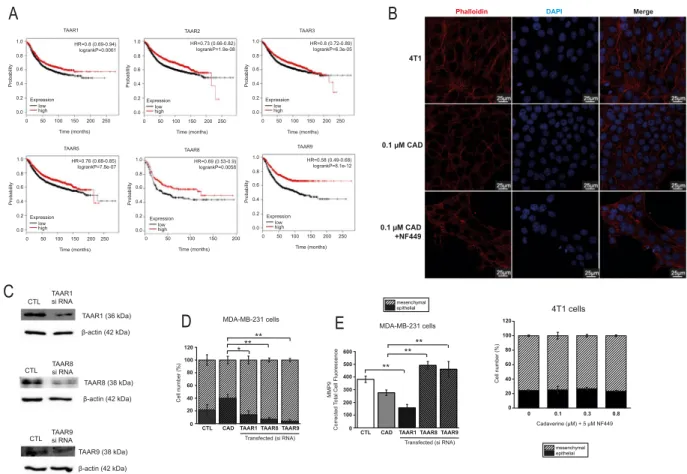
Cadaverine exert its beneficial effects through Trace Amino Acid Receptors (TAARs). The trace amino acid receptor family serve as receptors for cadaverine36. Although, most studies on TAAR focused on olfaction36, a study linked TAAR1 to breast cancer37. Indeed, higher expression of TAAR1, TAAR2, TAAR4, TAAR5, TAAR8 (in ER- cases) and TAAR9 provided better survival in breast cancer (Fig. 5A, Table 2). First, as TAAR receptors are G protein-dependent receptors36 we assessed their involvement by treating 4T1 cells with NF449, a Gsα-subunit-selective G-protein antagonist, a treatment that abolished the anti-EMT effect of cadav- erine (Fig. 5B). Next, we silenced TAAR1, TAAR8 and TAAR9 in MDA-MB-231 cells (Fig. 5C). The silencing of TAAR1, TAAR8 and TAAR9 prevented the cadaverine-elicited mesenchymal-to-epithelial transition and the silencing of TAAR8 and TAAR9 prevented the cadaverine-induced decrease in MMP9 expression (Fig. 5D,E).
Figure 2. Cadaverine reduces the proliferation and colony forming ability of breast cancer cells. (A) 4T1 (n = 6 in octuplicates), MDA-MB-231 (n = 3 in octuplicates), SKBR-3 (n = 3 in octuplicates), ZR-75-1 (n = 3 in octuplicates) and MCF-7 (n = 3 in octuplicates) breast cancer cells and primary fibroblasts cells were treated with cadaverine in the concentrations indicated for 48 hours then total protein concentrations were determined in SRB assay. Values are expressed as fold change, where 1 means protein content in the control cells (indicated by a dotted line). (B) 4T1, MDA-MB-231, SKBR-3, ZR-75-1 and MCF-7 (n = 3 for each in one replicate) cells were treated with cadaverine in the concentrations indicated for 4 days. Colonies were then stained according to May-Grünwald-Giemsa and counted using Image J software (n = 3). (C) 4T1 cells (n = 3 in triplicates) were treated with cadaverine in the concentrations indicated for 48 hours. Cells were stained with Annexin- FITC-PI Apoptosis Kit and analyzed by flow cytometry (n = 4). (D) 4T1 (n = 3 in triplicates), MDA-MB-231 (n = 4 in triplicates), SKBR-3 (n = 4 in triplicates), ZR-75-1 (n = 3 in triplicates), MCF-7 (n = 3 in triplicates) and primary fibroblasts cells were treated with cadaverine in the concentrations indicated for 48 hours. Dead cells were stained with propidium iodide (PI) and analyzed by flow cytometry. Data is plotted as mean ± SEM.
Significance was calculated using one-way ANOVA test. CAD – cadaverine, other abbreviations are in the text.
Double-headed arrow mark the serum reference concentration of cadaverine on panel A.
We assessed the available databases to collect data on TAAR1, TAAR8 and TAAR9. TAAR1 and TAAR9 expression did not show any major association with carcinogenesis or breast cancer subtypes in contrast to TAAR8. TAAR8 expression decreased in pre-cancerous lesions, such as hyperplastic enlarged lobular units (HELUs) as compared to normal terminal ductal lobular units (TDLUs)38. In line with that, TAAR8 expression decreased in breast cancer39. Decreases in TAAR8 expression was different between the histological subtypes of breast cancer. TAAR8 expression was lower in triple negative breast cancers as compared to non-triple neg- ative breast cancers. There was a trend for lower TAAR8 expression in DCIS when compared to healthy tis- sue40, TAAR8 expression was lower in ductal invasive breast cancer as compared to healthy ducts41 and there was a trend for lower TAAR8 expression in lobular invasive breast cancer as compared to healthy lobes41. Taken together, apparently, in early stage of breast cancer TAAR8 expression decreases that is more pronounced in triple negative breast cancers.
Cadaverine biosynthesis is suppressed in breast cancer.
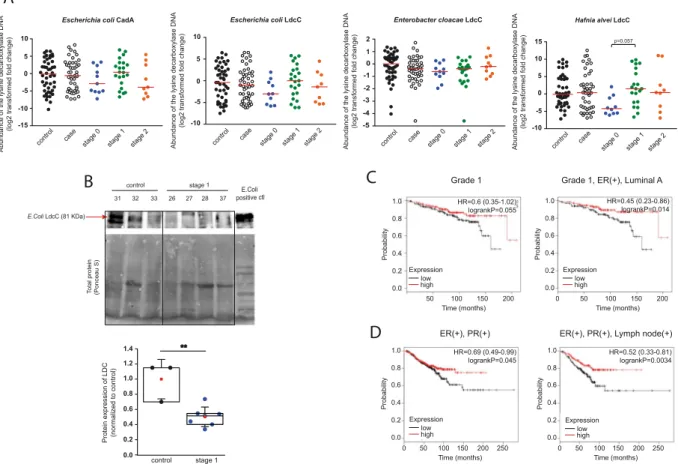
To get an insight whether intestinal cadaver- ine biosynthesis is modified in breast cancer patients, we assessed the abundance of the DNA coding for LdcC and CadA in human fecal DNA from the experimental cohort described in16. We designed primers for known CadA and LdcC genes in different bacteria. When comparing healthy individuals and breast cancer patients we observed slightly decreased abundance of Escherichia coli CadA and also E. coli, Enterobacter cloacae and Hafnia alvei LdcC DNA in breast cancer patients (Fig. 6A). Decreased CadA and LdcC abundance was more pronounced in clinical stage 0 patients as compared to the pool of all patients (Fig. 6A). Subsequently, we assessed the protein levels of E.coli LdcC protein in feces by Western blotting. In the feces of stage 1 patients LdcC protein levels were markedly lower than the levels in the feces of healthy subjects (Fig. 6B), in line with the lower fecal DNA abundances.
A
2.6 2.8
p=0.0501 * *p=0.06
1 p=0.062
Normalized resistance
0.8 1 1.2 1.4 1.6 1.8 2 2.2 2.4
0 10 20 30 40
-10
Time (hrs)
CTL0.1 µM CAD 2.6
2.8
25µm
Phalloidin DAPI Merge
CTL
CAD
25µm 25µm
25µm 25µm
25µm
B
** **** ** **
*** ****
**
****** * * ******
p=0.063 p=0.055 *** p=0.056
Normalized gene expression (fold change) 1.6 1.4 1.2 1 0.8 0.6 0.4 0.2 0
MMP2 MMP3 MMP9 Tgfb3 FgFbp1 Erbb3 Er1 Notch1 CDH1 IgFbp4 Spp1 Krt14
movement proliferation adhesion MMP2 MMP3 Notch1 CDH1 Vim DSC2
TgFb3 Erbb3 Er1 Normalized gene expression (fold change)
1.50 1.25 1.00 0.75 0.50 0.25 0.00
movement proliferation adhesion
MMP2 MMP3 MMP9 Notch1 CDH1 DSC2
movement adhesion 2.00
1.75 1.50 1.25 1.00 0.75 0.50 0.25 0.00 Normalized gene expression (fold change) *
*
*
E
C
4T1 cells Primary tumors Metastases0.1 µM
CAD
0.1 µM 0.8 µM 0.3 µM
VEH
500 nmol/kg CAD p.o. q.d.
D
mesenchymal epithelial
120 100 80 60 40 20
0 0 0.1 0.3 0.8
Cell number (%)
Cadaverine (µM)
*** *** ***
Figure 3. Cadaverine treatment reverses EMT of breast cancer cells. (A,B) In control and cadaverine-treated 4T1 cells (A) total cellular impedance was measured by ECIS (n = 2 in duplicate) (p = 0.0484 at 36 hrs. and 0.0487 at 40 hrs.) and (B) morphology of the actin cytoskeleton (representative picture of control and 0.1 µM cadaverine-treated cells) was assessed after Texas Red-X Phalloidin + To-Pro-3 staining (n = 2 in triplicates), ratio (%) of epithelial and mesenchymal cells was shown on bar chart. Significance was calculated using Chi- square test in Microsoft Excel (p = 2.97 × 10⁻²⁸ between control and 0.1 µM cadaverine, p = 1.04 × 10⁻¹⁸ between control and 0.3 µM cadaverine, p = 3.97 × 10⁻¹⁰ between control and 0.8 µM cadaverine). (C–E) Expression of a set of genes involved in EMT were assessed by RT-qPCR in (C) 4T1 cells (n = 3), (D) primary tumors (n = 16/16) and in (E) metastases (n = 16/16). All data is expressed as fold change. The red line that equals to 1 (no change) indicate the average of the control samples. Data is plotted as mean ± SEM. On panel A and C-E significance was calculated using two-sample student t-test (two-tailed), while on panel B One- way Anova was used to calculate differences. Significant p values were shown in Supplementary Table 4. *,**
and *** indicate statistically significant difference between control and treated groups at p < 0.05, p < 0.01 or p < 0.001 respectively. CAD – cadaverine, other abbreviations are in the text.
We assessed the GEO database to study LDC expression in human breast cancer. There was no difference in LDC mRNA expression between control and breast cancer cases42–44 or in LDC expression of the normal breast epithelium and cancer epithelium in patients45. Rather as an exception, LDC expression was lower in basal-like breast cancer as compared to control (normal) breast epithelium of non-diseased individuals46.
Finally, we assessed how expression of LDC in humans affects the outcome of breast cancer using the kmplot.
com database (the acquired data is represented in Table 3). Although, differences in LDC expression did affect Figure 4. Cadaverine treatment attenuate movement, invasion ability, mitochondrial oxidation and stem- ness of 4T1 cells. (A) 4T1 cells were treated with cadaverine in the concentrations indicated for 48 hours after scratching a 4T1 cell layer. Subsequent closure of the wound was assessed by the JULI-Br live cell analyzer system (n = 2). Significance was calculated using two-sample student t-test (two-tailed). (B) 4T1 cells were treated with cadaverine for 48 hours and subsequently invasion capacity of the cells was measured using the Corning Matrigel invasion chamber. Cells were counted using the Opera HCS system and invasion index was calculated (p = 0.003 both between control and 0.1 µM cadaverine, and control and 0.3 µM cadaverine, p = 4.14 × 10⁻⁴ between control and 0.8 µM cadaverine). (C) 4T1 cells were treated with vehicle and
cadaverine for 48 hours, then cells were stained for MMP9 and nucleus (DAPI) and sections were analyzed by confocal microscopy using a Leica SP8 confocal system. MMP9 content was calculated from the total cellular fluorescence measured by the Image J software (p = 0.001 between both control and 0.3 µM cadaverine and control and 0.8 µM cadaverine). (D) 4T1 cells were treated with vehicle and cadaverine for 48 hours (n = 3 in 24 replicates), then cells were subjected to a Seahorse XF96 analysis. Oxygen consumption rate (OCR) and extracellular acidification rate (ECAR) were measured and plotted (pOCR= 0.006 between control and 0.1 µM cadaverine, pOCR= 1.14 × 10⁻⁶ between control and 0.3 µM cadaverine, pOCR= 1.8 × 10⁻⁵ between control and 0.8 µM cadaverine). (E) 4T1 cells were treated with vehicle and cadaverine for 48 hours (n = 3 in triplicates), then cells were subjected to an Aldefluor assay (p = 0.035 between control and 0.3 µM cadaverine). Data is plotted as mean ± SEM. Significance was calculated using One-way Anova. *,** and *** indicate statistically significant difference between control and treated groups at p < 0.05, p < 0.01 or p < 0.001 respectively. CAD – cadaverine, other abbreviations are in the text.
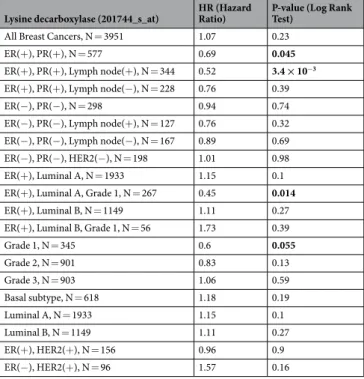
overall survival of the patients, in grade 1 patients higher expression of LDC was associated with significantly longer survival than lower expression of LDC (Fig. 6C). Interestingly, while LDC expression did not affect sur- vival in ER- PR- patients, higher LDC expression correlated with better survival in ER+ PR+ patients (Fig. 6D).
Discussion
In this study we assessed how cadaverine affects the behavior of breast cancer cells. Cadaverine is an ill-characterized biogenic amine as compared to – for example – putrescine that is characterized as a pro-carcinogenic agent31,47. Increased levels of diamines are in positive correlation with carcinogenesis; serum level of diamines are higher in cancer patients than in healthy individuals33,34,48. Moreover, surgical removal of tumors normalize serum diamine levels33,34. Based on these observations, polyamines were suggested as cancer markers49, although their efficiency was not proven47. While in the available literature levels of putrescine were equivocally higher in various cancer patients than in healthy individuals33,34,48, cadaverine levels were more variable among the studies, some reporting increases in cadaverine levels33,34,48, others with trends for decreases50. Breast cancer patients have not been evaluated.
Our data suggests that cadaverine has a tumor suppressor role in breast cancer in concentrations correspond- ing to the human reference range33,34. Cadaverine exerted its effects through inhibiting EMT, cellular movement, chemotaxis and metastasis (Fig. 7). These concentrations are much lower than the ones used in previous in vitro studies (10 µM in51 or 100 µM in52). Moreover, similarly to another cytostatic bacterial metabolite, lithocholic acid26, cadaverine, in the concentrations corresponding to its reference concentration, did not exert its cytostatic effects on primary fibroblasts suggesting that its effects are specific for tumor cells.
Figure 5. TAARs are important in mediating the effects of cadaverine. (A) Patient data was accessed at kmplot.
com. Kaplan-Meier plots show the correlation between the mRNA expression of human TAARs and survival in breast cancer. (B) 4T1 cells were treated with, 100 nM cadaverine (48 hours) or 100 nM cadaverine (48 hours) in combination with 5 µM NF449 G protein inhibitor (last 48 hours of cadaverine treatment), cells were stained with Texas Red-X Phalloidin- and DAPI then cells were assessed by confocal microscopy (n = 2 in triplicates).
(C) MDA-MB-231 cells were transfected with control si RNA or TAAR si RNA. The silencing efficacy was measured by Western blot (n = 2). (D,E) MDA-MB-231 cells were treated with vehicle or 0.3 μM cadaverine and transfected with control si RNA or TAAR si RNA. After 48 hours of incubation (D) TexasRed-X Phalloidin immunocytochemistry (p = 0.04 between cadaverine and TAAR1, p = 0.007 between cadaverine and TAAR8, p = 0.003 between cadaverine and TAAR9) (n = 1 in triplicates), and (E) MMP9 immunocytochemistry (p = 0.006 between control and TAAR1; p = 0.001 between cadaverine and TAAR8; p = 0.004 between
cadaverine and TAAR9) (n = 1 in triplicates) were performed. CAD – cadaverine, other abbreviations are in the text.
Cadaverine was shown to activate TAARs, moreover, a study linked TAAR1 to breast cancer37. Our results pointed out the possible involvement of TAAR1, TAAR2, TAAR3, TAAR5, TAAR8 and TAAR9 in bringing about the anticancer effects of cadaverine. High expression of these receptors in tumors associated with better survival.
TAAR1 (1553930_at) HR (Hazard Ratio) P-value (Log Rank Test) All Breast Cancers, N = 1764 0.8 6.1 × 10⁻³
ER(−), N = 516 0.77 0.054
ER(+), N = 1248 0.83 0.052
Basal subtype, N = 360 0.66 0.011
Luminal B, N = 407 0.67 0.01
TAAR2 (221394_at)
All Breast Cancers, N = 3951 0.73 1.90 × 10⁻⁸
ER(−), N = 869 0.65 6.20 × 10⁻⁵
ER(+), N = 2061 1.07 0.4
Basal subtype, N = 618 0.66 1 × 10⁻³
Luminal B, N = 1149 0.66 3.10 × 10⁻⁵
TAAR3 (221393_at)
All Breast Cancers, N = 3951 0.8 6.30 × 10⁻⁵
ER(−), N = 869 0.69 4.5 × 10⁻⁴
ER(+), N = 3082 0.86 0.018
Basal subtype, N = 618 0.76 0.036
Luminal B, N = 1149 0.67 4.20 × 10⁻⁵
TAAR5 (221459_at)
All Breast Cancers, N = 3951 0.76 7.80 × 10⁻⁷
ER(−), N = 869 0.75 8.3 × 10⁻³
ER(+), N = 3082 0.8 6.00 × 10⁻⁴
Basal subtype, N = 618 0.73 0.016
Luminal B, N = 1149 0.62 1.00 × 10−−6
TAAR8 (1553552_at)
All Breast Cancers, N = 1764 0.94 0.42
ER(−), N = 516 0.69 5.8 × 10⁻³
ER(+), N = 1248 1.1 0.31
Basal subtype, N = 360 0.64 7.8 × 10⁻³
Luminal B, N = 407 0.97 0.85
TAAR9 (1553066_at)
All Breast Cancers, N = 1764 0.58 8.10 × 10⁻¹²
ER(−), N = 516 0.55 1.40 × 10⁻⁵
ER(+), N = 1248 0.6 2.30 × 10⁻⁷
Basal subtype, N = 360 0.5 4.80 × 10⁻⁵
Luminal B, N = 407 0.69 0.017
Table 2. Connection between TAARs and Breast Cancer Patient survival.
Abbreviation Gene name Category
MMP2 Matrix Metalloproteinase 2
Extracellular matrix and cell adhesion MMP3 Matrix Metalloproteinase 3
MMP9 Matrix Metalloproteinase 9
Krt14 Keratin 14
CDH1 E-cadherin
Spp1 Secreted Phosphoprotein 1
FgfBp1 Fibroblast Growth Factor Binding Protein 1
Cell growth and proliferation
Notch1 Notch 1
Tgfb3 Transforming Growth Factor Beta 3 Erbb3 Human Epidermal Growth Factor Receptor 3
Esr1 Estrogen Receptor 1
IgfBp4 Insulin Like Growth Factor Binding Protein 4
Table 1. List of EMT genes differentially regulated upon cadaverine treatment.
The lack of commercially available reagents limited us in validating these findings, we were able to test TAAR1, TAAR8 and TAAR9. All receptors were involved in regulating the mesenchymal-to-epithelial transition, however, only TAAR8 and TAAR9 modulated MMP9 expression (Fig. 7). Furthermore, the expression of TAAR8 was reduced in precancerous states and was gradually downregulated as the severity of the disease worsened; we have not found such correlations with TAAR1 or TAAR9. Available metadata suggest that TAAR8 has strong inverse correlation with breast cancer severity. Due to the limited availability of reagents, we cannot exclude that other TAARs could be equally involved in regulating cadaverine-evoked effects besides the ones we identified.
Our data suggest that bacterial cadaverine biosynthesis decreases in the gut in early stage breast cancer, result- ing in lower production of an anti-cancer bacterial metabolite. In that sense, lower cadaverine production is in line with the lower production of another cytostatic microbial metabolite, lithocholic acid26. On a broader scale, these observations suggest that the simplification of the gut microbiome in early stage breast cancer16,26 leads to a decreased production of antiproliferative bacterial metabolites like cadaverine or lithocholic acid26. This observation is further supported by the observation that there is a positive correlation between breast cancer incidences or recurrence and cumulative antibiotic use53–58. Antibiotic exposure increased breast cancer risk in a dose-dependent fashion, nevertheless, these are correlative studies, and the chance of uncontrolled confounding is high and certain studies have found no association53,54,56–58. Apparently, the cumulative antibiotic dose is in correlation with increases in breast cancer frequency regardless of antibiotic class, although, the strongest effects were associated with the intermitting use of tetracyclins and macrolids55.
Figure 6. Cadaverine biosynthesis is suppressed in early stages of breast cancer. (A) Human fecal DNA samples were collected from 48 patients with different stages of breast cancer, and from 48 healthy patients. The abundance of DNA coding for CadA and LdcC of the indicated bacterial species were determined in the fecal DNA samples by RT-qPCR. Median values are indicated by a line. (B) Human fecal samples were collected from stage 1 breast cancer patients (n = 7) and from healthy (control) subjects (n = 3). The E. coli LdcC protein level was determined using Western blot. Hereby we show a representative image. Band intensity was normalized to total protein content assessed by ponceau-S staining of whole blots. Box chart of LDC protein expression from fecal samples (p = 0.003). Data was normalized to the mean of control samples. Blots were routinely cut as the representative blot. (C,D) Patient data was accessed at kmplot.com. Kaplan-Meier plots the correlation between the mRNA expression of human LDC and survival in breast cancer. Graphs show the correlation between LDC and disease survival in different forms and stages of the disease. Those arrays were also included where ER status was deducted from gene expression data. **Indicate statistically significant difference between control and treated groups at p < 0.01. Significance was calculated using two-sample student t-test (two-tailed). All abbreviations are in the text. Values on (A) were log2 transformed.
The most drastic changes to the microbiome was associated with in situ carcinoma or stage I carcinoma, in later stages cadaverine production re-increased and reached levels similar to the level of the controls. These findings are similar to our previous observations, in breast cancer the abundance of the cadaverine-producing bacteria was the lowest in in situ carcinoma and stage I carcinoma patients26. Nevertheless, the in silico data that we gathered for TAAR8 suggest that in parallel to the simplification or dysbiosys of the microbiome in tumors the expression of the cadaverine-sensing apparatus is probably downregulated.
There are other sources of cadaverine. Milk ducts in the breast are colonized by bacteria and the duct microbi- ome changes upon breast cancer19–22 that may contribute to changes in the breast pool of cadaverine. In addition Figure 7. Scheme of the mechanism of cadaverine treatment.
Lysine decarboxylase (201744_s_at) HR (Hazard
Ratio) P-value (Log Rank Test)
All Breast Cancers, N = 3951 1.07 0.23
ER(+), PR(+), N = 577 0.69 0.045
ER(+), PR(+), Lymph node(+), N = 344 0.52 3.4 × 10⁻³ ER(+), PR(+), Lymph node(−), N = 228 0.76 0.39
ER(−), PR(−), N = 298 0.94 0.74
ER(−), PR(−), Lymph node(+), N = 127 0.76 0.32 ER(−), PR(−), Lymph node(−), N = 167 0.89 0.69
ER(−), PR(−), HER2(−), N = 198 1.01 0.98
ER(+), Luminal A, N = 1933 1.15 0.1
ER(+), Luminal A, Grade 1, N = 267 0.45 0.014
ER(+), Luminal B, N = 1149 1.11 0.27
ER(+), Luminal B, Grade 1, N = 56 1.73 0.39
Grade 1, N = 345 0.6 0.055
Grade 2, N = 901 0.83 0.13
Grade 3, N = 903 1.06 0.59
Basal subtype, N = 618 1.18 0.19
Luminal A, N = 1933 1.15 0.1
Luminal B, N = 1149 1.11 0.27
ER(+), HER2(+), N = 156 0.96 0.9
ER(−), HER2(+), N = 96 1.57 0.16
Table 3. Breast cancer survival and Lysine decarboxylase.
to these, human cells also synthesize cadaverine. High expression of human LDC prolongs survival in early stage breast cancer patients, further supporting the potential anti-cancer properties of cadaverine. Nevertheless, the share of these sources (healthy breast tissues vs. tumor vs. host vs. gut) in cadaverine production is not explored.
This study puts cadaverine on the list of bacterial metabolites that govern carcinogenesis. Lithocholic acid26 and cadaverine can suppress cancer hallmarks of breast cancer cells. In hepatocellular carcinoma, lipopolysaccha- ride29 and deoxycholic acid (DCA)23 have been identified as promoters, while propionate is an inhibitor30. These observations support the hypothesis that bacterial metabolites influence carcinogenesis in organs remote from the gut. Nevertheless, this field requires considerably more research to understand the interactions between the microbiome and distantly located tumors.
Methods
All methods were performed according to the relevant guidelines.
Chemicals.
Chemicals, among them, cadaverine were from Sigma-Aldrich (St. Louis, MI, USA) unless oth- erwise stated.Cell culture.
4T1 murine breast cancer cells, ZR-75-1 human breast cancer cells were maintained in RPMI- 1640 (Sigma-Aldrich, R5886) medium containing 10% FBS, 1% penicillin/streptomycin, 2 mM L-glutamine and 1% pyruvate at 37 °C with 5% CO2.MDA-MB-231 and SK-BR-3 human breast cancer cells were maintained in DMEM (Sigma-Aldrich, 1000 mg/l glucose, D5546) containing 10% FBS, 1% penicillin/streptomycin, 2 mM L-glutamine and 10 mM HEPES at 37 °C with 5% CO2.
MCF7 human breast cancer cells were maintained in MEM (Sigma-Aldrich, M8042) medium containing 10%
FBS, 1% penicillin/streptomycin, 2 mM L-glutamine and 10 mM HEPES at 37 °C with 5% CO2.
Human primary fibroblast cells were maintained in DMEM (Sigma-Aldrich, 1000 mg/l glucose, D5546) con- taining 20% FBS, 1% penicillin/streptomycin, 2 mM L-glutamine and 10 mM HEPES at 37 °C with 5% CO2.
transfections.
Transfections were performed as in59.Cell proliferation assays.
Sulphorhodamine B assay and colony forming assays were performed as in26,60.Detection of cell death.
For the detection of cell death we used simple propidium iodide (PI, Biotium, Fremont, CA, 40016) uptake assays (as in61), while to differentiate between apoptosis and necrosis we used an Annexin V + PI double staining assay kit (Invitrogen, Oregon, USA, V13242).Electric Cell-substrate Impedance Sensing (ECIS). ECIS assays were performed similarly to26. ECIS measurements are used to assess cell-to-cell and cell-to-surface connections.
Immunocytochemistry.
Immunocytochemistry was performed similarly to26,62.Bacterial LdcC and CadA quantitation. The human fecal DNA library from breast cancer patients was published in16. For the determination of the abundance of Lysine decarboxylase coding DNA in human fecal DNA samples 10 ng of DNA was used for qPCR reactions. Primers are listed in Supplementary Table 1. The ampli- cons were subsequently sequenced using the same primers as listed in Supplementary Table 1.
mRNA isolation and quantitation. Reverse transcription-coupled PCR (RT-qPCR) was performed sim- ilarly to63.
Fecal protein sample preparation.
RIPA buffer (50 mM Tris, 150 mM NaCl, 0.1% SDS, 1% Triton X-100, 0.5% sodium deoxycholate, 1 mM EDTA, 1 mM Na3VO4, 1 mM NaF, 1 mM PMSF, protease inhibitor cocktail) was used to lyse cells of fecal samples. Samples were sonicated (Qsonica Q125 Sonicator, Newtown, Connecticut) 3 times for 30 seconds with 50% amplitude. After centrifugation, 25 µl 5 X SDS sample buffer (50% glycerol, 10%SDS, 310 mM Tris HCl, pH 6.8, 100 mM DTT, and 0.01% bromophenol blue) and 8 µl β-mercaptoethanol were added to every 100 µl supernatant. Samples were heated 10 minutes at 96 °C and kept on ice until loading.
sDs-pAGe and Western blotting.
SDS PAGE and Western blotting was performed as in63.scratch assay.
Scratch assays were performed as in26. Scratch assays were employed to assess cell movement.Invasion.
Matrigel invasion assay was carried out on 4T1 cells using Corning BioCoat Matrigel Invasion Chamber (354480). 4T1 cells were seeded in the chambers (50000 cells/well) in serum free medium, and were grown overnight. Cells were then treated with different concentration of cadaverine (0.1 µM, 0.3 µM, 0.8 µM).The lower chamber contained full 4T1 medium with 100 ng/ml SDF1-alpha (Sigma, SRP4388) as chemoattract- ant. After 48 hours of cadaverine treatment cells were prepared according to the manufacturer’s instructions and stained with Hematoxylin-Eosin (VWR, 340374T and 341972Q) dye. Cells were then pictured with Opera Phoenix High Content Screening System and pictures were analyzed using Harmony 4.6 Software. Invasion index was calculated from the percentage of invading cells through Matrigel membrane and control membrane.
= ∗ Invasion Mean of cells invading through Matrigel insert membrane
Mean of cells invading through Control insert membrane
% 100
Invasion index= Invasion Test Cell Invasion Control Cell
%
%
Seahorse metabolic flux analysis. Changes to oxygen consumption rate (OCR, a readout of mitochon- drial oxidation) and in pH (ECAR, a readout of lactate production and glycolytic flux) after cadaverine treatment were performed similarly to26.
Determination of lipid peroxidation (TBARS). TBARS assay was performed to assess lipid peroxidation as in64.
Aldefluor assay. Aldefluor assay for assessing stem-ness was performed similarly to65.
Animal study.
Animal studies were conducted similarly to26.Animal experiments were approved by the Institutional Animal Care and Use Committee at the University of Debrecen and the National Board for Animal Experimentation (1/2015/DEMÁB) and were carried out according to the NIH guidelines (Guide for the care and use of laboratory animals) and applicable national laws. Animal studies are reported in compliance with the ARRIVE guidelines66,67.
We used BALB/c female mice (4 months of age, 20–25 g). Animals were bred in the “specific pathogen free”
zone of the Animal Facility at the University of Debrecen, and kept in the “minimal disease” zone during the experiments. 4 mice were housed in one cage (standard block shape 365 × 207 × 140 mm, surface 530 cm2; 1284 L Eurostandard Type II. L from Techniplast). Dark/light cycle was 12 h, and temperature was 22 ± 1 °C. Mice had ad libitum access to food and water (sterilized tap water). A total of 32 female mice were used in the study, 16 randomly selected control and 16 cadaverine fed mice. The study was performed in two runs at two different occasions, each run comprising of 8 vehicle-treated and 8 cadaverine-treated mice.
Tumor was formed in mice by the grafting of 4T1 cells. 4T1 cells were suspended (2 × 10⁶/mL) in ice cold PBS-Matrigel (1:1, Sigma-Aldrich). 16 female BALB/c mice received 50 µL injections to the inguinal fat pads below the lower abdominal nipples on both sides (105 cells/injection site).
Animals received daily oral cadaverine treatment. Cadaverine stock was prepared in sterilized tap water at 100x concentration (15 mM) and the stock was stored at −20 °C. Cadaverine stock was diluted each day to a working concentration of 150 µM in sterile tap water before the treatment. Animals received a daily oral dose of 100 µl/30 g bodyweight from cadaverine solution (8 mice) or vehicle (sterilized tap water, 8 mice). Researchers administering cadaverine and vehicle solutions were blinded. Treatment was carried out every day during the morning hours between 9 am and 11 am. Mice were sacrificed on day 14 post grafting.
During autopsy primary tumors were scored based on their infiltration rate into surrounding tissues based on macroscopic appearance of the tumor. “Low infiltration” class means that primer tumor remained in the mam- mary fat pads without any attachment to muscle tissues. In case the tumor mass attached to the muscle tissue but did not penetrate to the abdominal wall, it classified as a “medium infiltration” tumor. If the tumor grew into the muscle tissue and totally penetrated the abdominal wall, it was scored as a “high infiltration” tumor.
Both primary and metastatic tumor masses were removed from mice and were measured on analytical balance in preweighed Eppendorf tubes.
Human studies.
We assessed the abundance of the bacterial DNA coding for lysine decarboxylase in human fecal DNA samples. The human fecal samples were collected from healthy women and breast cancer patients by collaborators at the National Cancer Institute (NCI), Kaiser Permanente Colorado (KPCO), and the Institute for Genome Sciences at the University of Maryland School of Medicine, and RTI International. The study protocol and all study materials were approved by the Institutional Review Boards at KPCO, NCI, and RTI International (IRB number 11CN235). The primary study results were published in18. All methods were performed in accord- ance with the relevant guidelines and regulations.We obtained informed consent from study participants.
Another cohort was used to assess LdcC protein in the feces of healthy volunteers and breast cancer patients.
The collection and biobanking of feces was authorized by the Hungarian national authority (ETT). Patients and healthy volunteers meeting the following criteria were excluded from the study according to the corresponding national guideline for fecal transplantation68: (1) has previous history of breast cancer or had been operated due to neoplasia, (2) has a disease of unknown origin, (3) has chronic contagious disease, (4) had contagious diarrhea 6 months prior to enrollment, (5) taken antibiotics in the 6 months prior to enrollment, (6) had chemotherapy, biological therapy or immunosuppressive therapy 6 months prior to enrollment, (7) used intravenous drugs 12 months prior to enrollment, (8) had piercing, tattooing, acupuncture or other endangering behavior or action 12 months prior to enrollment, (9) exposition to an allergen to which the enrolled individual had been sensitized to, (10) underwent colonoscopy 12 months prior to enrollment. First morning feces was sampled; samples were fro- zen and deposited in the biobank two hours after defecation. Samples were stored at −70 °C until subsequent use.
Database screening.
The kmplot.com database69 was used to study the link between gene expression levels and breast cancer survival in humans. The association of known mutations with breast cancer was retrieved from www.intogen.org/. The sequence of the CadA and LdcC ORFs were retrieved from the KEGG (www.genome.jp/kegg/)
database. We assessed the NCBI GEO Profiles with the term “LDC and breast cancer” and the GENT database with the keywords “TAAR1”, “TAAR8” and “TAAR9”.
statistical analysis.
We used two tailed Student’s t-test for the comparison of two groups unless stated otherwise. Fold data for human fecal DNA assessment were log2 transformed to achieve normal distribution.For multiple comparisons one-way analysis of variance test (ANOVA) was used followed by Tukey’s honestly significance (HSD) post-hoc test. Data is presented as average ± SEM unless stated otherwise. Texas Red-X Phalloidin-labelled fluorescent pictures were analyzed using Image J or Cell Profiler 2.0 followed by Advanced Cell Classifier 3.0. FACS results were analyzed using Flowing Software 2.0. Statistical analysis was done using Origin 8.6 software unless stated otherwise.
Data Availability
All primary data is accessible at https://figshare.com/s/b694cc9ab2f1d31ae9c7 or https://doi.org/10.6084/m9.
figshare.5657326.
References
1. Macfabe, D. Autism: metabolism, mitochondria, and the microbiome. Glob Adv Health Med 2, 52–66 (2013).
2. Maruvada, P., Leone, V., Kaplan, L. M. & Chang, E. B. The Human Microbiome and Obesity: Moving beyond Associations. Cell Host Microbe. 22, 589–599 (2017).
3. Fulbright, L. E., Ellermann, M. & Arthur, J. C. The microbiome and the hallmarks of cancer. PLoS Pathog. 13, e1006480 (2017).
4. Kundu, P., Blacher, E., Elinav, E. & Pettersson, S. Our Gut Microbiome: The Evolving Inner Self. Cell. 171, 1481–1493, https://doi.
org/10.1016/j.cell.2017.1411.1024. (2017).
5. Zitvogel, L., Ayyoub, M., Routy, B. & Kroemer, G. Microbiome and Anticancer Immunosurveillance. Cell. 165, 276–287, https://doi.
org/10.1016/j.cell.2016.1003.1001. (2016).
6. Schwabe, R. F. & Jobin, C. The microbiome and cancer. Nat Rev Cancer 13, 800–812 (2013).
7. Plottel, C. S. & Blaser, M. J. Microbiome and malignancy. Cell Host Microbe 10, 324–335 (2011).
8. Garrett, W. S. Cancer and the microbiota. Science. 348, 80–86 (2015).
9. Yu, H. et al. Urinary microbiota in patients with prostate cancer and benign prostatic hyperplasia. Archives of medical science: AMS 11, 385–394 (2015).
10. Chase, D., Goulder, A., Zenhausern, F., Monk, B. & Herbst-Kralovetz, M. The vaginal and gastrointestinal microbiomes in gynecologic cancers: a review of applications in etiology, symptoms and treatment. Gynecol Oncol 138, 190–200 (2015).
11. Yu, Y., Champer, J., Beynet, D., Kim, J. & Friedman, A. J. The role of the cutaneous microbiome in skin cancer: lessons learned from the gut. Journal of drugs in dermatology: JDD 14, 461–465 (2015).
12. Gui, Q. F., Lu, H. F., Zhang, C. X., Xu, Z. R. & Yang, Y. H. Well-balanced commensal microbiota contributes to anti-cancer response in a lung cancer mouse model. Genetics and molecular research: GMR 14, 5642–5651 (2015).
13. Yamamoto, M. L. & Schiestl, R. H. Lymphoma caused by intestinal microbiota. International journal of environmental research and public health 11, 9038–9049 (2014).
14. Yamamoto, M. L. & Schiestl, R. H. Intestinal microbiome and lymphoma development. Cancer J. 20, 190–194 (2014).
15. Goedert, J. J. et al. Postmenopausal breast cancer and oestrogen associations with the IgA-coated and IgA-noncoated faecal microbiota. Br J Cancer 23, 435 (2018).
16. Goedert, J. J. et al. Investigation of the association between the fecal microbiota and breast cancer in postmenopausal women: a population-based case-control pilot study. J Natl Cancer Inst. 107, djv147 (2015).
17. Fuhrman, B. J. et al. Associations of the fecal microbiome with urinary estrogens and estrogen metabolites in postmenopausal women. J Clin Endocrinol Metab. 99, 4632–4640 (2014).
18. Flores, R. et al. Fecal microbial determinants of fecal and systemic estrogens and estrogen metabolites: a cross-sectional study. J Transl Med. 10, 253 (2012).
19. Xuan, C. et al. Microbial dysbiosis is associated with human breast cancer. PLoS One. 9, e83744 (2014).
20. Hieken, T. J. et al. The Microbiome of Aseptically Collected Human Breast Tissue in Benign and Malignant Disease. Sci Rep. 6, 30751 (2016).
21. Chan, A. A. et al. Characterization of the microbiome of nipple aspirate fluid of breast cancer survivors. Sci Rep. 6, 28061 (2016).
22. Urbaniak, C. et al. The Microbiota of Breast Tissue and Its Association with Breast Cancer. Appl Environ Microbiol. 82, 5039–5048 (2016).
23. Yoshimoto, S. et al. Obesity-induced gut microbial metabolite promotes liver cancer through senescence secretome. Nature. 499, 97–101 (2013).
24. Xie, G. et al. Dysregulated hepatic bile acids collaboratively promote liver carcinogenesis. Int J Cancer. 139, 1764–1775 (2016).
25. Luu, T. H. et al. Lithocholic bile acid inhibits lipogenesis and induces apoptosis in breast cancer cells. Cell Oncol (Dordr). 41, 13–24 (2018).
26. Miko, E. et al. Lithocholic acid, a bacterial metabolite reduces breast cancer cell proliferation and aggressiveness. Biochim Biophys Acta 1859, 958–974 (2018).
27. Rowland, I. R. Role of the gut flora in toxicity and cancer (Academic Press, Carshalton, UK, 1988).
28. Shellman, Z. et al. Bile acids: a potential role in the pathogenesis of pharyngeal malignancy. Clin Otolaryngol. 42, 969–973 (2017).
29. Dapito, D. H. et al. Promotion of hepatocellular carcinoma by the intestinal microbiota and TLR4. Cancer Cell 21, 504–516 (2012).
30. Bindels, L. B. et al. Gut microbiota-derived propionate reduces cancer cell proliferation in the liver. Br J Cancer 107, 1337–1344 (2012).
31. Miller-Fleming, L., Olin-Sandoval, V., Campbell, K. & Ralser, M. Remaining Mysteries of Molecular Biology: The Role of Polyamines in the Cell. J Mol Biol. 427, 3389–3406 (2015).
32. Seiler, N. Catabolism of polyamines. Amino Acids. 26, 217–233 (2004).
33. Loser, C., Folsch, U. R., Paprotny, C. & Creutzfeldt, W. Polyamine concentrations in pancreatic tissue, serum, and urine of patients with pancreatic cancer. Pancreas. 5, 119–127 (1990).
34. Loser, C., Folsch, U. R., Paprotny, C. & Creutzfeldt, W. Polyamines in colorectal cancer. Evaluation of polyamine concentrations in the colon tissue, serum, and urine of 50 patients with colorectal cancer. Cancer. 65, 958–966 (1990).
35. Pavlides, S. et al. The reverse Warburg effect: aerobic glycolysis in cancer associated fibroblasts and the tumor stroma. Cell Cycle 8, 3984–4001 (2009).
36. Liberles, S. D. Trace amine-associated receptors: ligands, neural circuits, and behaviors. Curr Opin Neurobiol. 34, 1–7 (2015).
37. Vattai, A. et al. Increased trace amine-associated receptor 1 (TAAR1) expression is associated with a positive survival rate in patients with breast cancer. J Cancer Res Clin Oncol 13, 017–2420 (2017).
38. NCBI_GEO_Profiles. TAAR8 expression in hyperplastic enlarged lubular units (HELUs) versus normal terminal ductal lobular units (TDLUs). (https://www.ncbi.nlm.nih.gov/geoprofiles/39407988, 2018).
39. Gent_Database. TAAR8 expression in cancers (search term: TAAR8). (http://medicalgenome.kribb.re.kr/GENT/ 2018).
40. NCBI_GEO_Profiles. TAAR8 expression in DCIS vs. healthy breast tissue. (https://www.ncbi.nlm.nih.gov/geo/tools/profileGraph.
cgi?ID=GDS3853:1553552_at, 2018).
41. NCBI_GEO_Profiles. TAAR8 - Invasive ductal and lobular breast carcinomas. (https://www.ncbi.nlm.nih.gov/geoprofiles/36691448, 2018).
42. NCBI_GEO_Profiles. LDC expression in control, DCIS, ICS. Vol. 2018 (https://www.ncbi.nlm.nih.gov/geo/tools/profileGraph.
cgi?ID=GDS3853:201744_s_at, 2018).
43. NCBI_GEO_Profiles. LDC expression in epithelium and stroma of normal breast and invasive breast cancer. Vol. 2018 (https://www.
ncbi.nlm.nih.gov/geo/tools/profileGraph.cgi?ID=GDS3324:201744_s_at, 2018).
44. NCBI_GEO_Profiles. LDC expression in ER− and ER+ breast cancer patients, prophylactic mastectomy patients, and normal breast epithelia from reduction mammoplasty patients., Vol. 2018 (https://www.ncbi.nlm.nih.gov/geo/tools/profileGraph.
cgi?ID=GDS3716:201744_s_at, 2018).
45. NCBI_GEO_Profiles. Normal epithelium vs. breast cancer epithelium in patients. (https://www.ncbi.nlm.nih.gov/geo/tools/
profileGraph.cgi?ID=GDS3139:201744_s_at, 2018).
46. NCBI_GEO_Profiles. LDC expression in control vs. non-basal vs. basal-like breast cancer. Vol. 2018 (https://www.ncbi.nlm.nih.gov/
geo/tools/profileGraph.cgi?ID=GDS2250:201744_s_at, 2018).
47. Mashige, F. et al. Clinical usefulness of an enzymatic determination of total urinary polyamines, excluding cadaverine. Clin Chem.
34, 2271–2274 (1988).
48. Elitsur, Y., Moshier, J. A., Murthy, R., Barbish, A. & Luk, G. D. Polyamine levels, ornithine decarboxylase (ODC) activity, and ODC- mRNA expression in normal and cancerous human colonocytes. Life Sci 50, 1417–1424 (1992).
49. Khuhawar, M. Y. & Qureshi, G. A. Polyamines as cancer markers: applicable separation methods. J Chromatogr B Biomed Sci Appl.
764, 385–407 (2001).
50. Liu, R. et al. Determination of polyamine metabolome in plasma and urine by ultrahigh performance liquid chromatography- tandem mass spectrometry method: application to identify potential markers for human hepatic cancer. Anal Chim Acta. 791, 36–45 (2013).
51. Olaya, J., Neopikhanov, V. & Uribe, A. Lipopolysaccharide of Escherichia coli, polyamines, and acetic acid stimulate cell proliferation in intestinal epithelial cells. In Vitro Cell Dev Biol Anim. 35, 43–48 (1999).
52. Aizencang, G. et al. Antiproliferative effects of N1,N4-dibenzylputrescine in human and rodent tumor cells. Cell Mol Biol (Noisy-le- grand). 44, 615–625 (1998).
53. Velicer, C. M. et al. Antibiotic use in relation to the risk of breast cancer. JAMA. 291, 827–835 (2004).
54. Velicer, C. M., Heckbert, S. R., Rutter, C., Lampe, J. W. & Malone, K. Association between antibiotic use prior to breast cancer diagnosis and breast tumour characteristics (United States). Cancer Causes Control. 17, 307–313 (2006).
55. Friedman, G. D. et al. Antibiotics and risk of breast cancer: up to 9 years of follow-up of 2.1 million women. Cancer Epidemiol Biomarkers Prev. 15, 2102–2106 (2006).
56. Wirtz, H. S. et al. Frequent antibiotic use and second breast cancer events. Cancer Epidemiol Biomarkers Prev. 22, 1588–1599 (2013).
57. Tamim, H. M., Hanley, J. A., Hajeer, A. H., Boivin, J. F. & Collet, J. P. Risk of breast cancer in relation to antibiotic use.
Pharmacoepidemiol Drug Saf. 17, 144–150 (2008).
58. Satram-Hoang, S. et al. A pilot study of male breast cancer in the Veterans Affairs healthcare system. J Environ Pathol Toxicol Oncol 29, 235–244 (2010).
59. Marton, J. et al. Poly(ADP-ribose) polymerase-2 is a lipid-modulated modulator of muscular lipid homeostasis. Biochim Biophys Acta 2, 30187–30182 (2018).
60. Fodor, T. et al. Combined Treatment of MCF-7 Cells with AICAR and Methotrexate, Arrests Cell Cycle and Reverses Warburg Metabolism through AMP-Activated Protein Kinase (AMPK) and FOXO1. PLoS One. 11, e0150232 (2016).
61. Robaszkiewicz, A. et al. Hydrogen peroxide-induced poly(ADP-ribosyl)ation regulates osteogenic differentiation-associated cell death. Free Radic Biol Med. 53, 1552–1564 (2012).
62. Nagy, L. et al. Glycogen phosphorylase inhibition improves beta cell function. Br J Pharmacol. 175, 301–319 (2018).
63. Szántó, M. et al. Deletion of PARP-2 induces hepatic cholesterol accumulation and decrease in HDL levels. Biochem Biophys Acta - Molecular Basis of Disease 1842, 594–602 (2014).
64. Mabley, J. G. et al. Suppression of intestinal polyposis in Apcmin/+ mice by targeting the nitric oxide or poly(ADP-ribose) pathways.
Mutat.Res. 548, 107–116 (2004).
65. Fiorillo, M. et al. Bergamot natural products eradicate cancer stem cells (CSCs) by targeting mevalonate, Rho-GDI-signalling and mitochondrial metabolism. Biochim Biophys Acta 4, 30061–30066 (2018).
66. Kilkenny, C., Browne, W., Cuthill, I. C., Emerson, M. & Altman, D. G. NC3Rs Reporting Guidelines Working Group. Animal research: reporting in vivo experiments: the ARRIVE guidelines. Br J Pharmacol. 160(7), 1577–1579 (2010).
67. McGrath, J. C., Drummond, G. B., McLachlan, E. M., Kilkenny, C. & Wainwright, C. L. Guidelines for reporting experiments involving animals: th e ARRIVE guidelines. Br J Pharmacol. 160(7), 1573–1576 (2010).
68. Nagy, G. G., Varvolgyi, C., Balogh, Z., Orosi, P. & Paragh, G. Detailed methodological recommendations for the treatment of Clostridium difficile-associated diarrhea with faecal transplantation. Orv Hetil. 154, 10–19 (2013).
69. Lanczky, A. et al. miRpower: a web-tool to validate survival-associated miRNAs utilizing expression data from 2178 breast cancer patients. Breast Cancer Res Treat. 160, 439–446 (2016).
Acknowledgements
We are grateful for Mr. László Finta for the technical assistance and to Dr. Beáta Lontay (Dept. Medical Chemistry, UD) for enabling us the use of the JuLi Br real-time videomicroscope. The authors are also thankful to Dr. Jacques Ravel (University of Maryland Medical School) for transferring the human fecal DNA samples, to Árpád Bálint and Csaba Molnár (Biology Research Center of Szeged) for their help in Cell Profiler and Advancer Cell Classifier software. Our work was supported by grants from NKFIH (K123975, FK128387, PD116262, PD124110, GINOP- 2.3.2-15-2016-00006, GINOP-2.3.3-15-2016-00021), the Momentum fellowship and the Taiwanese-Hungarian Bilateral Program (Projekt2017-44) of the Hungarian Academy of Sciences and the University of Debrecen and a Bolyai fellowship to AB. This work was supported by the Intramural Research Program of the National Cancer Institute at the National Institutes of Health (Z01CP010214).
Author Contributions
Planned, performed and executed cellular experiments: T.K., E.M., G.U., P.K., A.B.; Histological examination:
T.C., G.M.; Animal study: T.K., A.V., P.K., G.L.; provided human fecal DNA collection: J.J.G.; Patient selection and sample collection: É.S., J.T., D.T., P.Á.; Fecal DNA and protein analysis: T.K.; Statistical analysis: T.K., E.M., A.V.;
Wrote the manuscript: P.B., T.K., E.M., A.V., B.K., É.S., J.T., T.C., G.M., J.J.G.
Additional Information
Supplementary information accompanies this paper at https://doi.org/10.1038/s41598-018-37664-7.
Competing Interests: The authors declare no competing interests.
Publisher’s note: Springer Nature remains neutral with regard to jurisdictional claims in published maps and institutional affiliations.
Open Access This article is licensed under a Creative Commons Attribution 4.0 International License, which permits use, sharing, adaptation, distribution and reproduction in any medium or format, as long as you give appropriate credit to the original author(s) and the source, provide a link to the Cre- ative Commons license, and indicate if changes were made. The images or other third party material in this article are included in the article’s Creative Commons license, unless indicated otherwise in a credit line to the material. If material is not included in the article’s Creative Commons license and your intended use is not per- mitted by statutory regulation or exceeds the permitted use, you will need to obtain permission directly from the copyright holder. To view a copy of this license, visit http://creativecommons.org/licenses/by/4.0/.
© The Author(s) 2019