0231–424X/$ 20.00 © 2015 Akadémiai Kiadó, Budapest DOI: 10.1556/036.102.2015.2.12
Altered mitochondrial response to activation of T-cells in neonate
G Mészáros1,4, Cs Orbán1, A Kaposi1, G Toldi1,3,4, B Gyarmati2, T Tulassay1,3, B Vásárhelyi1,4
1MTA-SE, Pediatrics and Nephrology Research Group, Hungarian Academy of Sciences, Semmelweis University, Budapest, Hungary
2Department of Obstetrics and Gynaecology, Uzsoki Street Hospital, Budapest, Hungary
3First Department of Paediatrics, Semmelweis University, Budapest, Hungary
4Department of Laboratory Medicine, Semmelweis University, Budapest, Hungary Received: September 19, 2014
Accepted after revision: March 12, 2015
Mitochondrial functions have a major impact on T-cell functionality. In this study we characterized whether mitochondrial function in the neonatal T-cells differs from that in the adult T-cells during short T-cell activation.
Methods: We used flow cytometry methods to test mitochondrial mass and to monitor mitochondrial Ca2+
levels, mitochondrial potential and superoxide generation in parallel with cytoplasmic Ca2+ levels during phythohaemagglutinine-induced activation of CD4+ and CD8+ T-cells of 12 term neonates and 11 healthy adults.
Results: Baseline mitochondrial mass of CD4+ and CD8+ cells was lower in the neonate than in the adult. In comparison with the adult, neonatal resting CD4+ T-cells had lower cytoplasmic Ca2+ levels and this was associated with normal activation induced Ca2+-response. During short-term activation cytoplasmic Ca2+-response was lower in neonatal than in adult CD8+ T-cells. Mitochondrial Ca2+ uptake was increased in CD4+ neonatal T cells while it decreased in CD8+ T-cells. Mitochondrial depolarization was increased in CD4+ and decreased in CD8+ neonatal T-cells compared to adults. Superoxide generation was higher and equal in neonatal CD4+ and CD8+ cells, respectively, compared to the adult ones. Conclusion: Our data suggest that neonatal T-cells exhibit marked differences in mitochondrial function and superoxide generation compared to adult T-cells.
Keywords: calcium, flow cytometry, mitochondrial membrane potential, neonate, superoxide, T-cell
Clinical experience and experimental data support that neonatal T-cells are immunologically less competent than those in the adult (1). Upon activation the production of inflammatory cytokines in CD3+ T-cells is lower in the neonate than in the adult (7, 13). The major factors explaining the reduced response of neonatal T-cells is probably the absence of pre-existing immunological memory (2) and increased number of CD71+ erythroid cells (5). However, we have also observed that the intracellular Ca2+-response of the neonatal T-cells to activation also presents specific characteristics (23).
Proper T-cell activation is a result of coordinated work of intracellular signaling machinery (6). As a result of T-cell receptor (TCR) stimulation, cytoplasmic Ca2+ level ([Ca2+]c) is transiently increased and it activates Ca2+-dependent signaling pathways (8). We have found that Ca2+-response during short-term activation of T-cells is lower in the neonate than in the adult. The immaturity of potassium channels on neonatal cell membrane may be an explanation for this finding (23).
Corresponding author: Prof. Barna Vásárhelyi
Department of Laboratory Medicine, Semmelweis University Nagyvárad tér 4, H-1083 Budapest, Hungary
Phone: +361-2100-278/56131/56487; Fax: +361-2100-278/56492; E-mail: vasarhelyi.barna@med.semmelweis-univ.hu
Now we focused on mitochondrion, another central player of T-cell activation. Changes in [Ca2+]c are associated with alterations in mitochondrial Ca2+ levels ([Ca2+]m) (4).
Mitochondria have an important role in T-cell activation as they modulate the Ca2+-signaling during TCR induced activation. Additionally mitochondrial Ca2+-signal regulates energy metabolism and has also a major impact on other specific T-cell functions (19).
Appropriate generation of reactive oxygen species (ROS) is a fundamental element of T-cell activation (10, 22). ROS modulates signaling pathways and transcription of several genes (25). TCR-signaling induces mitochondrial O2– generation in a Ca2+ dependent manner (3). Phagocyte-type NADPH-oxidase and mitochondria are the major sources of ROS generation during the first 15 minutes of T-cell activation (10).
In this study we compared mitochondrial mass and function including mitochondrial Ca2+ kinetics and mitochondrial membrane potential and ROS generation in CD4+ and CD8+
T cells of the neonate with those of the adult.
Materials and Methods Patients
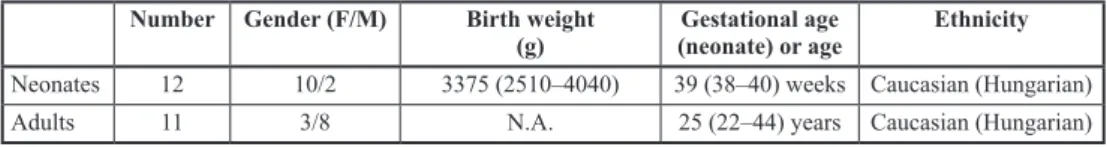
We used cord blood samples of twelve healthy term neonates [10 girls and 2 boys, gestational age: 39 (38–40) weeks, median (range), birth weight: 3375 (2510–4040) grams, median (range)] and peripheral blood samples of 11 healthy adults [3 women and 8 men, age: 25 (22–44) years, median (range)] (Table I).
Table I. Clinical data and patient characteristics. Data are expressed as median (range) Number Gender (F/M) Birth weight
(g) Gestational age
(neonate) or age Ethnicity Neonates 12 10/2 3375 (2510–4040) 39 (38–40) weeks Caucasian (Hungarian)
Adults 11 3/8 N.A. 25 (22–44) years Caucasian (Hungarian)
Ethical statement
The study adhered to the tenets of Declaration of Helsinki. Written informed consent was obtained from the adults and the mothers of the neonates. An independent institutional ethical committee, Semmelweis University Regional and Institutional Committee of Science and Research Ethics, approved this study.
Solutions and reagents
Ficoll Paque; Amersham Biosciences AB, Uppsala, Sweden; phosphate buffered saline (PBS) (2 mM KH2PO4, 9.5 mM Na2HPO4.2H2O, 136.7 mM NaCl); anti-human mAbs: anti-CD4 PE-Cy7 (cat. no. 557852), anti-CD8 APC-Cy7 (cat. no. 557834) (both from PharMingen, San Diego, CA, USA); Fluo-3-AM, Rhod2/AM, tetramethylrhodamine methylester (TMRM), MitoTracker Green and Dihydroethidium (DHE) dyes as well as Pluronic F-127 were purchased from Molecular Probes (Karlsbad, CA) and they were freshly dissolved in dimethyl sulfoxide (DMSO) or ethanol according to the manufacturer’s protocol before the measurements. Phytohemagglutinin (PHA), ionomycin, carbonylcyanide-4- (trifluoromethoxy)-phenylhydrazone (FCCP), RPMI-1640 medium were purchased from Sigma–Aldrich (St. Louis, MO, USA).
Acta Physiologica Hungarica 102, 2015
Cell isolation
Peripheral blood mononuclear cells (PBMC) and cord blood mononuclear cells (CBMC) were separated by a standard density gradient centrifugation with Ficoll Paque (27 min, 400 g, 22 oC) from freshly drawn blood collected in lithium heparin-treated tubes (BD Vacutainer and BD Biosciences, San Jose, CA, USA). This cell suspension was washed twice in PBS.
From then on, cells were kept throughout staining with fluorescent markers and measurement on flow cytometer in a modified RPMI medium. The Ca2+ concentration of the modified RPMI medium was set to 2 mM by addition of crystalline CaCl2.
Surface staining
For surface marker staining, PBMCs and CBMCs were incubated with anti-CD4 PE-Cy7 and anti-CD8 APC-Cy7 anti-human conjugated mAbs according to the manufacturers’
instructions.
Cell activation
At the beginning of each measurement 2 min baseline was recorded. T-cell activation was initiated by phytohemagglutinin (15 mg/ml in final concentration). In each experiment fluorescence emission of sequentially measured cells was monitored for 12 minutes, the time which is needed for the decline of the PHA induced calcium signal in adult and cord blood human T-cells (23). In average, about 1 x 10⁶ cells were measured.
Cytoplasmic Ca2+kinetics measurement
Cytoplasmic free Ca2+ level was detected by loading the cells with Fluo-3-AM (emission maximum, 526 nm, recorded with a 530/30 nm band pass filter (BP filter)). Cells were loaded with 2.6 mM Fluo-3-AM and 0.02% Pluronic F-127 for 30 minutes at 30 oC. Cells were washed once before measurements. At the end of the measurements ionomycin was added to the samples to verify the specificity of the signal (17).
Measurement of superoxide generation
Dihydroethidium (DHE), a redox-sensitive probe reacts with superoxide and results in the formation of a fluorescent dye (emission maximum, 605 nm, recorded with 610/20 nm BP filter). Cells were loaded with 1 mM DHE for 18 minutes at 37 oC (17).
Measurement of baseline mitochondrial mass and investigation of the kinetics of mitochondrial Ca2+ level, mitochondrial membrane potential upon activation
Mitochondrial mass was estimated by staining with potential insensitive mitochondrial dye, MitoTracker Green (emission maximum: 516 nm recorded in with a 530/30 nm BP filter).
Cells were loaded with 150 nM MitoTracker Green for 30 minutes at 37 oC in the dark. Cells were washed once before measurements.
Mitochondrial Ca2+ level was monitored using Rhod2/AM (emission maximum, 581 nm, recorded with a 575/26 nm BP filter). Cells were loaded with 2.5 mM Rhod2/AM and 0.02%
Pluronic F-127 for 20 minutes at 30 oC and washed once before measurements. At the end of each measurement FCCP was added to the sample to verify the specificity of the signal (17).
Mitochondrial membrane potential was estimated by staining with TMRM (emission maximum, 567 nm recorded with 575/26 nm BP filter) in quench/dequench mode. Cells were loaded with 1 μM TMRM for 20 min at 37 oC in the dark and washed once before measurement.
At the end of the measurements FCCP was added to the sample to verify the specificity of the signal.
Equipment and gating methods
All flow cytometric measurements were performed on a BD FACSAria flow cytometer (BD Biosciences, San Jose, CA) equipped with 488- and 633-nm excitation lasers and data were processed using the FACSDiVa software.
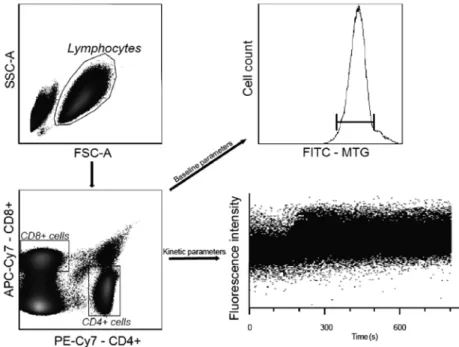
The population of lymphocytes was gated according to forward scatter characteristics and side scatter characteristics. PE-Cy7 conjugated anti-CD4 and APC-Cy7 conjugated anti CD8 antibodies were used for the gating of CD4+ and CD8+ T-cell subpopulations. The gating strategy of flow cytometry data is shown in Fig. 1.
Fig 1. Staining and gating strategy. The population of lymphocytes was gated from PBMCs according to Forward Scatter Characteristics and Side Scatter Characteristics. The CD4+ or CD8+ subpopulations were differentiated
according to the surface staining and used either for the measurement of baseline parameters (for example mitochondrial mass by MitoTracker Green (MTG)) or for kinetic measurements
Data analysis
Data acquired from the measurements were evaluated with specific software developed at our laboratory. The core of this software is an improved version of an algorithm (15) based on fitting of logistic or double logistic functions to each recording (14). The logistic function was used to characterize continuously increasing fluorescence values, while the double logistic function was used to describe measurements that have an increasing phase, a peak and a decreasing phase as time passes. The software also calculates parameter values describing each function, such as the maximum value (Max), the time to reach maximum value (tmax), slope at 50% of maximum (Slope), ending value (End) and the area under the curve (AUC).
One unit (U) of the AUC value is defined as one relative intensity value in 1 s, where relative intensity values are the rate of actual intensity values divided by intensity values at 0 s.
Comparison of parameter distributions of the two groups was made by probability binning method (21), Mann–Whitney tests were performed as tests of normality (performed
Acta Physiologica Hungarica 102, 2015
according to Kolmogorov–Smirnoff) indicated non-normal distribution of data. Mann–
Whitney tests were used to test the difference between baseline parameters in the different cell populations. Two tailed p-values obtained with less than 0.05, were considered as significant.
Results Mitochondrial mass
To examine the mitochondrial mass in resting CD4+ and CD8+ T-cell populations isolated from newborn cord blood and adult peripheral-blood, we measured the whole cell fluorescent intensity of MitoTracker Green, a mitochondrial specific fluorescent dye. Mitochondrial mass was significantly decreased in the neonatal CD4+ T-cell populations compared to the adult CD4+ T-cells, while the difference in the CD8+ T-lymphocytes was not significant (Fig. 2A).
Fig. 2. Comparison of resting T-cell parameters. Median fluorescence values of the mitochondrial specific fluorescence dye MitoTracker Green (MTG) (A); baseline and ionomycin induced cytoplasmic Ca2+-levels measured by Fluo-3 (B and C respectively); mitochondrial Ca2+-levels estimated by Rhod-2 (D); mitochondrial
membrane potential measured by TMRM (E) in adult and neonate CD4+ or CD8+ T-cell subpopulations.
Abbreviations: A-CD4+ – adult CD4+ T-cells; A-CD8+ – adult CD8+ T-cells; N-CD4+ – neonatal CD4+ T-cells, N-CD8+ – neonatal CD8+ T-cells. Data are expressed as median and interquartile range.
* p < 0.05; NS: not significant
Baseline cytoplasmic Ca2+ levels, mitochondrial Ca2+ levels, mitochondrial membrane potential
Lower cytoplasmic Ca2+ levels in neonatal CD4+ T-cells
In order to compare the cytoplasmic Ca2+ levels of unstimulated adult peripheral and neonatal cord blood CD4+ and CD8+ T-cells, T-cells were loaded with Fluo-3-AM, a calcium sensitive fluorescent dye. Baseline cytoplasmic Ca2+ levels of neonatal CD4+ T –cells were lower compared to adult CD4+ lymphocytes whereas no difference was observed between the 2 groups in CD8+ T-cells (Fig. 2B). The addition of the calcium ionophore ionomycin indicating that the capacity for pharmacologically induced calcium flux in neonatal CD4+ T cell was reduced compared to adult CD4+ T-cells, while it was comparable in neonatal and adult CD8+ T-cells (Fig. 2C).
Comparable basal mitochondrial Ca2+ levels and membrane potential in neonatal and adult CD4+ and CD8+ T-cells
When investigating the role of mitochondria in Ca2+-metabolism of neonatal and adult T-cells, first we measured basal mitochondrial Ca2+ levels. Mitochondrial Ca2+ levels of unstimulated neonatal and adult CD4+ or CD8+ T-cells were comparable (Fig. 2D). Mitochondrial membrane potentials of resting CD4+ or CD8+ T-cells were equivalent in the two analyzed groups (Fig. 2E).
PHA induced changes in cytoplasmic Ca2+ levels, mitochondrial Ca2+ levels, mitochondrial membrane potential and superoxide generation
Decreased cytoplasmic Ca2+ levels in neonatal CD8+ cells following PHA induced activation
We stimulated T-cells with PHA and monitored the initial fluctuation of cytoplasmic Ca2+
levels. AUC, Max or End and Slope parameter values were calculated from the fitted functions and compared between the two groups. During short-term activation cytoplasmic Ca2+- response (in term of parameters AUC and Slope) was lower in neonatal than in adult CD8+
T-cells (Fig. 3A and C) while no difference in neonatal and adult CD4+ T-cells was observed (Fig. 3A and B).
Elevated mitochondrial Ca2+ levels in neonatal CD4+following PHA induced activation In order to examine the effect of cytoplasmic Ca2+ signaling on mitochondrial Ca2+-uptake and mitochondrial function we measured mitochondrial Ca2+ levels and mitochondrial membrane potential after stimulation with PHA. The extent and kinetics of mitochondrial Ca2+-uptake induced by PHA addition (characterized by AUC, Slope and End) was increased in CD4+ T cells obtained from neonates compared to adults (Fig. 4A and B), while neonatal CD8+ cells contained less Ca2+ than adult CD8+ T-cells at the end of the measurement (End value) (Fig. 4A and C).
Increased mitochondrial depolarization in neonatal CD4+ and decreased in CD8+ T-cell following PHA stimulation
In parallel to mitochondrial calcium uptake, mitochondrial membrane potential showed similar alterations following PHA stimulation: increased depolarization (AUC and Max) in neonatal CD4+ T-cells compared to adult (Fig. 5A and C) and reduced depolarization in CD8+ neonatal T-lymphocytes compared to that one of adult (AUC, Slope and Max) (Fig. 5A and C).
Acta Physiologica Hungarica 102, 2015
Fig. 3. PHA induced kinetic changes in cytoplasmic Ca2+ levels. Figure shows the calculated median functions
(A) (records of representative samples). Histograms showing the distributions of Area Under the Curve (AUC)
parameter of fitted functions in CD4+ (B) and CD8+(C) T-cells. Abbreviations: A-CD4+ – adult CD4+ T-cells;
A-CD8+ – adult CD8+ T-cells; N-CD4+ – neonatal CD4+
T-cells, N-CD8+ – neonatal CD8+ T-cells
Superoxide generation
To see whether these changes in mitochondrial calcium metabolism and function affect the mitochondrial superoxide generation, we measured the fluorescent intensity changes of DHE after PHA stimulation. Surprisingly superoxide generation was also higher (based on AUC parameter) in neonatal than in adult CD4+ T-cells (Fig. 6A and B) whereas no differences were observed between neonatal and adult CD8+ T-cells (Fig. 6A and C). Table II summarizes our results acquired by PHA stimulation of CBMC and PBMC T-cells.
Fig. 4. PHA induced kinetic changes in mitochondrial Ca2+ levels. Figure shows the calculated median functions (A) (records of representative samples). Histograms showing the
distributions of Area Under the Curve (AUC) parameter of fitted functions in CD4+ (B) and CD8+(C) T-cells. Abbreviations: A-CD4+ – adult
CD4+ T-cells; A-CD8+ – adult CD8+ T-cells;
N-CD4+ – neonatal CD4+ T-cells, N-CD8+ – neonatal CD8+ T-cells
Fig. 5. PHA induced kinetic changes in mitochondrial membrane potential. Figure shows the calculated median
functions (A) (records of representative samples).
Histograms showing the distributions of Area Under the Curve (AUC) parameter of fitted functions in CD4+ (B) and CD8+(C) T-cells. Abbreviations: A-CD4+ – adult CD4+ T-cells; A-CD8+ – adult CD8+ T-cells; N-CD4+
– neonatal CD4+ T-cells, N-CD8+ – neonatal CD8+
T-cells
Discussion
In this study, we have observed that in addition to earlier observations done on cytoplasmic Ca2+-response, neonatal T-cells present other functional characteristics distinct from T-cells of the adult (11, 23). Now we measured reduced baseline cytoplasmic Ca2+ levels and reduced Ca2+-influx capacity in CD4+ neonatal T-cells.
After these observations in Ca2+-handling we focused on mitochondrial function during T-cell activation. The rationale is the previous data suggesting that mitochondria are central players of T-cell activation and Ca2+-signaling (9).
Fig. 6. PHA induced kinetic changes in superoxide generation. Figure shows the calculated median functions (A) (records of representative samples).
Histograms showing the distributions of Area Under the Curve (AUC) parameter of fitted functions in CD4+ (B) and CD8+(C) T-cells.
Abbreviations: A-CD4+ – adult CD4+ T-cells;
A-CD8+ – adult CD8+ T-cells; N-CD4+ – neonatal CD4+ T-cells, N-CD8+ – neonatal CD8+ T-cells
Acta Physiologica Hungarica 102, 2015
Indeed we measured lower mitochondrial mass in neonatal CD4-cells than in those from the adult. Previous study has shown that CD8+ memory T cells contain a higher amount of mitochondria compared to naïve T-cells (24). Neonates, compared to adults, have higher ratio of CD45RA+ naïve T-cells (~90% and ~55%, respectively). The mitochondrial mass of CD4+ naïve and memory T cells has not been investigated so far. Although we did not distinguish naïve and memory T-cells in our experiments, the higher ratio of naïve T-cells might contribute to the lower mitochondrial mass of neonatal CD4+ and CD8+ T-cells.
The mass of mitochondria has a major effect on intracellular Ca2+-handling. Mitochondria act not only as Ca2+-buffers but they have a major impact on Ca2+-channel regulation (20).
Mitochondrial Ca2+-uptake reduces cytoplasmic Ca2+peaks, but delays the return of [Ca2+]c to the baseline. This feature was strikingly different in CD4+ and CD8+ T-cell populations. In the presence of lower mass of mitochondria, neonatal CD4+ T-cells took up more, while CD8+ cells took up less Ca2+ than those in the adult. These altered mitochondrial Ca2+- handling characteristics might shape the cytosolic Ca2+-signal leading to an earlier decline of cytosolic Ca2+-signal. As there are no data available concerning the mitochondrial Ca2+- handling mechanism in neonatal T-cells further studies are required to explain these
Table II. Effects of PHA stimulation on cord blood and adult CD4+ and CD8+ T cell populations
Parameter T-cell subpopulation
Adult CD4+ (n = 10) Neonate CD4+ (n = 11) Adult CD8+ (n = 10) Neonate CD8+ (n = 11) Cytoplasmic Ca2+-levels (CD4+-double logistic+ function; CD8+ logistic+ function)
AUC 1193[799–2263] 1059[789–1760] 1155[791–1881] 982b[726–1445]
Slope 0.0046[0.0016–0.0177] 0.0030[0.0014–0.0136] 0.0022[0.0010–0.0080] 0.0015b [0.0006–0.0073]
Max or End 1.62[1.06–3.26] 1.39[1.02–2.53] 1.62[1.16–2.58] 1.32[0.96–2.01]
Mitochondrial Ca2+-levels (logistic+ function)
AUC 939[691–1541] 989a[693–1582] 960[687–1497] 899[645–1377]
Slope 0.0009[0.0004–0.0041] 0.0018a[0.0009–0.0043] 0.0008[0.0004–0.0060] 0.0024b[0.0007–0.0260]
End 1.37[1.02–2.19] 1.46a[0.94–2.43] 1.46[1.04–2.11] 1.19b[0.85–1.79]
Mitochondrial membrane potential (double logistic+ function)
AUC 797[518–1101] 880a[465–1507] 773[358–1415] 767b[357–1270]
Slope 0.0245[0.0029–0.2203] 0.0061[0.0010–0.0255] 0.0326[0.0037–0.1707] 0.0289b[0.0036–0.1460]
Max 1.15[0.78–1.53] 1.27a[0.69–2.13] 1.13[0.52–2.01] 1.10b[0.60–1.77]
Superoxide generation (O2–) (logistic+ function)
AUC 1001[634–1909] 1058a[676–2412] 955[652–1474] 1008[656–1960]
Slope 0.0010[0.0006–0.0023] 0.0022[0.0007–0.0082] 0.0008[0.0005–0.0013] 0.0029[0.0008–0.0175]
End 1.51[0.99–2.89] 1.49[0.96–3.68] 1.36[0.94–2.06] 1.39[0.89–2.94]
The measured parameter values of logistic+ and double logistic+ functions were AUC (area under the curve in units [U]), Max (double logistic+ function – maximum value in relative parameter value [rpv]),
Slope (slope at the first 50% value of Max), and End (logistic+ function – ending value).
Data are expressed as median and interquartile range.
a Neonatal cord blood samples were compared with adult samples (CD4+ T-cell population), p < 0.05
b Neonatal cord blood samples were compared with adult samples (CD8+ T-cell population), p < 0.05
differences. This issue however is of major importance for immune modulation, as the diminished cytoplasmic Ca2+levels were reported to be responsible for the reduced NFAT- associated gene expression (9, 13).
Of note, mitochondrial depolarization in T-cells upon activation is associated with the altered mitochondrial Ca2+-uptake in the neonatal T cells. Increased mitochondrial depolarization upon PHA induced T-cell activation was detected in neonatal CD4+ cells, as a consequence of elevated mitochondrial Ca2+-sequestration. On the other hand, mitochondrial depolarization was lower in neonatal CD8+ T-cells characterized by smaller Ca2+-uptake.
These findings suggest that the difference in mitochondrial depolarization of T-cells between the neonate and the adult is attributable, at least partly to different Ca2+-handling.
Mitochondrial calcium uptake has a major impact on ROS generation. Activation of T-cells is accompanied by increased reactive oxygen species generation (in a Ca2+-dependent manner (3)). ROS facilitate the expression of the oxidation-dependent nuclear transcription factors NF-κB and AP-1 in T-cells (18). In spite of the diminished CD4+ T-cell mitochondrial mass in the neonatal T-cell, we observed increased ROS production in these cells. This finding suggests altered regulation of mitochondrial ROS production in the very early phase of cord blood T-cell activation and/or the dysfunctionality of intracellular antioxidant defense mechanisms. Additionally, a previous work has demonstrated that between 15 and 75 minutes of T-cell activation in the neonate, these cells produce increased amount of ROS after chemical stimulation (ionomycin + phorbol-dibutyrate) (16) and decreased amount after anti- CD28 mAb stimulation. We propose that the elevated initial and then decreased ROS generation contribute to the different activation characteristics of neonatal T-cells. However, we have to note some limitations regarding our superoxide measurements done in a period when flow cytometry technique was a widely accepted approach for the detection of superoxide generation. However, today HPLC based methods are recommended to detect 2-hydroxyethidium (2-OH-E+), the fluorescence product formed from the DHE/O2•−
reaction (12). Further studies applying these techniques are required to confirm our results about superoxide generation in T-cells; however, our observations provide a sound basis for these experiments.
Upon evaluation of our findings, we are to consider the limitations of our experiments.
Number of samples measured and blood amount (25 ml) of adult and newborn groups were limited, and the study was performed in vitro.
Conclusions
Our data suggest that neonatal T-cells present different characteristics during short-term activation. In addition to reduced cytoplasmic Ca2+-signaling the mitochondrial mass is decreased in neonatal CD4+ T-cells. We measured elevated mitochondrial Ca2+-sequestration and mitochondrial depolarization in CBMC T-cells. All these alterations might contribute to the elevated O2– production and ROS signaling (Fig. 7). These findings indicate that intracellular machinery in its complexity presents different features between neonatal and adult T-cells that may contribute to the immaturity of adaptive immunity of the neonate.
Acta Physiologica Hungarica 102, 2015
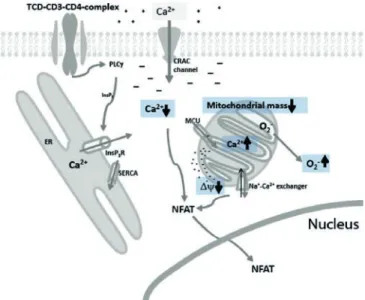
Fig. 7. Schematic representation of neonatal CD4+ T-cell activation.
Schematic representation of CD4+ T-cell activation showing the parameters altered in neonate compared to adult.
In addition to reduced cytoplasmic Ca2+-signaling the mitochondrial mass is decreased in neonatal CD4+ T-cells.
Decreased mitochondrial mass is responsible for the elevated mitochondrial Ca2+-sequestration and mitochondrial depolarization which contribute to the elevated O2– production. All these changes might contribute to reduced
NFAT-associated gene expression in neonatal CD4+ T-cells
Acknowledgement
This work was supported by OTKA Grants 84087 and 101661.
REFERENCES
1. Adkins B: Neonatal immunology: responses to pathogenic microorganisms and epigenetics reveal an
“immunodiverse” developmental state. Immunol. Res. 57, 246–257 (2013)
2. Adkins B, Leclerc C, Marshall-Clarke S: Neonatal adaptive immunity comes of age. Nat. Rev. Immunol. 4, 553–564 (2004)
3. Devadas S, Zaritskaya L, Rhee SG, Oberley L, Williams MS: Discrete generation of superoxide and hydrogen peroxide by T cell receptor stimulation: selective regulation of mitogen-activated protein kinase activation and fas ligand expression. J. Exp. Med. 195, 59–70 (2002)
4. Duchen MR: Mitochondria and calcium: from cell signalling to cell death. J. Physiol. 529 Pt 1, 57–68 (2000) 5. Elahi S, Ertelt JM, Kinder JM, Jiang TT, Zhang X, Xin L, Chaturvedi V, Strong BS, Qualls JE, Steinbrecher KA,
Kalfa TA, Shaaban AF, Way SS: Immunosuppressive CD71+ erythroid cells compromise neonatal host defence against infection. Nature 504, 158–162 (2013)
6. Feske S: Calcium signalling in lymphocyte activation and disease. Nat. Rev. Immunol. 7, 690–702 (2007) 7. García Vela JA, Delgado I, Bornstein R, Alvarez B, Auray MC, Martin I, Oña F, Gilsanz F: Comparative
intracellular cytokine production by in vitro stimulated T lymphocytes from human umbilical cord blood (HUCB) and adult peripheral blood (APB). Anal. Cell. Pathol. 20, 93–98 (2000)
8. Hogan PG, Lewis RS, Rao A: Molecular basis of calcium signaling in lymphocytes: STIM and ORAI. Annu.
Rev. Immunol. 28, 491–533 (2010)
9. Hoth M, Button DC, Lewis RS: Mitochondrial control of calcium-channel gating: a mechanism for sustained signaling and transcriptional activation in T lymphocytes. Proc. Natl Acad. Sci. U.S.A. 97, 10607–10612 (2000)
10. Jackson SH, Devadas S, Kwon J, Pinto LA, Williams MS: T cells express a phagocyte-type NADPH oxidase that is activated after T cell receptor stimulation. Nat. Immunol. 5, 818–827 (2004)
11. Jullien P, Cron RQ, Dabbagh K, Cleary A, Chen L, Tran P, Stepick-Biek P, Lewis DB: Decreased CD154 expression by neonatal CD4+ T cells is due to limitations in both proximal and distal events of T cell activation.
Int. Immunol. 15, 1461–1472 (2003)
12. Kalyanaraman B, Darley-Usmar V, Davies KJ, Dennery PA, Forman HJ, Grisham MB, Mann GE, Moore K, Roberts LJ, Ischiropoulos H: Measuring reactive oxygen and nitrogen species with fluorescent probes:
challenges and limitations. Free Radic. Biol. Med. 52, 1–6 (2012)
13. Kaminski BA, Kadereit S, Miller RE, Leahy P, Stein KR, Topa DA, Radivoyevitch T, Veigl ML, Laughlin MJ:
Reduced expression of NFAT-associated genes in UCB versus adult CD4+ T lymphocytes during primary stimulation. Blood 102, 4608–4617 (2003)
14. Kaposi AS, Toldi G, Mészáros G, Szalay B, Veress G, Vásárhelyi B (2012): Experimental Conditions and Mathematical Analysis of Kinetic Measurements Using Flow Cytometry – The FacsKin Method. In: Flow Cytometry – Recent Perspectives, ed Schmid I, InTech.
15. Kaposi AS, Veress G, Vásárhelyi B, Macardle P, Bailey S, Tulassay T, Treszl A: Cytometry-acquired calcium- flux data analysis in activated lymphocytes. Cytometry A 73, 246–253 (2008)
16. Kilpinen S, Hurme M: Low CD3+CD28-induced interleukin-2 production correlates with decreased reactive oxygen intermediate formation in neonatal T cells. Immunology 94, 167–172 (1998)
17. Mészáros G, Szalay B, Toldi G, Kaposi AS, Vásárhelyi B, Treszl A: Kinetic measurements using flow cytometry:
new methods for monitoring intracellular processes. Assay Drug Dev. Technol. 10, 97–104 (2012)
18. Quintana A, Griesemer D, Schwarz EC, Hoth M: Calcium-dependent activation of T-lymphocytes. Pflugers Arch. 450, 1–12 (2005)
19. Quintana A, Schwindling C, Wenning AS, Becherer U, Rettig J, Schwarz EC, Hoth M: T cell activation requires mitochondrial translocation to the immunological synapse. Proc. Natl Acad. Sci. U.S.A. 104, 14418–14423 (2007)
20. Rizzuto R, De Stefani D, Raffaello A, Mammucari C: Mitochondria as sensors and regulators of calcium signalling. Nat. Rev. Mol. Cell Biol. 13, 566–578 (2012)
21. Roederer M, Treister A, Moore W, Herzenberg LA: Probability binning comparison: a metric for quantitating univariate distribution differences. Cytometry 45, 37–46 (2001)
22. Sena LA, Li S, Jairaman A, Prakriya M, Ezponda T, Hildeman DA, Wang CR, Schumacker PT, Licht JD, Perlman H, Bryce PJ, Chandel NS: Mitochondria are required for antigen-specific T cell activation through reactive oxygen species signaling. Immunity 38, 225–236 (2013)
23. Toldi G, Treszl A, Pongor V, Gyarmati B, Tulassay T, Vásárhelyi B: T-lymphocyte calcium influx characteristics and their modulation by Kv1.3 and IKCa1 channel inhibitors in the neonate. Int. Immunol. 22, 769–774 (2010) 24. van der Windt GJ, Everts B, Chang CH, Curtis JD, Freitas TC, Amiel E, Pearce EJ, Pearce EL: Mitochondrial
respiratory capacity is a critical regulator of CD8+ T cell memory development. Immunity 36, 68–78 (2012) 25. Williams MS, Kwon J: T cell receptor stimulation, reactive oxygen species, and cell signaling. Free Radic. Biol.
Med. 37, 1144–1151 (2004)