Article
Silencing of Poly(ADP-Ribose) Polymerase-2 Induces Mitochondrial Reactive Species Production and
Mitochondrial Fragmentation
Laura Jankó1, Tünde Kovács1, Miklós Laczik2, Zsanett Sári1, Gyula Ujlaki1, Gréta Kis3, Ibolya Horváth4, Miklós Antal3,5, LászlóVígh4, Bálint L. Bálint2 , Karen Uray1 and Péter Bai1,6,7,*
Citation: Jankó, L.; Kovács, T.;
Laczik, M.; Sári, Z.; Ujlaki, G.; Kis, G.;
Horváth, I.; Antal, M.; Vígh, L.; Bálint, B.L.; et al. Silencing of
Poly(ADP-Ribose) Polymerase-2 Induces Mitochondrial Reactive Species Production and
Mitochondrial Fragmentation.Cells 2021,10, 1387. https://doi.org/
10.3390/cells10061387
Academic Editors: Ted M. Dawson and Oleh Khalimonchuk
Received: 23 January 2021 Accepted: 2 June 2021 Published: 4 June 2021
Publisher’s Note:MDPI stays neutral with regard to jurisdictional claims in published maps and institutional affil- iations.
Copyright: © 2021 by the authors.
Licensee MDPI, Basel, Switzerland.
This article is an open access article distributed under the terms and conditions of the Creative Commons Attribution (CC BY) license (https://
creativecommons.org/licenses/by/
4.0/).
1 Department of Medical Chemistry, Faculty of Medicine, University of Debrecen, H-4032 Debrecen, Hungary;
janko.laura@med.unideb.hu (L.J.); kovacs.tunde@med.unideb.hu (T.K.); sari.zsanett@med.unideb.hu (Z.S.);
ujlaki.gyula@med.unideb.hu (G.U.); karen.uray@med.unideb.hu (K.U.)
2 Department of Biochemistry and Molecular Biology, Faculty of Medicine, University of Debrecen, H-4032 Debrecen, Hungary; laczik.miklos@med.unideb.hu (M.L.); lbalint@med.unideb.hu (B.L.B.)
3 Department of Anatomy, Histology and Embryology, Faculty of Medicine, University of Debrecen, H-4032 Debrecen, Hungary; greta@anat.med.unideb.hu (G.K.); antal@anat.med.unideb.hu (M.A.)
4 Biological Research Center of the Hungarian Academy of Sciences, H-6726 Szeged, Hungary;
hibi@lipidart.com (I.H.); vigh@lipidart.com (L.V.)
5 MTA-DE Neuroscience Research Group, H-4032 Debrecen, Hungary
6 MTA-DE Lendület Laboratory of Cellular Metabolism, H-4032 Debrecen, Hungary
7 Research Center for Molecular Medicine, Faculty of Medicine, University of Debrecen, H-4032 Debrecen, Hungary
* Correspondence: baip@med.unideb.hu; Tel.: +36-52-412-345; Fax: +36-52-412-566
Abstract:PARP2 is a DNA repair protein. The deletion of PARP2 induces mitochondrial biogenesis and mitochondrial activity by increasing NAD+levels and inducing SIRT1 activity. We show that the silencing of PARP2 causes mitochondrial fragmentation in myoblasts. We assessed multiple pathways that can lead to mitochondrial fragmentation and ruled out the involvement of mitophagy, the fusion–fission machinery, SIRT1, and mitochondrial unfolded protein response. Nevertheless, mitochondrial fragmentation was reversed by treatment with strong reductants, such as reduced glutathione (GSH), N-acetyl-cysteine (NAC), and a mitochondria-specific antioxidant MitoTEMPO.
The effect of MitoTEMPO on mitochondrial morphology indicates the production of reactive oxygen species of mitochondrial origin. Elimination of reactive oxygen species reversed mitochondrial fragmentation in PARP2-silenced cells.
Keywords:PARP2; ARTD2; oxidative stress; mitochondrial biogenesis; skeletal muscle; mitochon- drial fragmentation; mitochondrial morphology
1. Introduction
Optimal mitochondrial biogenesis requires the coordinated expression of nuclear and mitochondrial genes. Most mitochondrial genes are coded in the nucleus. There is a dominant flow of information and material from the nucleus and the cytosol to the mitochondria, termed anterograde signaling [1]. The appropriate flux of protein from the cytosol to the mitochondria requires the coordinated regulation of nuclear transcription by a large set of nuclear transcription factors [2]. This web of transcription factors responds to changes in nutrient levels (amino acids, oxygen, NAD+, etc.) and cellular energy charge.
Therefore, the transcriptional programs can accommodate the actual nutrient and energy charge of cells [3–6]. The disruption of nutrient sensing and mitonuclear proteostasis plays a pathogenic role in metabolic and neoplastic diseases [7–9].
An increase in the mitochondrial content of cells is termed mitochondrial biogene- sis [2,10]. Mitochondria undergo constant quality control [10–15], in which, among others, mitophagy [16–18] and the mitochondrial unfolded protein response (mtUPR) [19,20]
Cells2021,10, 1387. https://doi.org/10.3390/cells10061387 https://www.mdpi.com/journal/cells
Cells2021,10, 1387 2 of 23
play a major role. Mitochondrial activity and mitochondrial quality control modulate the structure of the cellular mitochondrial network. Higher mitochondrial output usually ac- companies fusion of the mitochondrial network, while removal of damaged mitochondrial components is associated with the fragmentation of the mitochondrial network [12,21–23].
poly(ADP-ribose) polymerases constitute a large protein family (PARP/ARTD1-17).
Members of the PARP/ARTD family share the PARP catalytic domain that can cleave NAD+to nicotinamide and ADP-ribose, subsequently using ADP-ribose as building blocks to build large poly(ADP-ribose) polymers (PAR) [24,25]. PARP2 accounts for around 15%
of total cellular PARP activity, as a function of the model system used [26–29]. PARP2 can be activated by DNA strand breaks, irregular DNA forms [29–31], lipid species [32,33], and signal transduction pathways [34–36]. PARP2 is primarily localized to the nucleus [29,37]
and is highly expressed in the testes [29], thymus, central nervous system, liver, cortex of the kidney, stomach, and intestinal epithelia [26]. PARP2 was first described as a DNA remodeling and repair enzyme [26,29,38–40] with a role in tumor biology [41–45].
Since then, other physiological and pathophysiological roles were identified for PARP2 in spermiogenesis [40,46], immune function [47–51], oxidative injury [27,52,53], metabolic and mitochondrial regulation [33,54–57], autophagy [58], cancer cachexia [59,60], and transcription [33,48–50,54,56,61] (we refer the readers to thorough reviews [35,36]). Impor- tantly, the inhibition of PARP2 is responsible for many of the side effects of clinical PARP inhibitors [49,50].
PARP2 is involved in mitochondrial and metabolic regulation. The interactions are multipronged; nevertheless, from the perspective of our study, two biological processes are vital for understanding the interplay between SIRT1 and PARP2 and the involvement of PARP2 in autophagy. SIRT1 is a NAD+-dependent protein deacetylase [62] that can deacetylate and, hence, induce key mitochondrial transcription factors, such as the peroxi- some proliferator-activated receptor cofactor-1α(PGC1α) or the forkhead box protein O1 (FOXO1) [63–67]. PARP2 can induce SIRT1 expression and activity that consequently leads to mitochondrial biogenesis [27,55,57]. Furthermore, we recently showed that the genetic deletion or silencing of PARP2 blocks autophagy [58], which can influence mitochondrial morphology and mitochondrial quality control. In that study, our aim was to assess how PARP2 affects mitochondrial morphology.
2. Materials and Methods 2.1. Chemicals
All chemicals, glutathione (GSH), N-acetyl-L-cysteine (NAC), and MitoTEMPO, were from Sigma-Aldrich (St. Louis, MO, USA). GSH (cat. no. G4251) and NAC (cat. no. A7250) antioxidants were used at a final concentration of 5 mM for 48 h. A mitochondria-targeted antioxidant MitoTEMPO (cat. no. SML0737) was used at a concentration of 10µM for 48 h.
2.2. Cell Culture
PARP2-silenced C2C12 cells were described in [55]. C2C12 cells were cultured in DMEM (cat. no. D6429, Sigma-Aldrich, 4500 mg/L glucose) containing 10% FBS, 1% peni- cillin/streptomycin, and 2 mM L-glutamine at 37◦C with 5% CO2.
PARP2-silenced HepG2 cells were described in [54]. HepG2 cells were cultured in DMEM (cat. no. D5546, Sigma-Aldrich, 1000 mg/L glucose) containing 10% FBS, 1% penicillin/streptomycin, and 2 mM L-glutamine at 37◦C with 5% CO2.
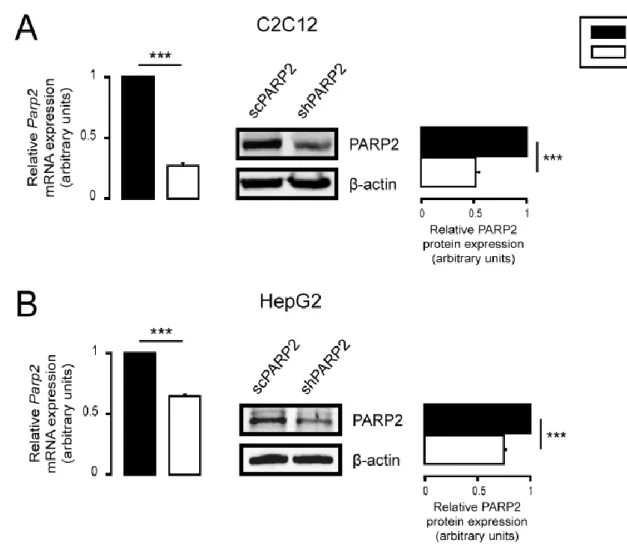
PARP2 was silenced by specific shRNA in both cell lines and maintained over extended periods by selection with 2.5µg/mL of puromycin for C2C12 cells and with 0.25µg/mL of puromycin for HepG2 cells. Cells that harbor the plasmid expressing the small hairpin RNA against PARP2 (i.e., PARP2 silenced) are referred to as shPARP2, while cells that harbor the plasmid expressing a small hairpin RNA that has no target in human or murine cells (controls) are referred to as scPARP2. Both cell lines were established earlier [54,55], and the effectiveness of silencing was verified before experimentation (Figure1A,B).
Cells2021,10, 1387 3 of 23
µ g/mL of puromycin for HepG2 cells. Cells that harbor the plasmid expressing the small hairpin RNA against PARP2 (i.e., PARP2 silenced) are referred to as shPARP2, while cells that harbor the plasmid expressing a small hairpin RNA that has no target in human or murine cells (controls) are referred to as scPARP2. Both cell lines were established earlier [54,55], and the effectiveness of silencing was verified before experimentation (Figure 1A,B).
Figure 1. Silencing of PARP2 in C2C12 myoblasts and HepG2 cells. (A) A total of 200,000 scPARP2 or shPARP2 C2C12 cells were seeded into 6-well plates, and the expression of PARP2 was deter- mined by RT-qPCR (n = 3) and Western blotting (n = 3). (B) A total of 250,000 scPARP2 or shPARP2 HepG2 cells were seeded into 6-well plates, and the expression of PARP2 was determined by RT- qPCR (n = 3) and Western blotting (n = 3). Representative Western blot images are presented. Nu- merical values are presented as the average ± SEM. Statistical significance was determined using paired, two-tailed Student’s t-test. *** Statistically significant differences between scPARP2 and shPARP2 C2C12 cells or scPARP2 and shPARP2 HepG2 cells at p < 0.001.
2.3. Transient Transfection
Silencer Select siRNAs were purchased from Thermo Fisher Scientific (Walthan, MA, USA). SiRNAs targeting PARP2 (cat. no. 4390771, ID: s62056 as #1, s62057 as #2, s62058 as
#3), SIRT1 (cat. no. 4390771, ID: s96766), PARP1 (cat. no. 4390771, ID: s62053 as #1, s62054 as #2, s62055 as #3), PARP3 (cat. no. 4390771, ID: s108205 as #1, s108206 as #2, s108207 as
#3), and negative control (cat. no. 4390843) were used. Cells were plated in 24-well plates and transfected with siRNA at a final concentration of 30 nM using Lipofectamine RNAiMax reagent (cat. no. 13778075, Invitrogen, Carlsbad, CA, USA). Cells were assayed 48 h post-transfection.
2.4. In Vitro Cell Proliferation Assay (SRB Assay)
Cellular proliferation was determined using Sulphorhodamine B (SRB) assay, as de- scribed in [68].
Figure 1.Silencing of PARP2 in C2C12 myoblasts and HepG2 cells. (A) A total of 200,000 scPARP2 or shPARP2 C2C12 cells were seeded into 6-well plates, and the expression of PARP2 was determined by RT-qPCR (n= 3) and Western blotting (n= 3). (B) A total of 250,000 scPARP2 or shPARP2 HepG2 cells were seeded into 6-well plates, and the expression of PARP2 was determined by RT-qPCR (n= 3) and Western blotting (n= 3). Representative Western blot images are presented.
Numerical values are presented as the average±SEM. Statistical significance was determined using paired, two-tailed Student’st-test. *** Statistically significant differences between scPARP2 and shPARP2 C2C12 cells or scPARP2 and shPARP2 HepG2 cells atp< 0.001.
2.3. Transient Transfection
Silencer Select siRNAs were purchased from Thermo Fisher Scientific (Walthan, MA, USA). SiRNAs targeting PARP2 (cat. no. 4390771, ID: s62056 as #1, s62057 as #2, s62058 as
#3), SIRT1 (cat. no. 4390771, ID: s96766), PARP1 (cat. no. 4390771, ID: s62053 as #1, s62054 as #2, s62055 as #3), PARP3 (cat. no. 4390771, ID: s108205 as #1, s108206 as #2, s108207 as #3), and negative control (cat. no. 4390843) were used. Cells were plated in 24-well plates and transfected with siRNA at a final concentration of 30 nM using Lipofectamine RNAiMax reagent (cat. no. 13778075, Invitrogen, Carlsbad, CA, USA). Cells were assayed 48 h post-transfection.
2.4. In Vitro Cell Proliferation Assay (SRB Assay)
Cellular proliferation was determined using Sulphorhodamine B (SRB) assay, as described in [68].
2.5. Detection of Cell Death
To evaluate changes in apoptotic and necrotic cell death, an FITC Annexin V/Dead Cell Apoptosis Kit (cat. no. V13242, Invitrogen) was used according to the manufacturer’s
Cells2021,10, 1387 4 of 23
instructions. Cells were seeded into 6-well plates and treated with the different chemi- cals, as stated. Then, cells were collected and stained with 5µL of FITC annexin V and 100µg/mL of PI for 15 min at room temperature. Cells were analyzed by flow cytometry (FACS Calibur, Becton Dickinson Biosciences, San Jose, CA, USA), and data were analyzed using BD CellQuest Pro software v5.2 (Becton Dickinson Biosciences).
2.6. Determination of Cellular ATP Level
Cells were seeded into 6-well plates and treated, as indicated. ATP levels were determined using an ATP Assay Kit (cat. no. MAK190, Sigma-Aldrich, St. Louis, MO, USA). ATP concentration was measured in 96-well black plates using a fluorimeter (Spark 20M, Tecan Life Sciences, Männedorf, Switzerland). ATP levels were normalized to protein content, and normalized readings are presented.
2.7. MitoTracker Red Staining
Cells grown on glass coverslips were treated with the specified chemicals, as indi- cated, or transfected with the indicated siRNAs (see Figure legend). Mitochondria were stained with MitoTracker Red, as described in [69]. Confocal images were acquired with a Leica TCS SP8 confocal microscope (Leica, Wetzlar, Germany) and LAS X software v3.5.5.19976 (Leica). Processed images were analyzed using ImageJ v1.44 software with Mito-Morphology Macro [70], yielding the mitochondrial number, content, circularity, and form factor. Form factor is derived from the area-to-perimeter ratio [71]; hence its decrease would signify fragmentation. Circularity increases if the shape of an object is closer to a circle; hence, increased circularity suggests that the mitochondria are not elongated, which is a feature of a disassembled mitochondrial network. Perimeter is a similar term; a decrease in perimeter indicates smaller mitochondria. For co-localization analysis and the assessment of the Pearson correlation coefficient, ImageJ software with EzColocalization plug-in was used [72].
2.8. Immunofluorescence
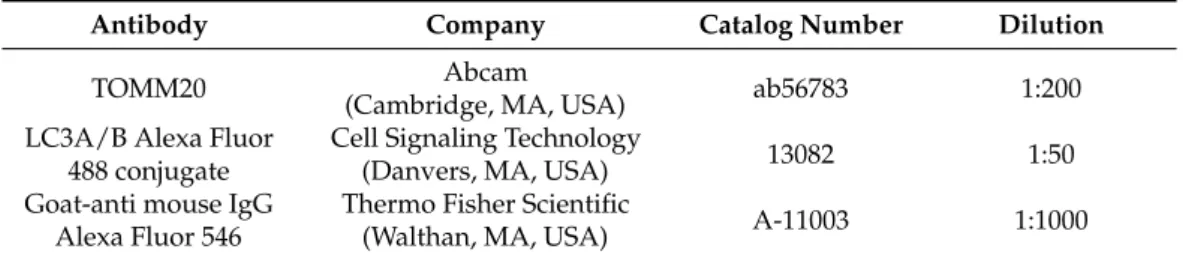
Immunofluorescence was described in [58]. Antibodies used in immunofluorescence are listed in Table1.
Table 1.List of antibodies used in immunofluorescence.
Antibody Company Catalog Number Dilution
TOMM20 Abcam
(Cambridge, MA, USA) ab56783 1:200
LC3A/B Alexa Fluor 488 conjugate
Cell Signaling Technology
(Danvers, MA, USA) 13082 1:50
Goat-anti mouse IgG Alexa Fluor 546
Thermo Fisher Scientific
(Walthan, MA, USA) A-11003 1:1000
TOMM20: translocase of outer mitochondrial membrane 20.
2.9. Total RNA Preparation and Reverse Transcription–Quantitative PCR (RT-qPCR)
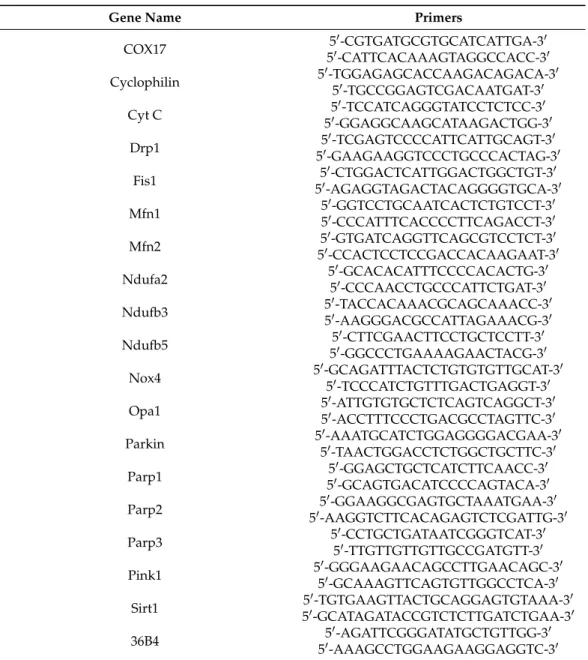
Total RNA preparation, reverse transcription, and qPCR were performed, as described in [58]. Expression was normalized to the geometric mean of murine 36B4 and cyclophilin values. Primers are listed in Table2.
2.10. SDS-PAGE and Western Blotting
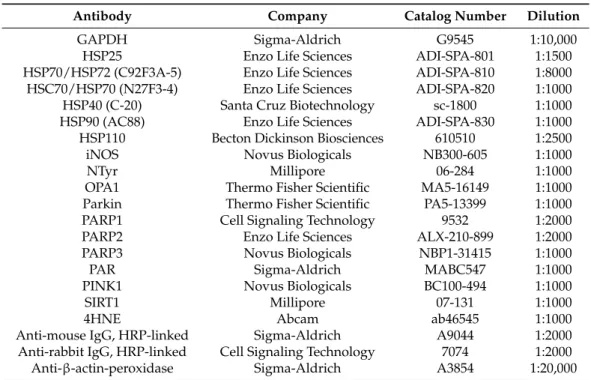
SDS-PAGE and Western blotting were described in [58]. Primary and secondary antibodies are listed in Table3. Bands were quantified by densitometry using ImageJ software v1.44 [73], and densitometry data were analyzed by statistical methods.
Table 2.List of RT-qPCR primers used in the study.
Gene Name Primers
COX17 50-CGTGATGCGTGCATCATTGA-30
50-CATTCACAAAGTAGGCCACC-30
Cyclophilin 50-TGGAGAGCACCAAGACAGACA-30
50-TGCCGGAGTCGACAATGAT-30
Cyt C 50-TCCATCAGGGTATCCTCTCC-30
50-GGAGGCAAGCATAAGACTGG-30
Drp1 50-TCGAGTCCCCATTCATTGCAGT-30
50-GAAGAAGGTCCCTGCCCACTAG-30
Fis1 50-CTGGACTCATTGGACTGGCTGT-30
50-AGAGGTAGACTACAGGGGTGCA-30
Mfn1 50-GGTCCTGCAATCACTCTGTCCT-30
50-CCCATTTCACCCCTTCAGACCT-30
Mfn2 50-GTGATCAGGTTCAGCGTCCTCT-30
50-CCACTCCTCCGACCACAAGAAT-30
Ndufa2 50-GCACACATTTCCCCACACTG-30
50-CCCAACCTGCCCATTCTGAT-30
Ndufb3 50-TACCACAAACGCAGCAAACC-30
50-AAGGGACGCCATTAGAAACG-30
Ndufb5 50-CTTCGAACTTCCTGCTCCTT-30
50-GGCCCTGAAAAGAACTACG-30
Nox4 50-GCAGATTTACTCTGTGTGTTGCAT-30
50-TCCCATCTGTTTGACTGAGGT-30
Opa1 50-ATTGTGTGCTCTCAGTCAGGCT-30
50-ACCTTTCCCTGACGCCTAGTTC-30
Parkin 50-AAATGCATCTGGAGGGGACGAA-30
50-TAACTGGACCTCTGGCTGCTTC-30
Parp1 50-GGAGCTGCTCATCTTCAACC-30
50-GCAGTGACATCCCCAGTACA-30
Parp2 50-GGAAGGCGAGTGCTAAATGAA-30
50-AAGGTCTTCACAGAGTCTCGATTG-30
Parp3 50-CCTGCTGATAATCGGGTCAT-30
50-TTGTTGTTGTTGCCGATGTT-30
Pink1 50-GGGAAGAACAGCCTTGAACAGC-30
50-GCAAAGTTCAGTGTTGGCCTCA-30
Sirt1 50-TGTGAAGTTACTGCAGGAGTGTAAA-30
50-GCATAGATACCGTCTCTTGATCTGAA-30
36B4 50-AGATTCGGGATATGCTGTTGG-30
50-AAAGCCTGGAAGAAGGAGGTC-30 Ndufa2/Ndufb3/Ndufb5: NADH:ubiquinone oxidoreductase subunit A2/B3/B5; Cox17: cytochrome c oxidase;
Cyt C: cytochrome c; Sirt1: sirtuin 1; Mfn1: mitofusin 1; Mfn2: mitofusin 2; Opa1: optic atrophy 1; Fis1: fission;
Drp1: dynamin-1-like protein; Pink1: PTEN induced kinase 1; PARP1: poly(ADP-ribose) polymerase-1, PARP3:
poly(ADP-ribose) polymerase-3, Nox4: NADPH oxidase 4.
2.11. Determination of Lipid Peroxidation (TBARS Assay)
Lipid peroxidation was assessed by determining the production rate of thiobarbituric acid-reactive substances (TBARS) similar to [74].
2.12. Determination of the Oxygen Consumption Rate (OCR)
The oxygen consumption rate was determined using the XF96 Flux Analyzer (Agilent Technologies, Santa Clara, CA, USA). Cells were seeded into 96-well assay plates and treated with the indicated concentration of different chemicals for 48 h (see Figure legend).
After recording the baseline, the OCR was recorded every 5 min, and 50µM etomoxir (cat.
no. E1905, Sigma-Aldrich) was used for determining the fatty acid oxidation. Data were normalized to protein content, and normalized readings are displayed.
Cells2021,10, 1387 6 of 23
Table 3.List of antibodies used for Western blotting.
Antibody Company Catalog Number Dilution
GAPDH Sigma-Aldrich G9545 1:10,000
HSP25 Enzo Life Sciences ADI-SPA-801 1:1500
HSP70/HSP72 (C92F3A-5) Enzo Life Sciences ADI-SPA-810 1:8000 HSC70/HSP70 (N27F3-4) Enzo Life Sciences ADI-SPA-820 1:1000
HSP40 (C-20) Santa Cruz Biotechnology sc-1800 1:1000
HSP90 (AC88) Enzo Life Sciences ADI-SPA-830 1:1000
HSP110 Becton Dickinson Biosciences 610510 1:2500
iNOS Novus Biologicals NB300-605 1:1000
NTyr Millipore 06-284 1:1000
OPA1 Thermo Fisher Scientific MA5-16149 1:1000
Parkin Thermo Fisher Scientific PA5-13399 1:1000
PARP1 Cell Signaling Technology 9532 1:2000
PARP2 Enzo Life Sciences ALX-210-899 1:2000
PARP3 Novus Biologicals NBP1-31415 1:1000
PAR Sigma-Aldrich MABC547 1:1000
PINK1 Novus Biologicals BC100-494 1:1000
SIRT1 Millipore 07-131 1:1000
4HNE Abcam ab46545 1:1000
Anti-mouse IgG, HRP-linked Sigma-Aldrich A9044 1:2000
Anti-rabbit IgG, HRP-linked Cell Signaling Technology 7074 1:2000
Anti-β-actin-peroxidase Sigma-Aldrich A3854 1:20,000
HNE: 4-hydroxynonenal, iNOS: inducible nitric oxide synthase; NTyr: nitrotyrosine; HSP: heat shock protein;
HSC: heat shock cognate protein; GAPDH: glyceraldehyde-3-phosphate dehydrogenase.
2.13. Measurement of Superoxide Production (DHE Staining)
Superoxide production was measured using dihydroethidium (DHE) staining. Cells were seeded into 6-well plates for 1 day. Cells were stained with 2.5µM DHE (cat. no.
D7008, Sigma-Aldrich) for 30 min, and fluorescence was analyzed by flow cytometry (FACSCalibur, Becton Dickinson Biosciences, San Jose, CA, USA). For data evaluation, BD CellQuest Pro software v5.2 (Becton Dickinson Biosciences) was used.
2.14. Electron Microscopy
Data from a previous study [58] were re-analyzed. All relevant methodology can be found in [58].
2.15. Statistical Analysis
Statistical analyses were performed using GraphPad Prism v8 software (GraphPad Software, San Diego, CA, USA). The number of repetitions for each experiment is indicated in the figure legends. All groups were checked for normal distribution. For comparing two groups, two-sided Student’s t-tests were applied. For multiple comparisons, one- way ANOVA was conducted, followed by Tukey’s post hoc test (to compare all possible combinations) or Dunnett’s post hoc test (to compare data to one selected group). The levels of significance are indicated in figure captions;ndenotes the number of biological replicates.
3. Results
3.1. Silencing of PARP2 Leads to Fragmented Mitochondria
We assessed the mitochondrial morphology in scPARP2 and shPARP2 C2C12 my- oblasts. Silencing of PARP2 induced the mitochondrial content in cells (a readout called
“Mito Content”), as visualized by Mitotracker Red (Figure2A) and TOMM20 immunos- taining (Figure2B), in good agreement with previous observations [27,55,57]. In addition, the silencing of PARP2 resulted in fragmentation of the mitochondrial network, marked by increased circularity and decreased individual mitochondria perimeters and form factors (Figure2A,B). We re-analyzed electron microscopy sections from a previous study [58] and found that the number of mitochondrial cross sections increase in cells, which indicates the
fragmentation of mitochondria (Figure2C). Acute silencing of PARP2 by siRNA in C2C12 cells led to the induction of mitochondrial content and fragmentation of the mitochondrial network, similar to the findings in the established cell line (Figure3A–C). Pharmacological inhibition of PARP1 by olaparib or nicotinamide was shown to induce mitochondrial fragmentation [20], similar to boosting in cellular NAD+levels [75–80] that aligns well with our observations.
Cells 2021, 10, x FOR PEER REVIEW 8 of 24
Figure 2. Silencing of PARP2 leads to mitochondrial fragmentation. (A,B) A total of 70,000 scPARP2 or shPARP2 C2C12 cells were seeded into 24-well plates on glass coverslips, and the cells were labeled with MitoTracker Red (n = 3) (A) or TOMM20 antibody (B). The nuclei were visualized using DAPI (n = 3). Mitochondrial morphology was analyzed using ImageJ software with Mito-Morphology Macro (measured cells: 20/20). (C) Osmiated scPARP2 and shPARP2 C2C12 cells were analyzed by electron microscopy (n = 1; 45 cells were assessed from each group). Mitochondrial numbers were de- termined using ImageJ software, and mitochondrial intersections number/cell surface were plotted. Representative im- munofluorescence, electron microscopic, and Western blot images are presented in the figure. Numeric values are pre- sented as the average ± SEM in (A) and (B) and as the average ± SD in (C). Statistical significance was determined using paired, two-tailed Student’s t-test in (A–C). *, **, and *** Statistically significant differences between the indicated groups at p < 0.05, p < 0.01, and p < 0.001, respectively.
Figure 2.Silencing of PARP2 leads to mitochondrial fragmentation. (A,B) A total of 70,000 scPARP2 or shPARP2 C2C12 cells were seeded into 24-well plates on glass coverslips, and the cells were labeled with MitoTracker Red (n= 3) (A) or TOMM20 antibody (B). The nuclei were visualized using DAPI (n= 3). Mitochondrial morphology was analyzed using ImageJ software with Mito-Morphology Macro (measured cells: 20/20). (C) Osmiated scPARP2 and shPARP2 C2C12 cells were analyzed by electron microscopy (n= 1; 45 cells were assessed from each group). Mitochondrial numbers were determined using ImageJ software, and mitochondrial intersections number/cell surface were plotted. Representative immunofluorescence, electron microscopic, and Western blot images are presented in the figure. Numeric values are presented as the average±SEM in (A,B) and as the average±SD in (C). Statistical significance was determined using paired, two-tailed Student’st-test in (A–C). *, **, and *** Statistically significant differences between the indicated groups at p< 0.05,p< 0.01, andp< 0.001, respectively.
3.2. SIRT1 Activation, Mitophagy, mtUPR, and the Deregulation of the Mitochondrial Fusion–Fission System Are Not Involved in Mitochondrial Fragmentation in
PARP2-Silenced Cells
Multiple parallel pathways can govern the fragmentation of the mitochondrial net- work. Therefore, we assessed these possibilities. The silencing of PARP2 blocks au- tophagy [58], which may affect mitophagy, leading to mitochondrial fragmentation. We
Cells2021,10, 1387 8 of 23
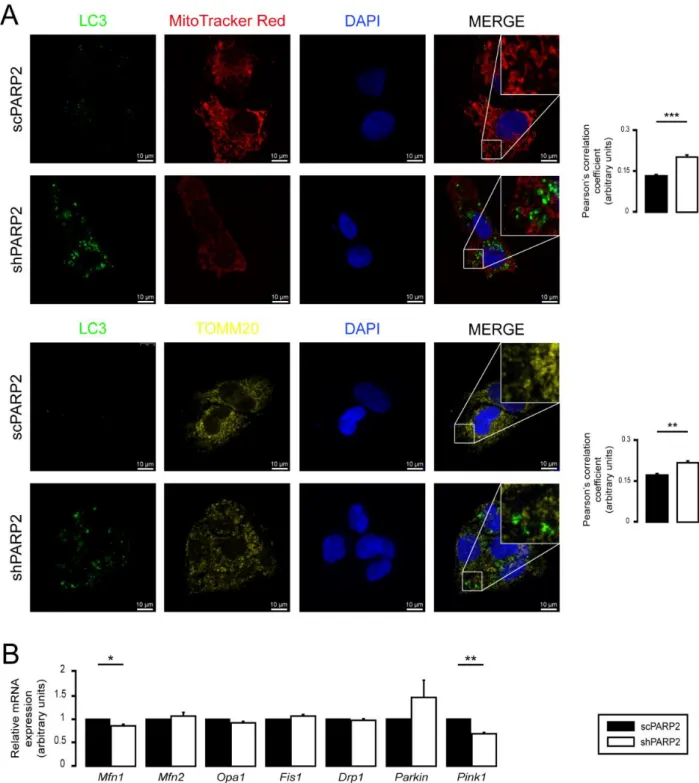
assessed the co-localization of LC3, a marker of autophagic vesicles, and TOMM20, a mitochondrial marker; however, there was no overlap between the LC3+ (a marker for au- tophagosomes) and MitoTracker Red+ or TOMM20+ (both mitochondrial markers) features (Figure4A). For a positive control demonstrating overlap of staining, C2C12 cells were co-stained with Tomm20 and MitoTracker Red (Supplementary Figure S1). Thus, PARP2 silencing did not increase mitophagy. SIRT1 activation is associated with PARP2 silenc- ing [27,55,57], and SIRT1 regulates mitochondrial morphology [75,81]. However, genetic silencing of SIRT1 in shPARP2 cells did not reverse the changes to mitochondrial morphol- ogy (Figure4B). We also checked the involvement of mtUPR, which was shown to play a role in mitochondrial biogenesis induced by pharmacological PARP inhibition [82]. How- ever, no consistent induction in the expression of key heat shock proteins (Hsp25, Hsp40, Hsp60, Hsp70, Hsp90, Hsp110) were detected when scPARP2 and shPARP2 C2C12 cells were compared under control conditions or after heat shock (Supplementary Figure S2).
These pathways are, therefore, unlikely to contribute to mitochondrial fragmentation.
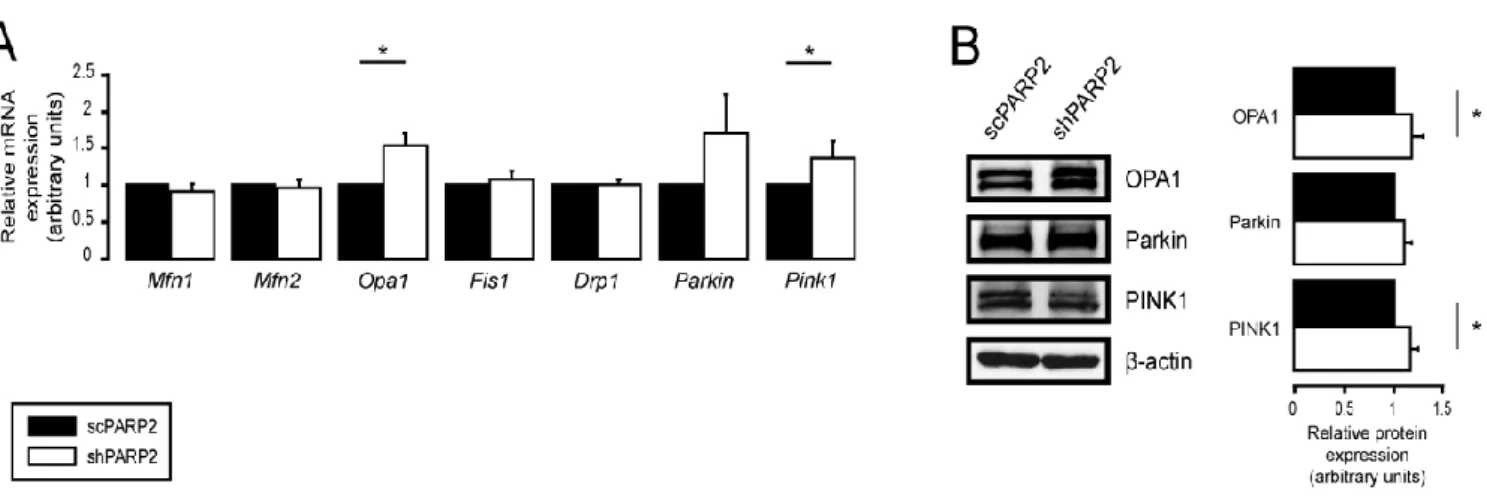
We observed a mild increase in the mRNA and protein expression of OPA1, Parkin, and Pink1 (Figure5A,B).
Cells 2021, 10, x FOR PEER REVIEW 9 of 24
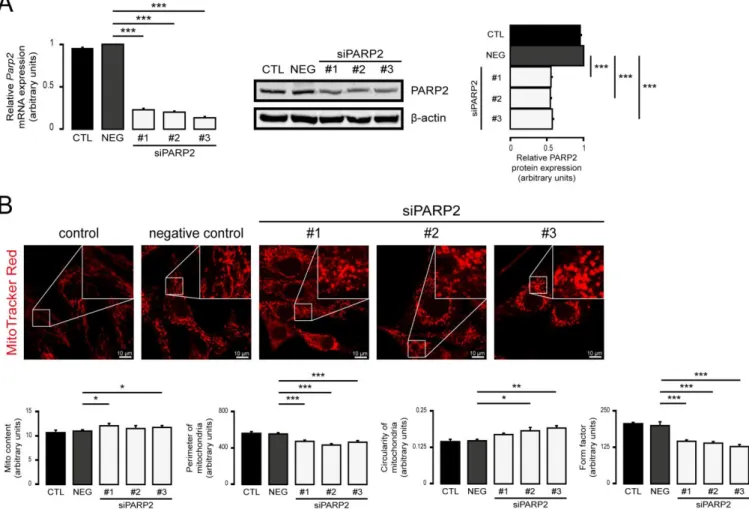
Figure 3. Acute silencing of PARP2 leads to mitochondrial fragmentation. (A,B) A total of 30,000 C2C12 cells were seeded into 24-well plates, and PARP2 was transiently silenced using three types of siRNAs (n = 3). Cells were assessed 48 h post- transfection, then the expression of PARP2 was determined using RT-qPCR (n = 3) and Western blotting (n = 3) (A). In the same cells, mitochondrial structure was investigated using MitoTracker Red staining (n = 3) (B). Mitochondrial morphol- ogy was analyzed using ImageJ software with Mito-Morphology Macro (measured cells: 20 from each group). Representa- tive Western blot and immunofluorescence images are presented. Numerical values are presented as the average ± SEM.
Statistical significance was determined using ANOVA followed by Dunnett’s post hoc test. *, **, and *** Statistically sig- nificant differences between the negative control and transiently transfected samples at p < 0.05, p < 0.01, and p < 0.001, respectively.
Figure 3.Acute silencing of PARP2 leads to mitochondrial fragmentation. (A,B) A total of 30,000 C2C12 cells were seeded into 24-well plates, and PARP2 was transiently silenced using three types of siRNAs (n= 3). Cells were assessed 48 h post-transfection, then the expression of PARP2 was determined using RT-qPCR (n= 3) and Western blotting (n= 3) (A).
In the same cells, mitochondrial structure was investigated using MitoTracker Red staining (n= 3) (B). Mitochondrial morphology was analyzed using ImageJ software with Mito-Morphology Macro (measured cells: 20 from each group).
Representative Western blot and immunofluorescence images are presented. Numerical values are presented as the average±SEM. Statistical significance was determined using ANOVA followed by Dunnett’s post hoc test. *, **, and ***
Statistically significant differences between the negative control and transiently transfected samples atp< 0.05,p< 0.01, and p< 0.001, respectively.
Cells 2021, 10, x FOR PEER REVIEW 10 of 24
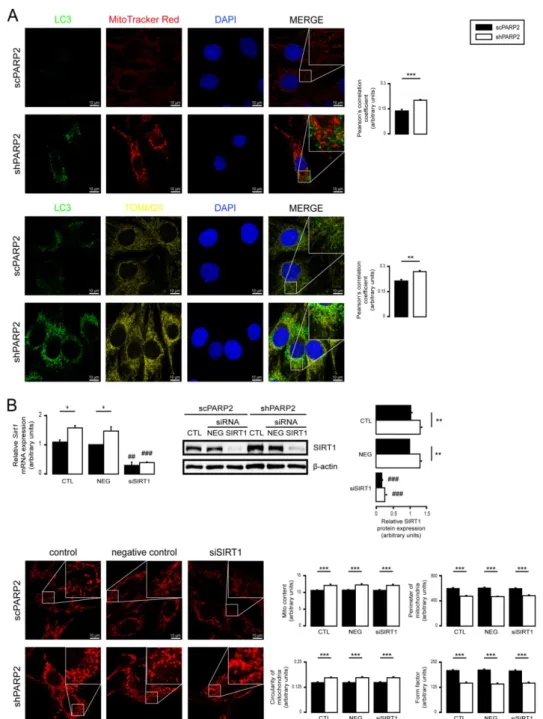
Figure 4. Mitochondrial fragmentation in shPARP2 C2C12 is not due to mitophagy or SIRT1 activation. (A) A total of 70,000 scPARP2 or shPARP2 C2C12 cells were seeded into 24-well plates on glass coverslips, and LC3-MitoTracker Red–
DAPI or LC3-TOMM20–DAPI co-immunofluorescence was performed (n = 3). Co-localization analysis was performed using ImageJ software with the EzColocalization plug-in (measured cells: 100/100). (B) A total of 30,000 scPARP2 or
Figure 4.Mitochondrial fragmentation in shPARP2 C2C12 is not due to mitophagy or SIRT1 activation. (A) A total of 70,000 scPARP2 or shPARP2 C2C12 cells were seeded into 24-well plates on glass coverslips, and LC3-MitoTracker Red–DAPI or LC3-TOMM20–DAPI co-immunofluorescence was performed (n= 3). Co-localization analysis was performed using ImageJ software with the EzColocalization plug-in (measured cells: 100/100). (B) A total of 30,000 scPARP2 or shPARP2 C2C12 cells were seeded into 24-well plates, and SIRT1 was transiently silenced. After transfection, the expression of SIRT1 was determined using RT-qPCR (n= 3) and Western blotting (n= 3). The mitochondrial structure was investigated using MitoTracker Red staining (n= 3). Mitochondrial morphology was analyzed using ImageJ software with Mito-Morphology Macro (measured cells: 20 from each group). Representative immunofluorescence and Western blot images are presented in the figure. Numerical values are presented as the average±SEM. Statistical significance was determined using paired, two-tailed Student’st-test in (A), while in (B), ANOVA followed by Tukey’s post hoc test was used. *, **, and *** Statistically significant differences between the scPARP2 and shPARP2 C2C12 cells atp< 0.05,p< 0.01, andp< 0.001, respectively.##
and###Statistically significant differences between the negative control and transiently transfected samples atp< 0.01 and p< 0.001, respectively.
Cells2021,10, 1387 10 of 23
Cells 2021, 10, x FOR PEER REVIEW 11 of 24
shPARP2 C2C12 cells were seeded into 24-well plates, and SIRT1 was transiently silenced. After transfection, the expres- sion of SIRT1 was determined using RT-qPCR (n = 3) and Western blotting (n = 3). The mitochondrial structure was inves- tigated using MitoTracker Red staining (n = 3). Mitochondrial morphology was analyzed using ImageJ software with Mito- Morphology Macro (measured cells: 20 from each group). Representative immunofluorescence and Western blot images are presented in the figure. Numerical values are presented as the average ± SEM. Statistical significance was determined using paired, two-tailed Student’s t-test in (A), while in (B), ANOVA followed by Tukey’s post hoc test was used. *, **, and *** Statistically significant differences between the scPARP2 and shPARP2 C2C12 cells at p < 0.05, p < 0.01, and p <
0.001, respectively. ## and ### Statistically significant differences between the negative control and transiently transfected samples at p < 0.01 and p < 0.001, respectively.
Figure 5. Deregulation of mitochondrial dynamics did not influence mitochondrial fragmentation. (A,B) A total of 200,000 scPARP2 or shPARP2 C2C12 cells were seeded into 6-well plates. (A) mRNA and (B) protein expression of the indicated mitochondrial fusion/fission genes were assessed by RT-qPCR (n = 4/6) or Western blotting (n = 3). Representative Western blot images are presented in (B). Numerical values are presented as the average ± SEM. Statistical significance was deter- mined using paired, two-tailed Student’s t-test. * Statistically significant differences between the scPARP2 and shPARP2 C2C12 cells at p < 0.05.
3.3. Mitochondrial Fragmentation Is Not Specific for C2C12 Myoblasts
We assessed another cell line in which PARP2 was silenced (scPARP2 and shPARP2 cell lines). Similar to shPARP2 C2C12 cells, in shPARP2 HepG2 cells also, we observed mitochondrial fragmentation marked by an increased number of mitochondrial cross sec- tions on EM sections, decreased perimeter of individual mitochondria, decreased form factor, and increased circularity of mitochondria in MitoTracker-stained and TOMM20- stained cells (Figure 6A–C). Nevertheless, similar to C2C12 cells, no overlap between LC3- and TOMM20-positive features in shHepG2cells was detected (Figure 7A), suggesting that mitochondrial fragmentation is not due to increased mitophagy. We also assessed the mRNA expression of a set of genes involved in regulating mitochondrial morphology.
The silencing of PARP2 decreased the expression of Mitofusin1 (Mfn1) and Pink1 (Figure 7B). The expression pattern of the genes involved in regulating mitochondrial morphol- ogy was not similar in shPARP2 C2C12 cells and shPARP2 HepG2 cells, making it un- likely that the deregulation of these genes could be responsible for mitochondrial frag- mentation.
Figure 5. Deregulation of mitochondrial dynamics did not influence mitochondrial fragmentation. (A,B) A total of 200,000 scPARP2 or shPARP2 C2C12 cells were seeded into 6-well plates. (A) mRNA and (B) protein expression of the indicated mitochondrial fusion/fission genes were assessed by RT-qPCR (n= 4/6) or Western blotting (n= 3). Representative Western blot images are presented in (B). Numerical values are presented as the average±SEM. Statistical significance was determined using paired, two-tailed Student’st-test. * Statistically significant differences between the scPARP2 and shPARP2 C2C12 cells atp< 0.05.
3.3. Mitochondrial Fragmentation Is Not Specific for C2C12 Myoblasts
We assessed another cell line in which PARP2 was silenced (scPARP2 and shPARP2 cell lines). Similar to shPARP2 C2C12 cells, in shPARP2 HepG2 cells also, we observed mitochondrial fragmentation marked by an increased number of mitochondrial cross sections on EM sections, decreased perimeter of individual mitochondria, decreased form factor, and increased circularity of mitochondria in MitoTracker-stained and TOMM20- stained cells (Figure6A–C). Nevertheless, similar to C2C12 cells, no overlap between LC3- and TOMM20-positive features in shHepG2cells was detected (Figure7A), suggesting that mitochondrial fragmentation is not due to increased mitophagy. We also assessed the mRNA expression of a set of genes involved in regulating mitochondrial morphology. The silencing of PARP2 decreased the expression of Mitofusin1 (Mfn1) and Pink1 (Figure7B).
The expression pattern of the genes involved in regulating mitochondrial morphology was not similar in shPARP2 C2C12 cells and shPARP2 HepG2 cells, making it unlikely that the deregulation of these genes could be responsible for mitochondrial fragmentation.
3.4. Silencing of PARP2 Leads to Oxidative Stress, Originating Partly from the Mitochondria through Mitochondrial Protein Imbalance and Fragmentation
The redox state of cells changes in response to PARP inhibition (reviewed in [83,84]).
The oxidative stress markers, dihydroethidine fluorescence, 4-hidroxynonenal (4HNE), and thiobarbituric acid-reactive substances (TBARS), increased in shPARP2 C2C12 cells (Figure8A–C) compared with controls. Nitrosative stress markers did not exhibit large changes (Figure8D–F).
To determine the effects of increased oxidative stress on mitochondrial fragmen- tation, we assessed how general reductants, such as reduced glutathione (GSH) or N- acetyl-cysteine (NAC), and a mitochondrial-targeted antioxidant MitoTEMPO affected mitochondrial morphology (similar to [69]). Although the antioxidants did not prevent mitochondrial biogenesis (marked by “Mito content” in Figure9A), they affected the struc- ture of the mitochondrial network (“Perimeter” and “Form factor” in Figure9A). All three antioxidants increased the perimeters and form factors in mitochondria and slightly de- creased the circularity of mitochondria in shPARP2 cells (Figure9A). These results suggest that mitochondrial fragmentation relies on oxidative stress of mitochondrial origin.
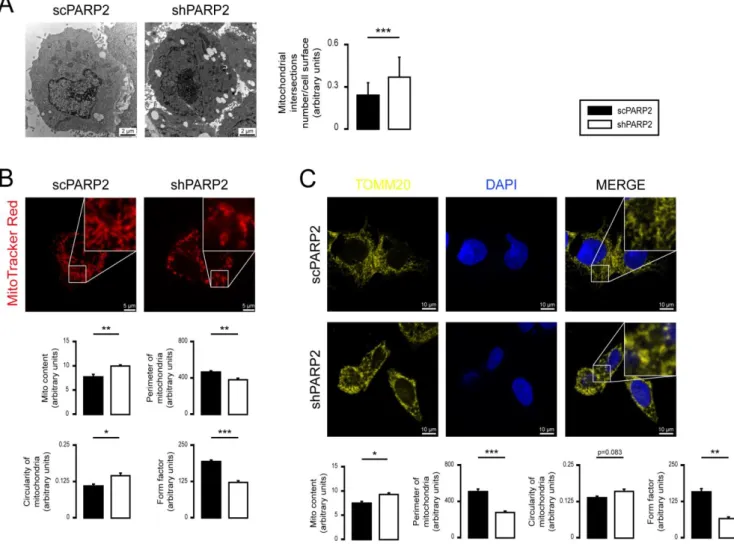
Figure 6. Silencing of PARP2 induces mitochondrial fragmentation in HepG2 cells. (A) Osmiated scPARP2 and shPARP2 HepG2 cells were analyzed by electron microscopy (n = 1; 45 cells were assessed from each group). Mitochondrial numbers were determined using ImageJ software, and mitochondrial intersections number/cell surface were plotted. (B,C) A total of 80,000 scPARP2 or shPARP2 HepG2 cells were seeded into 24-well plates on glass coverslips, and the cells were labeled with MitoTracker Red (n = 3) (B) or TOMM20 antibody (C) (n = 3). The nuclei were visualized using DAPI. Mitochondrial morphology was analyzed using ImageJ software with Mito-Morphology Macro (measured cells: 20/20). Representative Western blot and electron microscopic and immunofluorescence images are presented in the figure. Numerical values are presented as the average ± SEM in (B) and (C) and as the average ± SD in (A). Statistical significance was determined using paired, two-tailed Student’s t-test. *, **, and *** Statistically significant differences between the scPARP2 and shPARP2 HepG2 cells at p < 0.05, p < 0.01, and p < 0.001, respectively.
Figure 6.Silencing of PARP2 induces mitochondrial fragmentation in HepG2 cells. (A) Osmiated scPARP2 and shPARP2 HepG2 cells were analyzed by electron microscopy (n= 1; 45 cells were assessed from each group). Mitochondrial numbers were determined using ImageJ software, and mitochondrial intersections number/cell surface were plotted. (B,C) A total of 80,000 scPARP2 or shPARP2 HepG2 cells were seeded into 24-well plates on glass coverslips, and the cells were labeled with MitoTracker Red (n= 3) (B) or TOMM20 antibody (C) (n= 3). The nuclei were visualized using DAPI. Mitochondrial morphology was analyzed using ImageJ software with Mito-Morphology Macro (measured cells: 20/20). Representative Western blot and electron microscopic and immunofluorescence images are presented in the figure. Numerical values are presented as the average±SEM in (B,C) and as the average±SD in (A). Statistical significance was determined using paired, two-tailed Student’st-test. *, **, and *** Statistically significant differences between the scPARP2 and shPARP2 HepG2 cells atp< 0.05,p< 0.01, andp< 0.001, respectively.
We assessed how the expression of mitochondrial genes responds to antioxidant treatment. The expression of Ndufa2, Ndufb3, Ndufb5, Cox17, and cyt C was induced in shPARP2 C2C12 cells compared with scPARP2 cells (Figure9B). The expression of all genes reduced upon treatment with GSH, NAC, and MitoTEMPO (Figure9B), similar to [69].
These responses were translated into physiological changes, as the antioxidants reduced mitochondrial oxygen consumption (Figure9C), fatty acid oxidation (Figure 9C), and ATP content (Figure9D). There were no differences in cell proliferation and spontaneous cell death between scPARP2 and shPARP2 cells, even in the presence of GSH, NAC, and MitoTEMPO (Figure10A,B).
Cells2021,10, 1387 12 of 23
Cells 2021, 10, x FOR PEER REVIEW 13 of 24
Figure 7. Mitophagy or deregulation of the mitochondrial fusion/fission system is not responsible for mitochondrial frag- mentation in HepG2 cells. (A) A total of 80,000 scPARP2 or shPARP2 HepG2 cells were seeded into 24-well plates on glass coverslips, and LC3-MitoTracker Red–DAPI or LC3-TOMM20–DAPI co-immunofluorescence was performed (n = 3). Co- localization analysis was performed using ImageJ software with the EzColocalization plug-in (measured cells: 100/100).
(B) A total of 250,000 scPARP2 or shPARP2 HepG2 cells were seeded into 6-well plates. The mRNA expression of mito- chondrial fusion/fission genes was assessed by RT-qPCR (n = 3). Representative immunofluorescence images are presented in (A). Numerical values are presented as the average ± SEM. Statistical significance was determined using paired, two- tailed Student’s t-test. *, **, and *** Statistically significant differences between the scPARP2 and shPARP2 HepG2 cells at p < 0.05, p < 0.01, and p < 0.001, respectively.
Figure 7. Mitophagy or deregulation of the mitochondrial fusion/fission system is not responsible for mitochondrial fragmentation in HepG2 cells. (A) A total of 80,000 scPARP2 or shPARP2 HepG2 cells were seeded into 24-well plates on glass coverslips, and LC3-MitoTracker Red–DAPI or LC3-TOMM20–DAPI co-immunofluorescence was performed (n= 3). Co-localization analysis was performed using ImageJ software with the EzColocalization plug-in (measured cells:
100/100). (B) A total of 250,000 scPARP2 or shPARP2 HepG2 cells were seeded into 6-well plates. The mRNA expression of mitochondrial fusion/fission genes was assessed by RT-qPCR (n= 3). Representative immunofluorescence images are presented in (A). Numerical values are presented as the average±SEM. Statistical significance was determined using paired, two-tailed Student’st-test. *, **, and *** Statistically significant differences between the scPARP2 and shPARP2 HepG2 cells atp< 0.05,p< 0.01, andp< 0.001, respectively.
Cells2021,10, 1387 13 of 23
3.4. Silencing of PARP2 Leads to Oxidative Stress, Originating Partly from the Mitochondria through Mitochondrial Protein Imbalance and Fragmentation
The redox state of cells changes in response to PARP inhibition (reviewed in [83,84]).
The oxidative stress markers, dihydroethidine fluorescence, 4-hidroxynonenal (4HNE), and thiobarbituric acid-reactive substances (TBARS), increased in shPARP2 C2C12 cells (Figure 8A–C) compared with controls. Nitrosative stress markers did not exhibit large changes (Figure 8D–F).
Figure 8. Oxidative stress is induced upon the silencing of PARP2. (A) A total of 200,000 scPARP2 or shPARP2 C2C12 cells were seeded into 6-well plates, and superoxide production was determined by dihydroethidium (DHE) staining (n = 3).
(B) A total of 700,000 scPARP2 or shPARP2 C2C12 cells were seeded into T75 cell culture flasks, and lipid peroxidation was determined by TBARS assay (n = 5). Data were normalized to the cell number. (C–E) A total of 200,000 scPARP2 or shPARP2 C2C12 cells were seeded into a 6-well plate. 4-Hydroxynonenal (4HNE) (C), inducible nitric oxide synthase (iNOS) (D), or nitrotyrosine (NTyr) (E) expression was assessed by Western blotting (n = 3). (F) A total of 200,000 scPARP2 or shPARP2 C2C12 cells were seeded into 6-well plates, and the expression of Nox4 was determined by RT-qPCR (n = 3).
Representative Western blot images are presented in (C–E). Numerical values are presented as the average ± SEM. Statis- tical significance was determined using paired, two-tailed Student’s t-test. *, **, and *** Statistically significant differences between the scPARP2 and shPARP2 C2C12 cells at p < 0.05, p < 0.01, and p < 0.001, respectively.
To determine the effects of increased oxidative stress on mitochondrial fragmenta- tion, we assessed how general reductants, such as reduced glutathione (GSH) or N-acetyl- cysteine (NAC), and a mitochondrial-targeted antioxidant MitoTEMPO affected mito- chondrial morphology (similar to [69]). Although the antioxidants did not prevent mito- chondrial biogenesis (marked by “Mito content” in Figure 9A), they affected the structure of the mitochondrial network (“Perimeter” and “Form factor” in Figure 9A). All three an- tioxidants increased the perimeters and form factors in mitochondria and slightly de- creased the circularity of mitochondria in shPARP2 cells (Figure 9A). These results sug- gest that mitochondrial fragmentation relies on oxidative stress of mitochondrial origin.
We assessed how the expression of mitochondrial genes responds to antioxidant treatment. The expression of Ndufa2, Ndufb3, Ndufb5, Cox17, and cyt C was induced in shPARP2 C2C12 cells compared with scPARP2 cells (Figure 9B). The expression of all genes reduced upon treatment with GSH, NAC, and MitoTEMPO (Figure 9B), similar to [69]. These responses were translated into physiological changes, as the antioxidants re- duced mitochondrial oxygen consumption (Figure 9C), fatty acid oxidation (Figure 9C), Figure 8.Oxidative stress is induced upon the silencing of PARP2. (A) A total of 200,000 scPARP2 or shPARP2 C2C12 cells were seeded into 6-well plates, and superoxide production was determined by dihydroethidium (DHE) staining (n= 3).
(B) A total of 700,000 scPARP2 or shPARP2 C2C12 cells were seeded into T75 cell culture flasks, and lipid peroxidation was determined by TBARS assay (n= 5). Data were normalized to the cell number. (C–E) A total of 200,000 scPARP2 or shPARP2 C2C12 cells were seeded into a 6-well plate. 4-Hydroxynonenal (4HNE) (C), inducible nitric oxide synthase (iNOS) (D), or nitrotyrosine (NTyr) (E) expression was assessed by Western blotting (n= 3). (F) A total of 200,000 scPARP2 or shPARP2 C2C12 cells were seeded into 6-well plates, and the expression of Nox4 was determined by RT-qPCR (n= 3). Representative Western blot images are presented in (C–E). Numerical values are presented as the average±SEM. Statistical significance was determined using paired, two-tailed Student’st-test. *, **, and *** Statistically significant differences between the scPARP2 and shPARP2 C2C12 cells atp< 0.05,p< 0.01, andp< 0.001, respectively.
3.5. PARP1 and PARP3 Are Not Involved in Mitochondrial Fragmentation Elicited by the Silencing of PARP2
PARP1 and PARP3 were implicated in regulating mitochondrial morphology [20,85,86];
hence, we assessed the possible involvement of PARP1 and PARP3. Silencing PARP1 in scPARP2 and shPARP2 C2C12 cells (Figure11A) led to the loss of PARP1 auto-PARylation (Figure11A). Silencing of PARP1 induced mild mitochondrial fragmentation in scPARP2 cells; nevertheless, it did not influence the morphology in shPARP2 cells (Figure11B), suggesting little or no involvement in the mitochondrial phenotype in shPARP2 cells.
When PARP3 was silenced (Figure12A), upon the application of the negative control, unspecific siRNA, and two specific siRNA, activation of PARP1 was observed (Figure12A).
Similar to the case of PARP1, silencing of PARP3 in scPARP2 C2C12 cells induces mild mitochondrial fragmentation but does not change the phenotype of the shPARP2 C2C12 cells (Figure12B), suggesting little or no involvement in the mitochondrial phenotype in shPARP2 cells.
Cells2021,10, 1387 14 of 23
Cells 2021, 10, x FOR PEER REVIEW 15 of 24
and ATP content (Figure 9D). There were no differences in cell proliferation and sponta- neous cell death between scPARP2 and shPARP2 cells, even in the presence of GSH, NAC, and MitoTEMPO (Figure 10A,B).
Figure 9. General reductants and MitoTEMPO can prevent mitochondrial fragmentation and mitochondrial biogenesis.
(A) A total of 20,000 scPARP2 or shPARP2 C2C12 cells were seeded into 24-well plates on glass coverslips and treated with 5 mM glutathione (GSH), 5 mM N-acetyl-L-cysteine (NAC), or 10 µ M MitoTEMPO for 48 h. After treatment, the mitochondrial structure was investigated using MitoTracker Red staining (n = 3). Mitochondrial morphology was ana- lyzed using ImageJ software with Mito-Morphology Macro (measured cells: 20 from each group). (B) A total of 100,000 scPARP2 or shPARP2 C2C12 cells were seeded into 6-well plates and treated with 5 mM glutathione (GSH), 5 mM N- acetyl-L-cysteine (NAC), or 10 µ M MitoTEMPO for 48 h. After treatment, mRNA expression of the indicated mitochon- drial genes was assessed by RT-qPCR (n = 4). (C) A total of 2000 scPARP2 or shPARP2 C2C12 cells were seeded into 96- well assay plates and treated with 5 mM glutathione (GSH), 5 mM N-acetyl-L-cysteine (NAC), or 10 µ M MitoTEMPO for 48 h. After treatment, Seahorse assays were performed in the presence or absence of etomoxir to assess total and fatty acid- dependent oxidation (n = 3). (D) A total of 100,000 scPARP2 or shPARP2 C2C12 cells were seeded into 6-well plates and treated with 5 mM glutathione (GSH), 5 mM N-acetyl-L-cysteine (NAC), or 10 µ M MitoTEMPO for 48 h. ATP content was assessed using the ATP Assay Kit. Data were normalized to protein content, and normalized readings are displayed. Rep- resentative immunofluorescence images are presented in (A). Numerical values are presented as the average ± SEM. Sta- tistical significance was determined using ANOVA followed by Tukey’s post hoc test, except for (B); in the shPARP2/scPARP ratio, Dunnett’s post hoc test was used. *, **, and *** Statistically significant differences between the scPARP2 and shPARP2 C2C12 cells at p < 0.05, p < 0.01, and p < 0.001, respectively. #, ##, and ### Statistically significant differences between control and treated samples at p < 0.05, p < 0.01, and p < 0.001, respectively.
Figure 9.General reductants and MitoTEMPO can prevent mitochondrial fragmentation and mitochondrial biogenesis.
(A) A total of 20,000 scPARP2 or shPARP2 C2C12 cells were seeded into 24-well plates on glass coverslips and treated with 5 mM glutathione (GSH), 5 mM N-acetyl-L-cysteine (NAC), or 10µM MitoTEMPO for 48 h. After treatment, the mitochondrial structure was investigated using MitoTracker Red staining (n= 3). Mitochondrial morphology was analyzed using ImageJ software with Mito-Morphology Macro (measured cells: 20 from each group). (B) A total of 100,000 scPARP2 or shPARP2 C2C12 cells were seeded into 6-well plates and treated with 5 mM glutathione (GSH), 5 mM N-acetyl-L-cysteine (NAC), or 10µM MitoTEMPO for 48 h. After treatment, mRNA expression of the indicated mitochondrial genes was assessed by RT-qPCR (n= 4). (C) A total of 2000 scPARP2 or shPARP2 C2C12 cells were seeded into 96-well assay plates and treated with 5 mM glutathione (GSH), 5 mM N-acetyl-L-cysteine (NAC), or 10µM MitoTEMPO for 48 h. After treatment, Seahorse assays were performed in the presence or absence of etomoxir to assess total and fatty acid-dependent oxidation (n= 3). (D) A total of 100,000 scPARP2 or shPARP2 C2C12 cells were seeded into 6-well plates and treated with 5 mM glutathione (GSH), 5 mM N-acetyl-L-cysteine (NAC), or 10µM MitoTEMPO for 48 h. ATP content was assessed using the ATP Assay Kit. Data were normalized to protein content, and normalized readings are displayed. Representative immunofluorescence images are presented in (A). Numerical values are presented as the average±SEM. Statistical significance was determined using ANOVA followed by Tukey’s post hoc test, except for (B); in the shPARP2/scPARP ratio, Dunnett’s post hoc test was used. *, **, and *** Statistically significant differences between the scPARP2 and shPARP2 C2C12 cells atp< 0.05,p< 0.01, andp< 0.001, respectively.#,##, and###Statistically significant differences between control and treated samples atp< 0.05,p< 0.01, andp< 0.001, respectively.
Figure 10. Silencing of PARP2 does not affect cell proliferation or spontaneous cell death. (A) A total of 2000 scPARP2 or shPARP2 C2C12 cells were seeded into 96-well plates and treated with 5 mM glutathione (GSH), 5 mM N-acetyl-L-cysteine (NAC), or 10 µ M MitoTEMPO for 48 h. After treatment, cell proliferation (SRB) assays were performed (n = 3). (B) A total of 100,000 scPARP2 or shPARP2 C2C12 cells were seeded into 6-well plates and treated with 5 mM glutathione (GSH), 5 mM N-acetyl-L-cysteine (NAC), or 10 µ M MitoTEMPO for 48 h. Cell death was assessed using the FITC Annexin V/Dead Cell Apoptosis Kit. Numerical values are presented as the average ± SEM. Statistical significance was determined using ANOVA followed by Tukey’s post hoc test. # Statistically significant differences between control and treated samples at p
< 0.05.
3.5. PARP1 and PARP3 Are Not Involved in Mitochondrial Fragmentation Elicited by the Silencing of PARP2
PARP1 and PARP3 were implicated in regulating mitochondrial morphology [20,85,86]; hence, we assessed the possible involvement of PARP1 and PARP3. Silencing PARP1 in scPARP2 and shPARP2 C2C12 cells (Figure 11A) led to the loss of PARP1 auto- PARylation (Figure 11A). Silencing of PARP1 induced mild mitochondrial fragmentation in scPARP2 cells; nevertheless, it did not influence the morphology in shPARP2 cells (Figure 11B), suggesting little or no involvement in the mitochondrial phenotype in shPARP2 cells. When PARP3 was silenced (Figure 12A), upon the application of the neg- ative control, unspecific siRNA, and two specific siRNA, activation of PARP1 was ob- served (Figure 12A). Similar to the case of PARP1, silencing of PARP3 in scPARP2 C2C12 cells induces mild mitochondrial fragmentation but does not change the phenotype of the shPARP2 C2C12 cells (Figure 12B), suggesting little or no involvement in the mitochon- drial phenotype in shPARP2 cells.
Figure 10.Silencing of PARP2 does not affect cell proliferation or spontaneous cell death. (A) A total of 2000 scPARP2 or shPARP2 C2C12 cells were seeded into 96-well plates and treated with 5 mM glutathione (GSH), 5 mM N-acetyl-L-cysteine (NAC), or 10µM MitoTEMPO for 48 h. After treatment, cell proliferation (SRB) assays were performed (n= 3). (B) A total of 100,000 scPARP2 or shPARP2 C2C12 cells were seeded into 6-well plates and treated with 5 mM glutathione (GSH), 5 mM N-acetyl-L-cysteine (NAC), or 10µM MitoTEMPO for 48 h. Cell death was assessed using the FITC Annexin V/Dead Cell Apoptosis Kit. Numerical values are presented as the average±SEM. Statistical significance was determined using ANOVA followed by Tukey’s post hoc test.#Statistically significant differences between control and treated samples atp< 0.05.
Cells2021,10, 1387 16 of 23
Cells 2021, 10, x FOR PEER REVIEW 17 of 24
Figure 11. Silencing of PARP1 does not influence the mitochondrial morphology induced by the silencing of PARP2. (A,B) A total of 30,000 scPARP2 or shPARP2 C2C12 cells were seeded into 24-well plates, and PARP1 was transiently silenced using three types of siRNAs (n = 3). (A) Cells were assessed 48 h post-transfection, and then the expression of PARP1 was determined using RT-qPCR (n = 3). Expression of PARP1 and PAR was determined using Western blotting (n = 3). (B) In the same cells, the mitochondrial structure was investigated using MitoTracker Red staining (n = 3). Mitochondrial morphology was analyzed using ImageJ software with Mito-Morphology Macro (measured cells: 20 from each group). Repre- sentative Western blot and immunofluorescence images are presented in the figure. Numerical values are presented as the average ± SEM. Statistical significance was determined using ANOVA followed by Tukey’s post hoc test. *** Statistically significant differences between the scPARP2 and shPARP2 C2C12 cells at p < 0.05. #, ##, and ### Statistically significant differ- ences between the negative control and transiently transfected samples at p < 0.05, p < 0.01, and p < 0.001, respectively.
Figure 11. Silencing of PARP1 does not influence the mitochondrial morphology induced by the silencing of PARP2. (A,B) A total of 30,000 scPARP2 or shPARP2 C2C12 cells were seeded into 24-well plates, and PARP1 was transiently silenced using three types of siRNAs (n= 3). (A) Cells were assessed 48 h post-transfection, and then the expression of PARP1 was determined using RT-qPCR (n= 3). Expression of PARP1 and PAR was determined using Western blotting (n= 3). (B) In the same cells, the mitochondrial structure was investigated using MitoTracker Red staining (n= 3). Mitochondrial morphology was analyzed using ImageJ software with Mito-Morphology Macro (measured cells: 20 from each group). Representative Western blot and immunofluorescence images are presented in the figure. Numerical values are presented as the average±SEM. Statistical significance was determined using ANOVA followed by Tukey’s post hoc test. *** Statistically significant differences between the scPARP2 and shPARP2 C2C12 cells atp< 0.05.#,##, and###Statistically significant differences between the negative control and transiently transfected samples atp< 0.05,p< 0.01, andp< 0.001, respectively.
Figure 12. Silencing of PARP3 does not influence the mitochondrial morphology induced by the silencing of PARP2. (A,B) A total of 30,000 scPARP2 or shPARP2 C2C12 cells were seeded into 24-well plates, and PARP3 was transiently silenced using three types of siRNAs (n = 3). (A) Cells were assessed 48 h post-transfection, and then the expression of PARP3 was determined using RT-qPCR (n = 3). Expression of PARP3 and PAR was determined using Western blotting (n = 3). (B) In the same cells, the mitochondrial structure was investigated using MitoTracker Red staining (n = 3). Mitochondrial morphology was analyzed using ImageJ software with Mito-Morphology Macro (measured cells: 20 from each group). Repre- sentative Western blot and immunofluorescence images are presented in the figure. Numerical values are presented as the average ± SEM. Statistical significance was determined using ANOVA followed by Tukey’s post hoc test. *, **, and *** Statistically significant differences between the scPARP2 and shPARP2 C2C12 cells at p < 0.05, p < 0.01, and p < 0.001, respectively.
#, ##, and ### Statistically significant differences between the negative control and transiently transfected samples at p < 0.05, p < 0.01, and p < 0.001, respectively.
Figure 12. Silencing of PARP3 does not influence the mitochondrial morphology induced by the silencing of PARP2. (A,B) A total of 30,000 scPARP2 or shPARP2 C2C12 cells were seeded into 24-well plates, and PARP3 was transiently silenced using three types of siRNAs (n= 3). (A) Cells were assessed 48 h post-transfection, and then the expression of PARP3 was determined using RT-qPCR (n= 3). Expression of PARP3 and PAR was determined using Western blotting (n= 3). (B) In the same cells, the mitochondrial structure was investigated using MitoTracker Red staining (n= 3). Mitochondrial morphology was analyzed using ImageJ software with Mito-Morphology Macro (measured cells: 20 from each group). Representative Western blot and immunofluorescence images are presented in the figure. Numerical values are presented as the average±SEM. Statistical significance was determined using ANOVA followed by Tukey’s post hoc test. *, **, and *** Statistically significant differences between the scPARP2 and shPARP2 C2C12 cells atp< 0.05,p< 0.01, andp< 0.001, respectively.#,##, and
###Statistically significant differences between the negative control and transiently transfected samples atp< 0.05,p< 0.01, andp< 0.001, respectively.
Cells2021,10, 1387 18 of 23
4. Discussion
Previous studies have shown that the genetic deletion of PARP1 or PARP2 [55,87–93]
or pharmacological PARP inhibition [82,87,94] induces mitochondrial biogenesis in multi- ple organs and tissues, including skeletal muscle. In this study, we provide evidence for fragmentation of the mitochondrial network via induction of oxidative stress in cells. Re- duced glutathione (GSH) and N-acetyl-cysteine (NAC), which are known antioxidants that minimize the effect of oxidative stress, reversed the changes to mitochondrial morphology that occur when PARP2 expression is decreased. The mitochondria-targeted antioxidant MitoTEMPO also affected the structure of the mitochondrial network, suggesting that the fragmentation of the mitochondrial network leans on the oxidative stress of mitochon- dria. GSH, NAC, and MitoTEMPO also reduced mitochondrial oxidative phosphorylation.
In good agreement with these results, pharmacological PARP inhibition by olaparib or nicotinamide, as well as increased cellular NAD+levels [75–80], also induce mitochon- drial fragmentation [20]. PARP1 or PARP3 does not compensate for the loss of PARP2 in C2C12 cells. Furthermore, the silencing of PARP1 or PARP3 can bring about signs of mitochondrial fragmentation.
Although SIRT1 activation in the absence of PARP2 was shown to induce mitochon- drial biogenesis [27,55,57] and SIRT1 can regulate mitochondrial morphology [75,81], modulating SIRT1 activity does not influence mitochondrial fragmentation. Silencing of PARP2 induces autophagy [58], making it likely that mitochondrial fragmentation is due to enhanced mitophagy. However, we ruled out the involvement of mitophagy, despite the indication that PARP1 inhibition can induce mitophagy [18]. Furthermore, in the absence of PARP2, the consistent dysregulation of the mitochondrial fusion/fission machinery and the induction of mtUPR were both ruled out.
Treatment of cells with GSH, NAC, or MitoTEMPO reduced the expression of mito- chondrial genes and reduced mitochondrial output but did not reduce mitochondrial con- tent in shPARP2 cells. Taken together, mitochondrial biogenesis upon the absence of PARP2 is dependent on the combined action of increased expression and NAD+-dependent activa- tion of SIRT1 and mitochondrial reactive species production. SIRT1 activation [20,82,86]
and reactive species production [95–97] were linked with mitonuclear proteostasis in other models. Yet, the source of reactive species has not been identified. Nevertheless, higher mitochondrial activity in a cell leads to higher levels of oxygen-centered reactive species in the Szent–Györgyi–Krebs cycle and the mitochondrial electron transport chain [98].
PARP2 has physiological roles in skeletal muscle. Namely, the silencing of PARP2 sup- ports isotype switching, inducing proportions of slow-twitch, type I fibers and supporting mitochondrial biogenesis through inducing SIRT1 [55,57]. Furthermore, the silencing of PARP2 induces the expression of myogenic transcription factors in differentiating C2C12 myoblasts [58], suggesting pro-differentiation effects, while at the same time, the silencing of PARP2 leads to an aberrant stress fiber-like actin structure [58]. The role of PARP2 in skeletal muscle biology warrants further examination. Nevertheless, there is a large set of human diseases involving PARP activation and mitochondrial damage [53,99–103];
hence, our results, in terms of mitochondrial output and mitochondrial morphology, have implications for understanding the protective action of PARP inhibitors in these diseases.
Supplementary Materials:The following are available online athttps://www.mdpi.com/article/10 .3390/cells10061387/s1, Figure S1: Mitochondrial fragmentation in C2C12 is not due to mitophagy or SIRT1 activation, Figure S2: Lack of consistent difference in HSP expression and induction in scPARP2 andshPARP2 cells.
Author Contributions: Conceptualization, P.B. and L.J.; methodology, P.B., L.J., B.L.B., M.L. and M.A.; validation, L.J., P.B. and M.A.; formal analysis, L.J. and M.L.; investigation, L.J., Z.S., T.K., G.K., I.H., G.U. and M.L.; resources, P.B.; data curation, P.B. and L.J.; writing—original draft preparation, P.B. and L.J.; writing—review and editing, P.B., L.J., B.L.B. and K.U.; visualization, L.J.; supervision, P.B., M.A., L.V. and B.L.B.; project administration, L.J. and P.B.; funding acquisition, P.B. All authors have read and agreed to the published version of the manuscript.
Funding: This research was funded by grants from the NKFIH (K123975, GINOP-2.3.2-15-2016- 00006, EFOP-3.6.2-16-2017-00006), the Momentum fellowship of the Hungarian Academy of Sciences, and the University of Debrecen. The research was financed by the Higher Education Institutional Excellence Program (NKFIH-1150-6/2019) of the Ministry of Innovation and Technology in Hungary, within the framework of the biotechnology thematic program of the University of Debrecen. Tünde Kovács was supported by theÚNKP-20-4-II-DE-68 grant. B.L.B. was supported by MOLMEDEX FUN-OMICS (GINOP-2.3.3-15-2016-00007), Debrecen Venture Catapult Program (EFOP-3.6.1-16- 2016-00022), NKFIH K 129166.
Institutional Review Board Statement:Not applicable.
Informed Consent Statement:Not applicable.
Data Availability Statement:All primary data are uploaded to FIGSHARE athttps://figshare.com/
s/afe02e5a75b4a1bd584c(doi:10.6084/m9.figshare.12570068).
Acknowledgments:We are grateful to LászlóFinta for his technical assistance.
Conflicts of Interest:The authors declare no conflict of interest.
References
1. Mottis, A.; Herzig, S.; Auwerx, J. Mitocellular communication: Shaping health and disease.Science2019,366, 827–832. [CrossRef]
2. Scarpulla, R.C. Transcriptional paradigms in mammalian mitochondrial biogenesis and function.Physiol. Rev.2008,88, 611–638.
[CrossRef] [PubMed]
3. Kim, D.H.; Sarbassov, D.D.; Ali, S.M.; King, J.E.; Latek, R.R.; Erdjument-Bromage, H.; Tempst, P.; Sabatini, D.M. mTOR interacts with raptor to form a nutrient-sensitive complex that signals to the cell growth machinery.Cell2002,110, 163–175. [CrossRef]
4. Gwinn, D.M.; Shackelford, D.B.; Egan, D.F.; Mihaylova, M.M.; Mery, A.; Vasquez, D.S.; Turk, B.E.; Shaw, R.J. AMPK phosphoryla- tion of raptor mediates a metabolic checkpoint.Mol. Cell2008,30, 214–226. [CrossRef]
5. Houtkooper, R.H.; Canto, C.; Wanders, R.J.; Auwerx, J. The secret life of NAD+: An old metabolite controlling new metabolic signaling pathways.Endocr. Rev.2010,31, 194–223. [CrossRef]
6. Green, D.R.; Galluzzi, L.; Kroemer, G. Cell biology. Metabolic control of cell death.Science2014,345, 1250256. [CrossRef]
7. Hanahan, D.; Weinberg, R.A. The hallmarks of cancer.Cell2000,100, 57–70. [CrossRef]
8. Hanahan, D.; Weinberg, R.A. Hallmarks of cancer: The next generation.Cell2011,144, 646–674. [CrossRef] [PubMed]
9. Bai, P.; Nagy, L.; Fodor, T.; Liaudet, L.; Pacher, P. Poly(ADP-ribose) polymerases as modulators of mitochondrial activity.Trends Endocrinol. Metab.2015,26, 75–83. [CrossRef] [PubMed]
10. Valero, T. Mitochondrial biogenesis: Pharmacological approaches.Curr. Pharm. Des.2014,20, 5507–5509. [CrossRef]
11. Mottis, A.; Jovaisaite, V.; Auwerx, J. The mitochondrial unfolded protein response in mammalian physiology.Mamm. Genome 2014,25, 424–433. [CrossRef] [PubMed]
12. Ni, H.M.; Williams, J.A.; Ding, W.X. Mitochondrial dynamics and mitochondrial quality control. Redox Biol. 2015,4, 6–13.
[CrossRef]
13. Pickles, S.; Vigié, P.; Youle, R.J. Mitophagy and Quality Control Mechanisms in Mitochondrial Maintenance.Curr. Biol.2018,28, R170–R185. [CrossRef]
14. Song, J.; Herrmann, J.M.; Becker, T. Quality control of the mitochondrial proteome.Nat. Rev. Mol. Cell. Biol.2021,22, 54–70.
[CrossRef]
15. Hill, S.; Van Remmen, H. Mitochondrial stress signaling in longevity: A new role for mitochondrial function in aging.Redox Biol.
2014,2, 936–944. [CrossRef] [PubMed]
16. Andreux, P.A.; Houtkooper, R.H.; Auwerx, J. Pharmacological approaches to restore mitochondrial function. Nat. Rev. Drug Discov.2013,12, 465–483. [CrossRef]
17. Ashrafi, G.; Schwarz, T.L. The pathways of mitophagy for quality control and clearance of mitochondria.Cell Death Differ.2013, 20, 31–42. [CrossRef] [PubMed]
18. Fang, E.F.; Scheibye-Knudsen, M.; Brace, L.E.; Kassahun, H.; Sengupta, T.; Nilsen, H.; Mitchell, J.R.; Croteau, D.L.; Bohr, V.A.
Defective Mitophagy in XPA via PARP-1 Hyperactivation and NAD(+)/SIRT1 Reduction.Cell2014,157, 882–896. [CrossRef]
19. Yi, H.S.; Chang, J.Y.; Shong, M. The mitochondrial unfolded protein response and mitohormesis: A perspective on metabolic diseases.J. Mol. Endocrinol.2018,61, R91–R105. [CrossRef]
20. Mouchiroud, L.; Houtkooper, R.H.; Moullan, N.; Katsyuba, E.; Ryu, D.; Canto, C.; Mottis, A.; Jo, Y.S.; Viswanathan, M.; Schoonjans, K.; et al. The NAD+/Sirtuin Pathway Modulates Longevity through Activation of Mitochondrial UPR and FOXO Signaling.Cell 2013,154, 430–441. [CrossRef]
21. Wai, T.; Langer, T. Mitochondrial Dynamics and Metabolic Regulation.Trends Endocrinol. Metab.2016,27, 105–117. [CrossRef]
22. Meyer, J.N.; Leuthner, T.C.; Luz, A.L. Mitochondrial fusion, fission, and mitochondrial toxicity. Toxicology2017,391, 42–53.
[CrossRef]
23. Nunnari, J.; Suomalainen, A. Mitochondria: In sickness and in health.Cell2012,148, 1145–1159. [CrossRef] [PubMed]