Functional Characterization of Short-Term T-Cell
Activation in Patients with Rheumatoid Arthritis – A Follow-Up Study
Bala´zs Szalay1, A´ ron Cseh2, Gergo˝ Me´sza´ros2, La´szlo´ Kova´cs3, Attila Balog3*, Barna Va´sa´rhelyi1,4
1Department of Laboratory Medicine, Faculty of Medicine, Semmelweis University, Budapest, Hungary,2First Department of Pediatrics, Faculty of Medicine, Semmelweis University, Budapest, Hungary,3Department of Rheumatology, Faculty of Medicine, Albert Szent-Gyo¨rgyi Health Center, University of Szeged, Szeged, Hungary,4MTA- SE, Pediatrics and Nephrology Research Group, Budapest, Hungary
Abstract
Rheumatoid arthritis (RA) is a chronic autoimmune disease characterized by a systemic dysfunction of T-cells. In this study we tested the impact of DMARD and anti-TNF agents on short-term activation characteristics of T-cells. We enrolled 12 patients with newly diagnosed RA (naı¨ve RA) who were treated with methothrexate (MTX) and glucocorticsteroid (GCS) and 22 patients with established RA non responding to conventional DMARD therapy who were treated with different anti-TNF agents. Nine healthy volunteers served as controls. Blood samples were taken at baseline, then at 4thand 8thweek of therapy. The characteristics of several intracellular activation processes during short-term activation of T-cells including cytoplasmic Ca2+ level, mitochondrial Ca2+ level, reactive oxygen species (ROS) and nitric oxide (NO) generation were determined by a novel flow-cytometry technique. At baseline, the tested processes were comparable to controls in naı¨ve RA. During GCS therapy, cytoplasmic Ca2+ level and ROS generation decreased. After the addition of MTX to GCS cytoplasmic Ca2+level became comparable to controls, while ROS generation decreased further. In DMARD non responders, cytoplasmic Ca2+level was higher than controls at baseline. The cytoplasmic Ca2+level became comparable to controls and ROS generation decreased during each of the three anti-TNF-aagent therapies. Mitochondrial Ca2+level and NO generation were unaltered in all of the patient groups. These results indicate that intracellular machinery is affected in T-cells of RA patients. This may alter the behavior of T-cells during activation. Different therapeutic approaches may modulate the abnormal T-cell functions.
Citation:Szalay B, Cseh A´ , Me´sza´ros G, Kova´cs L, Balog A, et al. (2014) The Impact of DMARD and Anti-TNF Therapy on Functional Characterization of Short-Term T-Cell Activation in Patients with Rheumatoid Arthritis – A Follow-Up Study. PLoS ONE 9(8): e104298. doi:10.1371/journal.pone.0104298
Editor:Jan P. Tuckermann, University of Ulm, Germany
ReceivedJanuary 25, 2014;AcceptedJuly 10, 2014;PublishedAugust 6, 2014
Copyright:ß2014 Szalay et al. This is an open-access article distributed under the terms of the Creative Commons Attribution License, which permits unrestricted use, distribution, and reproduction in any medium, provided the original author and source are credited.
Funding:The study was supported by Hungarian Scientific Research Fund (OTKA) (Grant no. 101661), Social Renewal Operational Programme (Grant no. TA´ MOP- 4.2.2.-08/1/KMR-2008-0004) and research grants from Abbott Laboratories and Pfizer. Attila Balog was supported by the Zolta´n Magyary Scholarship (grant no.
TA´MOP-4.2.4. A/2-11-1-2012-001). Abbott and Pfizer have provided an unrestricted research grant to facilitate the purchase of laboratory materials. The funders had no role in study design, data collection and analysis, decision to publish, or preparation of the manuscript.
Competing Interests:The authors confirm that their funding from commercial sources (Abbott Laboratories and Pfizer) does not alter their adherence to PLOS ONE policies on sharing data and materials. The drugs used for patients’ treatment were prescribed by independent doctors, and were purchased and provided by assigned wholesalers in agreement with national contracts with the Hungarian National Health Fund, and reimbursed by the Hungarian National Health Fund.
Participation in the study by the patients had no impact whatsoever on the therapeutic decisions made by the treating physicians.
* Email: balog.attila@med.u-szeged.hu
Introduction
Rheumatoid arthritis (RA) is the most common chronic autoimmune joint disease [1]. It has long been recognized that the immune phenotype (i.e. the prevalences of T-cell subsets) in RA is altered both in the synovium and in the peripheral blood [2,3]. Besides the alterations observed in the immune phenotype, there is increasing evidence in support of the notion that abnormal lymphocyte functions also contribute to the pathogenesis of RA.
Specifically, an increased level of nitric oxide (NO) production [4], altered Ca2+signaling [5] and the enhanced production of reactive oxygen species (ROS) [6] during activation are hallmarks of a T lymphocyte dysfunction in RA.
Several types of traditional disease-modifying anti-rheumatic drugs (DMARDs) and immunesuppressive agents have been demonstrated to influence the T-cell subset distribution and
function, and it is increasingly acknowledged that this action may contribute to the therapeutic effects of such drugs [7]. Recently, we investigated in a follow-up study the changes in T-cell subsets in RA patients in response to conventional DMARD and biological therapies [8], but intracellular activation characteristics in response to these therapies are lacking at present. Moreover, no data are available as to whether the effects on T-cell function differ between individual types of anti-TNF-a agents. We have, therefore, performed a comprehensive follow-up investigation of a variety of T-cell functional parameters including cytoplasmic Ca2+level, ROS generation, NO production and mitochondrial Ca2+level in activated T-cells before and during the administra- tion of synthetic DMARDs or three different anti-TNF-aagents [adalimumab (ADA), etanercept (ETA) and infliximab (IFX)].
Materials and Methods Patients
Twelve patients with naiv RA and twenty two patients with established RA were enrolled in the study. The detailed clinical data and patient characteristics are presented in Table 1.
The naı¨ve RA group (n = 12) had not received any treatment prior to our study. After the established RA diagnosis, DMARD therapy was initiated according to a fixed protocol, which was in agreement with current EULAR and Hungarian National treatment guidelines [9]. This included the administration of medium-dose oral glucocorticosteroid (GCS, methylprednisolone, 16 mg/day) alone for 4 weeks; then GCS was tapered to 8 mg/
day and methotrexate (MTX) was started with a dose of 10 mg/
week. Blood samples were taken before the initiation of DMARD therapy (baseline), then after 4 and 8 weeks of treatment (i.e. after 4 weeks on medium-dose GCS and after a further 4 weeks of combination therapy with tapered-dose GCS+MTX).
In the DMARD nonresponding group with established RA (n = 22) unresponding to standard DMARD combination therapy [i.e. MTX at 15 mg/week and leflunomide (LF) at 20 mg/day], anti-TNF-a therapy was initiated following the standard-of-care decision of the treating physician: ADA at 40 mg/2 weeks sc (n = 8); ETA at 50 mg/week sc (n = 7); or IFX on week 0, 2 and 6 at 3 mg/kg iv (n = 7). At this time, LF was discontinued, while MTX was given simultaneously. Blood samples were taken before the initiation of each anti-TNF-a agent (baseline), and then on Week 4 and 8 of therapy just before the administration of the actual dose of the drug. There were no differences in the baseline characteristics (age, disease duration, disease activity, rheumatoid factor etc.) of the patients in the different anti-TNF-agroups.
The nine age- and gender-matched healthy volunteers who served as controls had a negative history of rheumatic symptoms and a negative status upon detailed physical and laboratory examination. Written informed consent was obtained in advance from all participants. The project was approved by the Ethical Committee of the University of Szeged (ETT-TUKEB 905/PI/
09). This study was conducted in full accordance with the Declaration of Helsinki (1964).
Cell preparation
Similarly to our previous study [10], 18 ml of lithium-heparin- anticoagulated blood was taken from all participants for the investigation of T-cells. Peripheral blood mononuclear cells (PBMCs) were separated by gradient centrifugation with Ficoll- Paque (GE Healthcare Life Sciences, Pittsburgh, PA, USA), washed twice with phosphate-buffered saline pH 7.4 (PBS; Central Pharmacy of Semmelweis University, Budapest, Hungary). The PBMCs were resuspended in modified RPMI medium (Sigma–
Aldrich, St. Louis, MO, USA), the Ca2+concentration of which was set to 2 mM. Samples were incubated with Fluo 3 AM, Rhod2 AM, dihydroethidium and DAF-FM diacetate (Molecular Probes, Carlsbad, CA, USA), which are sensitive to the cytoplasmic Ca2+
level, the mitochondrial Ca2+level, the concentration of ROS and the level of nitric oxide, respectively. The staining conditions were identical to those reported previously [11]. Fluorescence signals were monitored for up to 10 min after the addition of phytohaemagglutinin (PHA) (Sigma–Aldrich, St. Louis, MO, USA), a non-specific activator of T-cells, in a final concentration of 20mg/ml.
Cells were also stained with dyed antibodies against CD4 markers (Becton Dickinson, San Diego, CA, USA) allowing us to gate the cell populations to be monitored during activation.
Equipment and statistical analysis
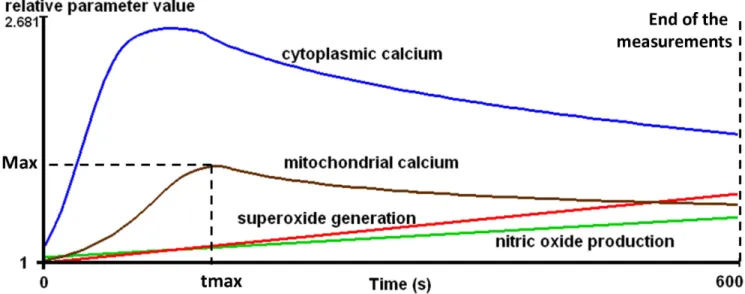
All measurements were performed on a BD FACSAria flow cytometer (Becton Dickinson, San Jose, CA, USA). The kinetic parameters of intracellular processes were determined by using R (R Foundation for Statistical Computing, Vienna, Austria) as follows. The measurement time-frame was divided into 100 time intervals of equal length and the median values were calculated in each interval. The smoothing method of Lowess was applied to the median values and each value was referred to that measured at the beginning of the experiment, furnishing the relative parameter value, rpv. The following parameters were calculated from the rpv data: area under the curve (AUC), the maximum value (Max) and the time required to reach Max (tmax) (Figure 1). One unit (U) of the AUC is defined as a rpv of 1 in 1second. Detailed explanation of these parameters is published in a previous study [12].
Further statistical analysis based on the values of these parameters was performed with R and the Statistica 7 software package (Statsoft, Tulsa, OK, USA). The Mann-Whitney test was applied for the comparison of the data on the controls and the patients, while the paired data in each related patient group were compared by the Friedman test. When the Friedman test demonstrated significant differences, the post hoc Dunn test was used to identify which pairs were significantly different. Levels of p,0.05 were taken as statistically significant. The clinical data in Table 1 and the results in Table 2 are given as median [interquartile range].
Results
Naı¨ve RA patients subjected to DMARD therapy
At baseline, the investigated intracellular parameters of the T- cells during short-term activation were similar to those of the controls (Table 2, Figure 2). At Week 4 of GCS therapy, the cytoplasmic Ca2+ response and the level of ROS production during T-cell activation had decreased significantly and become lower compared to the controls and the baseline values. At Week 8, cytoplasmic Ca2+ response had become comparable to the baseline and control levels, while the ROS production was further impaired.
DMARD nonresponder patients subjected to anti-TNF-a agents
At baseline, the cytoplasmic Ca2+level was higher in this patient group than in the controls (Table 2, Figure 2). The other parameters investigated, including the mitochondrial Ca2+levels, ROS and NO production were comparable to those observed in the controls with the exception of the subgroup treated later with ETA. (These patients exhibited an increased ROS generation capacity at baseline).
On Week 4 of anti-TNF-atherapy, the cytoplasmic Ca2+level became comparable to controls, while ROS generation was decreased significantly to below the baseline, irrespective of the nature of the anti-TNF-aagent administered (including ETA). At this time point, the other parameters investigated were still comparable to those at the baseline in each patient group.
At Week 8, no significant alterations were detected relative to Week 4 in any of the parameters tested.
Discussion
This is the first study that provides a follow-up of T-cell activation characteristics in RA patients subjected to different therapeutic regimes. Our study involved two different RA groups:
naı¨ve RA and DMARD-non responding patients.
Table1.Clinicaldataandpatientcharacteristics. Age(years)Gender (male/female)Diseaseduration (years)Rheumatoid factor(IU/ml)Anti-MCV (IU/ml)TimepointDAS-28 indexCRP (mg/l)ESR (mm/h) Naı¨veRA(n=12)56[50–61]5/70.3[0.2–0.3]104.7[41.8–138.0]65.1[10.3–393.6]Baseline(withouttherapy)6.8[6.1–7.1]63.8[26.4–96.6]64[35–91] Week4,aftermedium-dose GCStherapy4.0[2.9–4.2]2.8[1.4–6.8]14[9–21] Week8,afterlow-dose GCSandMTXtherapy2.4[2.1–3.2]3.4[1.6–5.3]19[14–27] ActiveRAwithIFX therapy(n=7)54[47–57]4/310.0[4.0–14.0]110.0[28.6–392.2]17.4[4.8–395.3]Baseline(on LFandMTXtherapy)6.2[5.7–6.8]13.7[11.8–19.7]35[30–48] Week4ofIFX andMTXtherapy5.1[4.5–5.6]3.1[2.1–6.9]17[13–29] Week8ofIFX andMTXtherapy4.1[3.2–4.5]2.0[1.6–2.4]17[11–20] ActiveRAwithETA therapy(n=7)53[51–61]0/76.5[3.8–11.3]85.0[22.9–236.7]600.0[39.7–1000]Baseline(onLF andMTXtherapy)6.3[6.2–6.8]20.1[12.7–54.4]54[44–62] Week4ofETA andMTXtherapy3.3[2.6–4.4]3.8[2.0–5.7]25[14–29] Week8ofETA andMTXtherapy2.6[2.4–2.8]2.0[2.0–5.9]13[11–36] ActiveRAwithADA therapy(n=8)55[52–59]1/79.0[7.3–10.0]187.0[102.3–377.3]354.6[71.0–857.9]Baseline(onLF andMTXtherapy)6.1[6.0–6.5]29.7[18.6–43.7]46[39–56] Week4ofADA andMTXtherapy3.4[3.0–4.4]9.4[3.1–20.4]28[19–37] Week8ofADA andMTXtherapy3.4[2.9–3.7]5.2[2.0–8.6]26[17–39] GCS=glucocorticosteroid;MTX=methotrexate;LF=leflunomide;IFX=infliximab;ETA=etanercept;ADA=adalimumab;RA=rheumatoidarthritis;Anti-MCV=anti-mutatedcitrullinatedvimentin;DAS-28=diseaseactivityscorein 28joints;CRP=c-reactiveprotein;ESR=erythrocytesedimentationrate. Dataareexpressedasmedian[interquartilerange]. doi:10.1371/journal.pone.0104298.t001
Naı¨ve patients
There is a paucity of studies investigating T-cell activation characteristics in RA. The few data available suggest that increased levels of nitric oxide [13], intracellular Ca2+ [4] and ROS [6] are present in the T-cells of active RA patients and these abnormalities may contribute to the cellular dysfunction. Howev- er, in naı¨ve RA patients we found that these parameters were comparable to those in the controls. The discrepancy between our results and previous studies could be due to the different populations tested as we enrolled newly diagnosed naı¨ve RA subjects, while the published data involved a less specific RA population. Indeed, as we discovered in the case of patients who had suffered from RA for several years, these intracellular mechanisms may be affected in the later stage of the disease that does not respond to DMARD therapy.
The cytoplasmic Ca2+response and ROS production during the short-term activation of T lymphocytes were suppressed relative to the baseline after 4 weeks of GCS therapy. Inin vitroandin vivo animal studies GCS inhibited activated T-cell functions at several points of the intracellular signaling cascade [14]. GCS treatment limits PIP2 hydrolysis and IP3 production [15], down-regulates IP3 receptors [16] and also depletes internal Ca2+ stores [17].
Irrespective of the mechanism, the result at a cellular level is the reduction of the Ca2+ responses during short-term T-cell activation. GCS therapy also decreased intracellular ROS levels in human aortic smooth muscle cells [18]. These reported data are in accordance with our results indicating that GCS therapy has a major impact on the T-cell functionality in early RA.
After 1 month of MTX treatment, the cytoplasmic Ca2+
response during T-cell activation became comparable to controls.
An in vitro animal study revealed evidence that MTX has IP3-like properties and mobilizes Ca2+from the endoplasmic reticulum in a direct way without receptor activation [19]. The increase in the cytoplasmic Ca2+ level may reflect this effect (while it is still uncertain whether the normal appearance of the cytoplasmic Ca2+
level does indicate normal Ca2+signaling in this situation).
In MTX-treated subjects, ROS generation was suppressed further. This phenomenon confirms previous results observed on RA synoviocytes, where MTX inhibited the production of ROS [20]. This finding may be of major clinical relevance, as excessive
ROS production plays a critical role in the pathogenesis of RA [21]. Besides the role of extracellular ROS generation, it has also been demonstrated that increased intracellular ROS production amplifies the synovial inflammatory–proliferative response [22]
and is characteristic of and augments the T-cell dysfunction in RA [23].
RA patients unresponding to DMARD therapy
In the second part of our study, we monitored T-cell functionality of RA patients on anti-TNF-a therapy. We also investigated whether different agents procure different effects on these parameters.
At baseline, (i.e. just before anti-TNF-a therapy) we found a higher cytoplasmic Ca2+ response to stimulation than in the controls. It was noteworthy that the increased Ca2+signal became comparable to controls by Week 4 and remained unaltered at Week 8, irrespectively of the anti-TNF-aagent used. Although this occurred in almost all the patients, it is in contradiction with most of the published data that suggest hyporesponsiveness of the T- lymphocytes in RA [24,25].
The explanation of the discrepancy between the published and our own data is probably the different characteristics of the RA patients enrolled. The enrolled patients in the published studies were predominantly treated with NSAIDs (with no reported effect on the calcium metabolism in the T-cells). In contrast, we collected samples from patients who did not respond to DMARD therapy (that included MTX and LF). No effect of LF on T-cell Ca2+
signaling is known, while MTX has been documented to increase Ca2+response. When LF was replaced by any of the anti-TNF-a agents, the cytoplasmic Ca2+ signal became comparable to controls. It is unclear whether this is due to the introduction of the anti-TNF-aagent and/or to the cessation of LF. Irrespective of the mechanism, our results should be regarded as characteristic of this specific RA subgroup. It is tempting to postulate that an increased cytoplasmic Ca2+ signal might possibly be used as a surrogate marker for the identification of RA patients in whom combination of MTX with leflunomide will not be sufficient and leflunomide is recommended to be replaced by an anti-TNF agent.
This hypothesis should be evaluated further.
Figure 1. Schematic demonstration of kinetic parameters of the investigated intracellular processes during the activation of T- lymphocytes.Max = Maximum value, tmax = Time to reach maximum.
doi:10.1371/journal.pone.0104298.g001
Table2.FunctionalcharacteristicsofintracellularprocessesinCD4+cellsfollowingPHAactivationinRApatientsbeforeandduringtherapy. CytoplasmicCa2+ReactiveoxygenspeciesgenerationNitricoxide productionMitochondrialCa2+ AUC(U)Max(rpv)tmax(s)AUC(U)Max(rpv)tmax(s)AUC(U)AUC(U) Control(n=9)89.06[62.60–131.5]1.211[1.149–1.326]444.8 [192.3–594.4]75.43 [68.01–88.80]1.239 [1.217–1.263]594.5 [594.3–595.3]5.501 [26.919–35.98]64.18 [42.85–97.89] Naı¨veRA(n=12)Baseline (withouttherapy)90.54[73.45–206.5]1.221[1.166–1.581]458.9 [172.6–594.5]74.36 [50.26–90.26]1.245 [1.178–1.308]594.5 [594.0–595.2]34.11 [20.103–76.15]63.03 [33.70–97.45] Week4,after medium-dose GCStherapy 44.55A.B[21.11–74.37]1.127A[1.068–1.201]234.2 [209.0–594.1]48.47A.B [36.15–79.09]1.172 [1.145–1.237]594.7 [594.3–595.4]29.670 [211.43–10.73]40.11 [25.71–58.89] Week8,after low-doseGCS andMTXtherapy
60.67[12.22–111.6]1.232[1.046–1.295]306.5 [289.5–594.1]49.75A [45.87–54.55]1.170A [1.165–1.179]594.6 [594.5–594.8]3.180 [212.39–11.74]55.83 [19.47–72.22] ActiveRAwithIFX therapy(n=7)Baseline(onLF andMTXtherapy)145.1A[126.8–207.4]1.374A[1.315–1.510]594.1 [342.8–594.6]65.04 [53.47–86.19]1.223 [1.170–1.258]594.6 [594.4–595.2]24.62 [27.701–95.59]51.86 [44.98–81.62] Week4ofIFX andMTXtherapy96.97[4.403–162.7]1.240[1.032–1.352]594.5 [276.2–594.6]39.92A.B [33.42–67.93]1.146A [1.141–1.230]594.4 [593.7–595.2]19.82 [214.59–30.06]83.87 [51.44–166.5] Week8ofIFX andMTXtherapy115.9[59.33–141.1]1.328[1.242–1.347]593.9 [288.0–594.9]56.16A [45.14–71.85]1.186A [1.167–1.220]593.6 [593.1–595.5]22.549 [216.00–25.92]67.37 [42.57–118.9] ActiveRAwithETA therapy(n=7)Baseline(onLF andMTXtherapy)141.2A[109.1–235.6]1.319A[1.271–1.535]372.0 [216.7–593.5]94.55A [81.39–111.0]1.293 [1.242–1.372]594.9 [594.2–595.6]20.087 [212.70–22.17]70.62 [59.08–128.8] Week4ofETA andMTXtherapy125.7[64.09–159.1]1.304[1.147–1.396]383.8 [246.1–594.1]73.49B [59.69–81.87]1.235B [1.188–1.275]594.8 [594.1–595.3]21.72 [24.121–87.42]50.93 [34.75–82.80] Week8ofETA andMTXtherapy92.11[49.82–222.8]1.231[1.182–1.491]312.5 [174.3–593.9]72.37 [49.84–105.9]1.226 [1.163–1.300]593.9 [593.7–594.8]8.466 [28.267–62.04]77.45 [26.15–94.89] ActiveRAwithADA therapy(n=8)Baseline(onLF andMTXtherapy)144.4A[128.0–199.8]1.399A[1.320–1.484]557.9 [217.8–594.4]81.89 [69.52–106.8]1.258 [1.220–1.343]594.5 [594.0–594.9]15.86 [1.704–116.9]77.94 [66.09–90.10] Week4ofADA andMTXtherapy93.91[77.45–157.3]1.227[1.188–1.347]497.4 [256.4–594.6]63.21B [34.48–77.15]1.212 [1.155–1.240]594.7 [594.2–595.5]25.87 [26.588–99.43]66.84 [41.83–92.19] Week8ofADA andMTXtherapy107.6[50.18–158.5]1.262[1.146–1.364]432.4 [226.6–594.5]73.95 [61.69–78.82]1.230 [1.211–1.241]594.2 [593.6–594.9]60.43 [26.93–133.0]71.77 [62.20–95.48] Dataareexpressedasmedian[interquartilerange]. AversuscontrolP,0.05; BversusbaselineP,0.05. AUC=areaunderthecurve;Max=maximumvalue;tmax=timetoreachmaximumvalue;rpv=relativeparametervalue. GCS=glucocorticosteroid;MTX=methotrexate;LF=leflunomide;IFX=infliximab;ETA=etanercept;ADA=adalimumab;RA=rheumatoidarthritis. doi:10.1371/journal.pone.0104298.t002
While our results also indicate that NO production and mitochondrial Ca2+handling are not affected during short-term T-cell stimulation by anti-TNF agents in RA, we observed changes in intracellular ROS production during anti-TNF therapy. As discussed above, an increased intracellular ROS production may contribute to the prolonged inflammation observed in RA, and a reduction of ROS may therefore be a beneficial effect. We also found that the baseline ROS production was higher in the ETA- treated group and tended to be higher in the ADA group than in the controls. Although the overproduction of TNF-ais thought to be the main contributor to the increased ROS generation in RA, the effects of anti-TNF-a treatment have not been extensively studied in this RA patient subgroup.
The effect of anti-TNF agents on T-lymphocyte ROS production is not fully elucidated. Data are limited to neutrophils.
Pay et al reported that IFX inhibited the production of ROS in neutrophils in vitro [26], while anti-TNF-a treatment has been stated to be ineffective on ROS production of the neutrophils in RA patients [27,28]. For T-lymphocytes, we demonstrated a significant decrease in all groups at Week 4 of anti-TNF-atherapy, irrespective of whether the baseline ROS production was higher than or comparable to the controls. This effect was most pronounced in the IFX-treated group and proved to be associated with significantly decreased ROS production. At Week 8, we found no changes in the production of ROS relative to that at Week 4; again, this type of anti-TNF action was comparable in the various treatment groups.
The limitations of our work
Evaluating these results one should note that because of the low number of patients enrolled, these observations are suitable for just hypothesis generation and the data can not be extrapolated to large patient cohorts.
In the DMARD nonresponding patients at initiation of anti- TNF-a therapy leflunomide was discontinued, but we could not
investigate whether this effects the intracellular processes in any way.
Conclusions
This study on peripheral blood samples has provided compre- hensive information regarding the functionality of T-cells in RA.
The intracellular T-cell activation processes (including cytoplas- mic Ca2+, ROS, NO generation and mitochondrial Ca2+) during short-term T-cell activation were not altered in early RA. The therapeutic interventions exerted specific effects on the different parameters. GCS decreased cytoplasmic Ca2+signal and the levels of ROS. Tapering the GCS dose and the introduction of MTX increased the cytoplasmic Ca2+signal, but further decreased the levels of ROS. In DMARD non responding patients, the cytoplasmic Ca2+level was higher than in the controls (possibly due to the treatment with MTX). After the introduction of TNFa inhibitors, the cytoplasmic Ca2+ signal became comparable to controls and the levels of ROS decreased. The extent of NO generation and the level of mitochondrial Ca2+were not altered at any time during our study.
These results indicate that intracellular machinery is affected in T-cells of RA patients. This may alter the behavior of T-cells during activation. Different therapeutic approaches may modulate the abnormal T-cell functions.
Acknowledgments
We would like to thank Ambrus Kaposi for technical expertise.
Author Contributions
Conceived and designed the experiments: BS AB BV. Performed the experiments: BS LK AB. Analyzed the data: BS A´ C GM AB. Contributed reagents/materials/analysis tools: BS AB. Wrote the paper: BS AB BV.
Designed the software and algorithm used in analysis: AC GM.
References
1. Scott DL, Wolfe F, Huizinga TW (2010) Rheumatoid arthritis. Lancet 376:
1094–1108.
2. McInnes IB, O’Dell JR (2010) State-of-the-art: rheumatoid arthritis. Ann Rheum Dis 69: 1898–1906.
3. Inman RD, El-Gabalawy HS (2009) The immunology of ankylosing spondylitis and rheumatoid arthritis: a tale of similarities and dissimilarities. Clin Exp Rheumatol 27: S26–32.
4. Nagy G, Clark JM, Buzas E, Gorman C, Pasztoi M, et al. (2008) Nitric oxide production of T lymphocytes is increased in rheumatoid arthritis. Immunol Lett 118: 55–58.
5. Nagy G, Clark JM, Buza´s EI, Gorman CL, Cope AP (2007) Nitric oxide, chronic inflammation and autoimmunity. Immunol Lett 111: 1–5.
6. Phillips DC, Dias HK, Kitas GD, Griffiths HR (2010) Aberrant reactive oxygen and nitrogen species generation in rheumatoid arthritis (RA): causes and Figure 2. Area under the curve values of cytoplasmic calcium and reactive oxigen species in CD4+cells.A-versus controls P,0.05; B- versus baseline P,0.05. AUC = area under the curve; RA = rheumatoid arthritis; IFX = infliximab; ETA = etanercept; ADA = adalimumab.
doi:10.1371/journal.pone.0104298.g002
consequences for immune function, cell survival, and therapeutic intervention.
Antioxid Redox Signal 12: 743–785.
7. Vital EM, Emery P (2008) The development of targeted therapies in rheumatoid arthritis. J Autoimmun 31: 219–227.
8. Szalay B, Vasarhelyi B, Cseh A, Tulassay T, Deak M, et al. (2013) The impact of conventional DMARD and biological therapies on CD4+ cell subsets in rheumatoid arthritis: a follow-up study. Clin Rheumatol.
9. Smolen JS, Landewe´ R, Breedveld FC, Dougados M, Emery P, et al. (2010) EULAR recommendations for the management of rheumatoid arthritis with synthetic and biological disease-modifying antirheumatic drugs. Ann Rheum Dis 69: 964–975.
10. Szalay B, Me´sza´ros G, Cseh A´ , A´cs L, Dea´k M, et al. (2012) Adaptive immunity in ankylosing spondylitis: phenotype and functional alterations of T-cells before and during infliximab therapy. Clin Dev Immunol 2012: 808724.
11. Me´sza´ros G, Szalay B, Toldi G, Kaposi A, Va´sa´rhelyi B, et al. (2012) Kinetic Measurements Using Flow Cytometry: New Methods for Monitoring Intracel- lular Processes. Assay Drug Dev Technol 10: 97–104.
12. Kaposi AS, Veress G, Va´sa´rhelyi B, Macardle P, Bailey S, et al. (2008) Cytometry-acquired calcium-flux data analysis in activated lymphocytes.
Cytometry A 73: 246–253.
13. Nagy G, Koncz A, Telarico T, Fernandez D, Ersek B, et al. (2010) Central role of nitric oxide in the pathogenesis of rheumatoid arthritis and systemic lupus erythematosus. Arthritis Res Ther 12: 210.
14. Van Laethem F, Baus E, Smyth LA, Andris F, Bex F, et al. (2001) Glucocorticoids attenuate T cell receptor signaling. J Exp Med 193: 803–814.
15. Baus E, Andris F, Dubois PM, Urbain J, Leo O (1996) Dexamethasone inhibits the early steps of antigen receptor signaling in activated T lymphocytes.
J Immunol 156: 4555–4561.
16. Harr MW, Rong Y, Bootman MD, Roderick HL, Distelhorst CW (2009) Glucocorticoid-mediated inhibition of Lck modulates the pattern of T cell receptor-induced calcium signals by down-regulating inositol 1,4,5-trisphosphate receptors. J Biol Chem 284: 31860–31871.
17. Lam M, Dubyak G, Distelhorst CW (1993) Effect of glucocorticosteroid treatment on intracellular calcium homeostasis in mouse lymphoma cells. Mol Endocrinol 7: 686–693.
18. Marumo T, Schini-Kerth VB, Brandes RP, Busse R (1998) Glucocorticoids inhibit superoxide anion production and p22 phox mRNA expression in human aortic smooth muscle cells. Hypertension 32: 1083–1088.
19. Pagadigorria CL, Marcon F, Kelmer-Bracht AM, Bracht A, Ishii-Iwamoto EL (2006) Effects of methotrexate on calcium flux in rat liver mitochondria, microsomes and plasma membrane vesicles. Comp Biochem Physiol C Toxicol Pharmacol 143: 340–348.
20. Sung JY, Hong JH, Kang HS, Choi I, Lim SD, et al. (2000) Methotrexate suppresses the interleukin-6 induced generation of reactive oxygen species in the synoviocytes of rheumatoid arthritis. Immunopharmacology 47: 35–44.
21. Hassan SZ, Gheita TA, Kenawy SA, Fahim AT, El-Sorougy IM, et al. (2011) Oxidative stress in systemic lupus erythematosus and rheumatoid arthritis patients: relationship to disease manifestations and activity. Int J Rheum Dis 14:
325–331.
22. Hitchon CA, El-Gabalawy HS (2004) Oxidation in rheumatoid arthritis.
Arthritis Res Ther 6: 265–278.
23. Griffiths HR, Dunston CR, Bennett SJ, Grant MM, Phillips DC, et al. (2011) Free radicals and redox signalling in T-cells during chronic inflammation and ageing. Biochem Soc Trans 39: 1273–1278.
24. Allen ME, Young SP, Michell RH, Bacon PA (1995) Altered T lymphocyte signaling in rheumatoid arthritis. Eur J Immunol 25: 1547–1554.
25. Carruthers DM, Naylor WG, Allen ME, Kitas GD, Bacon PA, et al. (1996) Characterization of altered calcium signalling in T lymphocytes from patients with rheumatoid arthritis (RA). Clin Exp Immunol 105: 291–296.
26. Pay S, Musabak U, Erdem H, Simsek I, Pekel A, et al. (2005) Chimerical anti- TNF-alpha, infliximab, inhibits neutrophil chemotaxis and production of reactive oxygen species by blocking the priming effect of mononuclear cells on neutrophils. Immunopharmacol Immunotoxicol 27: 187–198.
27. den Broeder AA, Wanten GJ, Oyen WJ, Naber T, van Riel PL, et al. (2003) Neutrophil migration and production of reactive oxygen species during treatment with a fully human anti-tumor necrosis factor-alpha monoclonal antibody in patients with rheumatoid arthritis. J Rheumatol 30: 232–237.
28. Capsoni F, Sarzi-Puttini P, Atzeni F, Minonzio F, Bonara P, et al. (2005) Effect of adalimumab on neutrophil function in patients with rheumatoid arthritis.
Arthritis Res Ther 7: R250–255.