PhD DISSERTATION THESES
KAPOSVÁR UNIVERSITY
FACULTY OF ECONOMIC SCIENCES
Doctoral (PhD) School for Management and Organizational Science
Head of PhD School Prof. Dr. SÁNDOR KEREKES University teacher, Doctor of MTA
Supervisor
Prof. Dr. JÁNOS SZÁZ University teacher
THE IMPACT OF INTEREST RATE RISK ON THE VALUE OF BANK PORTFOLIOS
– EVALUATION OF EMBEDDED OPTIONS –
Prepared by:
PETRA KALFMAN
Kaposvár 2016
DOI: 10.17166/KE2016.007
1
Contents
1 BACKGROUND, OBJECTIVES OF RESEARCH ... 2
1.1 REASON FOR SELECTING THE TOPIC ... 2
1.2 PURPOSE OF RESEARCH ... 4
2 MATERIAL AND METHOD ... 8
2.1 GENERAL MODEL... 8
2.2 MODELLING THE INTEREST RATE ... 12
3 RESULTS AND EVALUATION ... 15
3.1 GENERAL FRAMEWORK ... 15
3.2 INCOME-BASED APPROACH ... 19
3.2.1 Without early repayment cost ... 19
3.2.2 With early repayment cost ... 24
3.3 CAPITAL VALUE-BASED APPROACH ... 25
3.4 APPLICATION OF A STRESS INTEREST RATE ENVIRONMENT ... 28
4 CONCLUSIONS ... 31
5 NEW AND NOVEL SCIENTIFIC RESULTS ... 37
6 RECOMMENDATIONS (THEORETICAL AND PRACTICAL USAGE) ... 38
7 SCIENTIFIC DISCLOSURES, PUBLICATIONS ON THE TOPIC OF THE DISSERTATION ... 41
2
1 Background, objectives of research
1.1 Reason for selecting the topic
The management of interest rate risk in itself is not new for banks, there are tested methodologies for the quantification, hedging and efficient monitoring of risks. The special treatment of interest rate risk in the banking book came into the limelight with the Basel II regulation, by lifting the logic of economic capital calculation to a regulatory level within the second pillar.
The regulation supplemented the minimum capital requirement defining mandatory capital reserves with the second pillar relevant for the banks’ own risk assessment, within the framework of which all relevant risks have to be assessed and capital has to be allocated for them based on an own methodology. Interest rate risk in the banking book is mentioned under risks quantifiable under the second pillar. The regulation does not specify any mandatory approaches for the quantification of risks under the second pillar;
several supervisory recommendations were created to support this.
The special importance of interest rate risk in the banking book is indicated by the fact that it is only one among the risks specified in the second pillar in relation to which the regulatory authority expects a stress test and, based on the result of that, a quasi mandatory capital allocation. The significance of the risk is indicated by the regulatory guidelines of the past period. The proposal phrased by the Task Force on the Interest Rate Risk in the Banking Book (TFIR) on the management of the risk under the first pillar was issued in the spring of 2014 but it did not gain the support of professionals. The same proposal was incorporated into the consultation material published in June 2015 as an option of the revised measuring methodology of the interest rate
3
risk in the banking book. The idea of managing the risk with special attention is supported by the generally low interest rate environment and the fear that the banking system should prepare for the risks derived from the expected increase in interest rates with sufficient reserves.
Basically, the interest rate risk in the banking book can be traced back to the characteristics derived from the pricing structure of the balance sheet: due to their different maturity structures, assets and liabilities have different pricing and re-pricing characteristics, they are re-priced with different reference yields which do not correlate with each other completely. A further characteristic of the balance sheet items can be traced back to the behaviour of clients: on the one hand, in the case of liability elements without a contractual maturity, depositors may react differently to the changes of the interest rate environment (moving of deposit portfolios), on the other hand, debtors have a chance to repay their loans early, prior to the contractual maturity, but this decision is not always defined in a financially rational way.
We call these impacts, in summary, risks derived from option characteristics or embedded options in other words. Balance sheet changes derived from client behaviour cannot be indicated in advance deterministically, some of the impact is retraceable to the financially rational decisions made in response to the changes in the interest rate environment, while another part of it originates from behavioural patterns predictable based on other characteristics of the clients.
The dissertation discusses the methodologies for measuring interest rate risk in the banking book, and as a major theme, out of the option characteristics, it pays special attention to the methodologies for measuring options of risks derived from the early repayment opportunities related to retail loans and the quantification methodology of the effect of these projected onto the level of
4
the economic capital. The selection of this topic is justified by the fact that, considering either the summary of literature or the discussion of quantification methodologies, there are only a few relevant researches available. In addition to measuring the early repayment opportunity as an option characteristic, the dissertation focuses on what the extent of the risk depends on, which factors define the extent of the exposure and what the extent of the change in the economic capital level caused by the resultant impact is i.e. what focus should be put on this in the banking risk management.
1.2 Purpose of research
The purpose of the research is to analyse a special side of the interest rate risk. The topic of interest rate risk is too wide, therefore, it was narrowed down to the interest rate risk in the banking book as a type of risk that the continually developing capital regulation framework currently focuses on1. The banking book items to be examined were narrowed down based on the criteria that option characteristics were in the center of the examination and as such, it is basically a characteristic typical of the retail banking portfolio2. Option characteristics are also typical of items on both the asset and the liability sides but due to their different nature, they can be evaluated based on
1 Generally, risk is nothing else but uncertainty. Risk is basically symmetric but because we evaluate risk in the dissertation for the purposes of economic capital, under risk we
understand the downside risk. Downside risk is the risk of a potential decrease in the value of the given asset or a loss derived from depreciation.
2 Assets that cannot be classified into the trading book belong to the banking book. On banking book items the bank’s goal is to realise a profit on the margin difference between assets and liabilities. Products provided for retail and small business clients and the positions derived from these are classified into the retail banking book. The early repayment option is primarily a characteristic typical of retail mortgage loans.
5
varied methodologies, therefore, I selected the evaluation of the early repayment option typical of the asset side, which has a smaller literature.
Accordingly, the goal of the research is the analysis of the option characteristics typical of the retail banking portfolio, particularly of the impact of the early repayment option related to retail mortgage loans on the level of the economic capital.
In connection with the research goal, I have phrased the following hypotheses for the purposes of a detailed examination.
1. Hypothesis: The early repayment option makes a significant impact on the level of the economic capital.
My basic assumption is that the early repayment option may make a significant impact on the bank’s profitability and thus, the level of the economic capital. I assume that the extent of the impact of the early repayment option depends, on the one hand, on the general interest rate environment and the interest rate expectations; the differences between the interest rate structure of the bank’s balance sheet and the interest rate environment i.e. the early repayment incentive’s extent that can be assumed on the bank’s portfolio; the discretional risk composition of the bank’s portfolio and the behavioural patterns of the individual debtors;
the regulation that may either support or complicate the exercising of the early repayment right; and the market structure, more precisely, the application of the partner sales channels.
6
2. Hypothesis: The methodology quantifying the capital impact represents a better approach for the determination of the economic capital impact than the income-based methodology.
Basically two types of methodologies can be applied for the quantification of interest rate risk in the banking book: the approach quantifying the income impact which puts the short-term impact made on the bank’s interest rate profit into the forefront, and the approach quantifying the capital impact whose goal is to define the impact projected on the capital’s present value. I assume that the approach quantifying the capital impact is more appropriate to define the economic capital impact, primarily because the quantified impacts have to be channelled into the banks’ capital management and these decisions are for the long term. The income-based impact has to be channeled in capital value through the change of the interest income but because this approach is for the short term, it is more suitable as a tool for the management of the income base. Due to its long-term approach, the methodology quantifying the capital impact enables dynamic modelling and, through this, the taking of long-term capital management criteria into account.
3. Hypothesis: The factors that influence the impact of the early repayment option on the level of economic capital can be identified easily.
Projecting the calculations onto a hypothetical portfolio, I perform calculations in respect of the model-based quantification of the early repayment impact and, based on the model’s results, I perform additional sensitivity tests to assess the change of which parameters makes the most impact on the result of the economic capital model quantifying the capital
7
impact. These variables can be factors relevant for the portfolio’s composition and external environmental factors.
8
2 Material and method
2.1 General model
Below I attempt to model the impact of the early repayment option on the value of a banking portfolio through a general example. Since no real banking data are available for the calculations, the possibility of the modelling of the optimal early repayment option and the quantification of its theoretical impact are at the center of the modelling. Consequently, I will not go into the impact assessment of the application of the early repayment opportunities derived from the individual, non-optimal decisions.
I perform the modelling on a hypothetical banking portfolio. I show the general logical framework of the model through a simple example. Let’s see a loan portfolio that has four elements; its parameters are included in Table 1.
The changes of the interest cash flows of the loan portfolio and the current yield curve are shown in Table 2.
11 Elements of the hypothetical loan portfolio
Loan 1 Loan 2 Loan 3 Loan 4
Loan amount 1,000,000 1,000,000 1,000,000 1,000,000
Coupon 5% 6% 7% 8%
Residual maturity (years) 5 6 7 4
I forecast the exercising of the early repayment option by defining the refinancing incentive. The refinancing incentive is determined by the current
9
par yield curve. If the par rate3 pertaining to the given residual maturity is more favourable than the current coupon, the loan is repaid earlier, assuming an optimal decision.
22 The loan portfolio’s interest cash flows and the yield curve
Year CF1 CF2 CF3 CF4 r
1 50,000 60,000 70,000 80,000 6.0%
2 50,000 60,000 70,000 80,000 5.8%
3 50,000 60,000 70,000 80,000 5.6%
4 50,000 60,000 70,000 80,000 5.4%
5 50,000 60,000 70,000 5.2%
6 60,000 70,000 5.0%
7 70,000 4.8%
Source: based on my own calculations, my editing
I perform the review for two dates: along the current yield curve and along the one year later, presuming the conditions at that time (it will be replaced later by the modelling of the yield curve). The reason for examining these two dates is that the planning cycle is generally for one year, therefore, it is worth narrowing down the examination of the impact on the interest rate result onto this time interval. An additional assumption is that as the loan is repaid early, the prepaid principal will be placed out at the new par rate for the residual maturity, thus modifying the cash flows of the loan portfolio.
Due to all this, I measure the impact on the interest rate result by defining the difference between the interest of the original cash flows and the interest of the new cash flows generated by the early repayments. Remaining at the example, the calculation is illustrated in Table 3.
3 The par rate is the nominal interest rate (coupon rate) besides which the bond can be issued at nominal value besides the current spot yield curve.
10 33 Expected early repayments of the loan portfolio
Year CF1 CF2 CF3 CF4 r0 par0 r1 par1
k 5% 6% 7% 8%
1 50,000 60,000 70,000 80,000 6.0% 6.00%
2 50,000 60,000 70,000 80,000 5.8% 5.81% 5.8% 5.80%
3 50,000 60,000 70,000 80,000 5.6% 5.61% 5.4% 5.41%
4 50,000 60,000 70,000 80,000 5.4% 5.43% 5.0% 5.03%
5 50,000 60,000 70,000 5.2% 5.24% 4.6% 4.64%
6 60,000 70,000 5.0% 5.06% 4.2% 4.27%
7 70,000 4.8% 4.88% 3.8% 3.89%
Source: based on my own calculations, my editing
Along the current yield curve (r0), it is worth repaying loans 2-4 in the first year since along the par yield curve the par rates pertaining to the residual maturity of these are more favourable i.e. these loans can be refinanced with a lower coupon. In the case of the first loan, it is only a realistic opportunity with the yield curve of one year later, therefore, early repayment will only take place one year later in the case of this loan. Assuming that the repaid loan amount will be placed out again with the new par rate, the cash flows of the bank loan portfolio will change, the result is shown in Table 4.
The impact of the early repayment option on the hypothetical loan portfolio’s interest income is expected to result in a 22.7% fall projected onto one year of the forecast period. The detailed results are shown in Table 5.
11 44 New interest cash flows of the loan portfolio
Year CF1 CF2 CF3 CF4
k 4.64% 5.06% 4.88% 5.43%
1 50,000 50,569 48,751 54,263
2 46,449 50,569 48,751 54,263
3 46,449 50,569 48,751 54,263
4 46,449 50,569 48,751 54,263
5 46,449 50,569 48,751
6 50,569 48,751
7 48,751
Source: based on my own calculations, my editing
55 The impact of early repayment on the loan portfolio’s interest cash flows Cash flows
Original interest income 1,420,000 Modified interest income 1,097,518
Change -322,482
Change % -22.7%
Source: based on my own calculations, my editing
If we wanted to quantify the impact projected onto the present value of the banking book, cash flows have to be supplemented with the principal repayments and the change occurring in the present value of the bonds received this way has to be defined. Table 6 shows the result.
66 The impact of early repayment projected onto the present value of the loan portfolio Present value
Original cash flows 4,248,982
Modified interest income 3,977,905
Change -271,078
Change % -6.4%
Source: based on my own calculations, my editing
12
During the calculations, for the sake of simplicity, I assume that only the interest will be paid in the individual periods, the principal repayment is due in one amount upon maturity. In reality, retail mortgage loans are repayable on an annuity basis. The assumption on principal repayment had to be simplified so that I can apply a calculation method, using calculations in Excel VB, that enables the timely efficient running of the calculations on a computer that can be considered strong to a medium extent. Repayment with annuity would make calculations more precise but it does not affect the final result and conclusions. In the case of annuity-based and bullet cash flows, the difference in the cash flow impact ever increases as the level of the refinancing interest rate level decreases. The correlation is linear. Based on this, we can draw the conclusion that the results of the annuity and bullet type calculations can be tallied with each other based on linear correlations. In the case of bullet type loans consistently higher cash flows are recognised i.e. the final result will be overestimated with this method. Based on the foregoing, it can be established that the simplification of the calculation methodology does not distort the final results, it is suitable for drawing the right conclusions.
2.2 Modelling the interest rate
I apply the Cox, Ingersoll and Ross model (CIR) for the modelling of the yield curve. During the calculations I apply theoretical parameter settings for the modelling of the yield curve. The reason for this is that it should be examinable how sensitively the final results react to the resultant changes.
Table 7 contains the conditions for short-term interest rates (a is the pace of
13
returning to the average, b is the long-term average of the interest rate, is the deviation of the interest rate).
77 Parameters of the short-term interest rate for the CIR model
r0 a b Months
6.0% 0.5 4.0% 5.0% 360
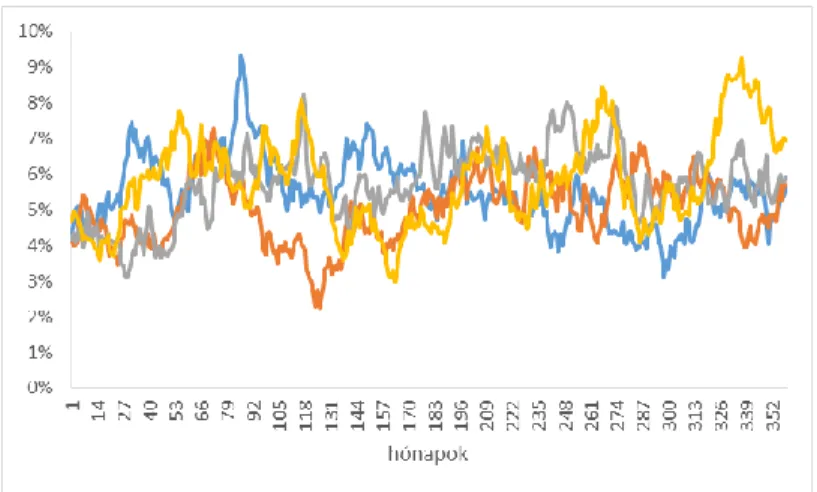
Figure 1 shows the result of the modelling calculated based on the above parameters (5 random runs).
11 Potential runs of the short-term interest rate based on the CIR model Source: based on my own calculations, my editing
Figure 2 shows the average value relevant for the modelled short-term interest rates along with the 5% and 95% confidence levels. The pull-back towards the model average is visible on the development of the average.
14
2 2 Average for the short-term interest rate values modelled according to the CIR model; 5% and 95% confidence levels
Source: based on my own calculations, my editing
The yield curve may take up various forms depending on the initial value of the short-term interest rate, which is illustrated in Figure 3.
33 Potential forms of the yield curve with the various initial values of the short-term interest rate
Source: based on my own calculations, my editing
15
3 Results and evaluation
3.1 General framework
When compiling the model, I had to apply significant simplifications in respect of the composition of the examined loan portfolio. For the sake of simplicity, the loan portfolio consists of five elements, each representing a sub-portfolio. These sub-portfolios differ in terms of average interest rate level and residual maturity; their characteristics are summarised in Table 8.
88 Composition of the hypothetical loan portfolio
Sub-portfolios 1. 2. 3. 4. 5.
Principal ratio in the full portfolio
20% 20% 20% 20% 20%
Average interest rate level 4% 5% 6% 7% 8%
Average residual maturity (years)
10 5 6 7 4
In respect of the interest rate environment, I applied the following initial assumptions: the short-term interest rate is at 6% and it returns to a long-term 4% level. I apply the CIR model with the parameters included in Table 9.
99 Parameters of the CIR model – decreasing yield curve CIR parameters
r0 6%
a 0.5
b 4%
5%
16
The model’s logical framework can be summarised as follows:
1. Yield curve modelling. The short-term interest rate and the pertaining yield curve points are modelled based on the CIR model, for a period of 30 years, with monthly step sizes. The possible runs of the short-term interest rate are modelled with monthly step sizes (t=1/12) for the term of the residual maturity of the individual loan portfolio elements.
2. Defining the par yield curve. The par yield curves are defined for each yield curve. I used the par yield curves for the approximation of the current refinancing interest rates, assuming that the loans are priced fairly, and refinancing is available on the market at the par rate. In order to simplify the calculations, the par rates are not corrected with the loan portfolio’s individual risk since it basically only shifts the interest rate levels, it does not affect the refinancing decision-making mechanism. The model can be supplemented easily with this.
3. Defining the refinancing incentive. The refinancing incentive is defined based on the comparison of the par rate pertaining to the given residual maturity and the average interest rate level of the loan portfolio. The comparison continues until the simulated par rate falls below the value of the coupon but by the residual maturity at the latest. If the simulated par rate falls below the value of the coupon, using the optimal early repayment assumption, the early repayment takes place. I perform the calculations without taking the early repayment costs into account, assuming that early repayment can be made without limitation, and also with taking the early repayment cost into account. By taking the costs into account, it can be analysed to what extent costs can influence the optimal early repayment opportunity.
17
4. Defining the interest income impact. If the par rate falls below the value of the coupon and therefore the early repayment takes place, I assume that the repaid principal will be placed out again at the current interest rate i.e.
the par rate. The cash flows for the residual maturity are calculated based on the new interest rate, along with the difference between the original cash flows and the modified cash flows. I determine the cash flow impact both without discounting and with the discounted cash flows. The cash flow impact is for the examination of the impact of the income-based approach whose goal is to estimate the interest income impact. The goal of the discounted cash flow impact is to estimate the change of the asset value and to calculate, based on this, the economic capital value-based impact.
5. Defining results in the case of a stressed interest rate path. The calculations are repeated in a stressed interest rate environment also, for two reasons: 1. The above interest rate environment modelling assumes normality that is suitable in the case of normal course of business but in a crisis situation it is not suitable for simulating potential losses; in addition, 2. the definition of the economic capital value impact in a stressed interest rate environment is a legal requirement during the analysis of the interest rate risk. For the calculations I define the stressed interest rate path by shifting the yield curve in a parallel way, and I calculate the extent of this shift based on the 99%, one-year VaR value of the short-term HUF yields.
For lack of real banking data, the model does not cover the examination of the impact of non-optimal decisions. The impact of decisions deviating from the optimal distorts the impact of optimal decisions, for various reasons it can strengthen or weaken it. Decisions deviating from the optimal can be
18
estimated on real banking data, therefore, the assumed impact of these is not taken into account in the model since too many assumptions should be used for the incorporation of these, which would question the interpretability of the results.
I think this assumption does not weaken the applicability of the model. In connection with a structured analysis, I think it is a step forward that a “pure”
situation is analysed because we do not yet see the potential capital impact of this precisely, and the result of this may represent an initial situation for the analysis of the extent of the further distorting impacts. This is why I build up the modelling along the lines of the logic that first a purely optimal decision situation is analysed, then I modify it by inserting a cost factor, and a step could be taken further from here by inserting the individual distorting factors.
I think it can only be done if during the previous two steps the outcome is that the capital impact of the option risks can be significant, therefore, it is worth dealing with this issue. If as a first step, a more complex behaviour structure was modelled (which could only be done besides strong assumptions for lack of real data), the model would not provide an opportunity for analysing the impact of the individual elements separately (optimal and non-optimal decision situations).
The incorporation of behavioural factors can be approached from two sides from a modelling point of view. The one is that we seek the answer for the question as to what social-demographic and other factors explain the early repayment. Based on this, an early repayment behavioural scorecard can be built up, which may enable a bank to identify and evaluate portfolios that are more exposed to the risk of early repayment. A scorecard development cannot be performed based on assumptions, internal banking element data are definitely necessary for this. The other approach can be that we identify some
19
events that we consider other than optimal (e.g. early repayment from inheritance, property sales etc.), we estimate the extent of these and take it into consideration in addition to the optimal early repayment. The extent of this can be estimated based on historical data – from a modelling point of view, its extent is a percentage value that can be projected onto the whole portfolio.
3.2 Income-based approach
3.2.1 Without early repayment cost
Potential interest income impacts were defined for the hypothetical loan portfolios based on the above logic, with 10,000 simulations. Since I only examined early repayment, no new loan was placed out, so only the so-called downside risk i.e. the negative interest income impact was taken into account.
Accordingly, the results for the individual sub-portfolios show the extent of the potential interest income loss compared to the originally planned interest income, for the whole term. The calculations examined the cash flow impact without the discounting impact. The interest income impact was defined with the assumption that in the case of prefinancing, the prefinanced principal will be placed out at a lower interest rate for the residual maturity. Thus, the interest income impact is the difference between the original interest cash flows and the nominal value of the changed interest cash flows.
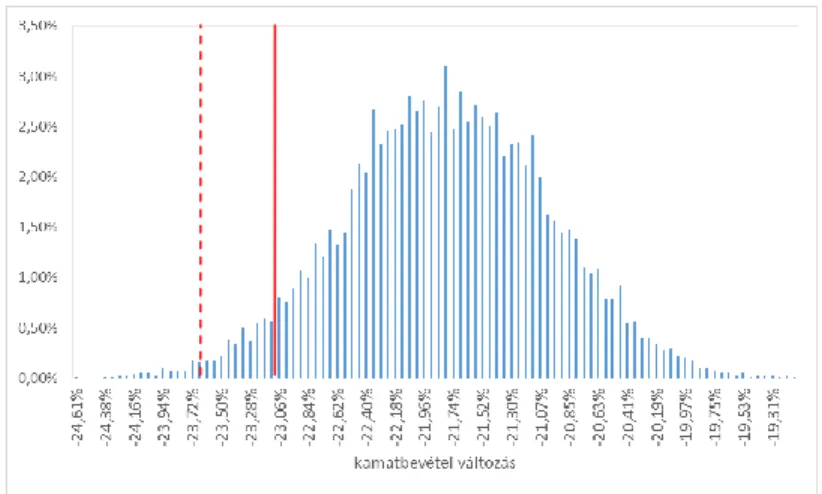
The collective interest income impact distribution of the individual loan portfolio elements is shown in Figure 4.
20
44 Distribution of the interest income impact defined based on the cash flow changes of the full loan portfolio (dashed line: 99% confidence level, continuous line: 95%
confidence level)
Source: based on my own calculations, my editing
Table 10 shows the most important statistics regarding the individual loan portfolio elements and the full loan portfolio impact.
1010 Statistics of the interest income impact – decreasing yield curve
Sub-portfolios 1. 2. 3. 4. 5. Full
impact
Coupon 4% 5% 6% 7% 8%
Residual term 10 5 6 7 4
Average -0.87% -5.61% -22.84% -34.90% -39.44% -21.81%
Deviation 0.77% 2.60% 1.96% 1.51% 1.99% 0.78%
95% confidence level -2.40% -9.97% -26.05% -37.37% -42.67% -23.10%
99% confidence level -3.36% -11.82% -27.39% -38.36% -44.08% -23.62%
Source: based on my own calculations, my editing
The interest rate level of the examined sub-portfolios and the current interest rate environment and the assumption with regard to its change affect the results significantly. As a result of the assumed decreasing interest rate environment impact, the early repayment opportunity had a significant
21
impact in the case of sub-portfolios 3-5. In the case of these sub-portfolios, the impacts were concentrated in the first 12 months, thus the interest income impact was significant within the year.
If we examine the interest income impact for the first 12 months only i.e. we compare the extent of the interest income potentially lost in the first year along the lines of the individual interest rate paths to the interest income expected in the first year, the statistics will change according to Table 11.
1111 Statistics of the interest income impact – decreasing yield curve, impact within one year
Sub-portfolios 1. 2. 3. 4. 5. Full
impact
Coupon 4% 5% 6% 7% 8%
Residual term 10 5 6 7 4
Average -2.66% -21.31% -35.71% -45.70% -49.50% -34.91%
Deviation 6.14% 2.26% 1.58% 1.24% 1.63% 1.04%
95% confidence level -16.85% -24.97% -38.28% -47.70% -52.10% -37.02%
99% confidence level -17.25% -26.61% -39.28% -48.44% -53.09% -37.77%
Source: based on my own calculations, my editing
The short-term impact shows up more strongly. The result arrived at this way is a potential maximum since I assumed an optimal decision-making mechanism and did not calculate with the costs of early repayment and the transactions. Based on this, assuming a decreasing interest rate environment, at a 95% confidence level, one third of the planned one-year interest income is potentially endangered on the hypothetical portfolio. The interest income impact is much lower than that since the fall of the interest rates shows up in the decrease of the funding costs, thus the net impact should be much more favourable than the theoretical maximum defined for the interest income.
22
Changing the assumptions on the interest rate environment makes a significant impact on the results. I have also performed the calculations assuming an increasing interest rate environment, with the parameters included in Table 12.
1212 Parameters of the CIR model – increasing yield curve CIR parameters
r0 5%
a 0.5
b 7%
5%
Besides these settings, the total impact of the results calculated for the full loan portfolio will be according to Figure 5. Table 13 shows the most important statistics regarding the individual loan portfolio elements and the full loan portfolio impact. In the case of an increasing interest rate environment, the impact of the early repayment opportunity is much weaker on the interest income levels.
1313 Statistics of the interest income impact – increasing yield curve
Sub-portfolios 1. 2. 3. 4. 5. Full
impact
Coupon 4% 5% 6% 7% 8%
Residual term 10 5 6 7 4
Average 0.00% -0.06% -0.52% -8.66% -23.47% -6.57%
Deviation 0.03% 0.23% 0.70% 1.38% 1.84% 0.51%
95% confidence level 0.00% -0.43% -1.90% -10.96% -26.34% -7.46%
99% confidence level -0.01% -1.12% -3.20% -11.78% -27.93% -7.83%
Source: based on my own calculations, my editing
23
While examining the interest income impact for the first 12 months i.e. we compare the extent of the interest income potentially lost in the first year along the lines of the individual interest rate paths to the interest income expected in the first year, the statistics will change (Table 14).
55 Distribution of the interest income impact defined based on the cash flow changes of the full loan portfolio (dashed line: 99% confidence level, continuous line: 95%
confidence level)
Source: based on my own calculations, my editing
1414 Statistics of the interest income impact – increasing yield curve, short-term impact
Sub-portfolios 1. 2. 3. 4. 5. Full
impact
Coupon 4% 5% 6% 7% 8%
Residual term 10 5 6 7 4
Average 0.00% 0.00% -2.89% -23.92% -36.08% -15.78%
Deviation 0.00% 0.00% 6.37% 1.22% 1.47% 1.35%
95% confidence level 0.00% 0.00% -17.01% -26.04% -38.53% -18.85%
99% confidence level 0.00% 0.00% -17.51% -26.73% -39.44% -19.28%
Source: based on my own calculations, my editing
In the case of an increasing interest rate path, the potentially endangered interest income, assuming a 95% confidence level, is nearly one fifth of the
24
annual interest income i.e. the impact is still significant when the assumptions made on the interest rate environment theoretically are not in favour of early repayment. The extent and nature of the impact is basically affected by the composition of the examined loan portfolio since the impact showed up in the case of sub-portfolios with high coupons, in the case of which early repayment still makes sense, assuming increasing interest rates where such rates started from a low level compared to the coupon. Naturally, the results arrived at this way can be considered as the potential maximum even in this case.
3.2.2 With early repayment cost
I have performed the calculations with the incorporation of the costs of early repayment. In respect of the cost of early repayment I assumed that a 2%
fixed fee is payable in the case of early repayment. The cost of early repayment affects cash flows through the refinancing incentive. According to it, refinancing has taken place in the model if the par rate pertaining to the given residual maturity and the amount of the annualised value of the early repayment fee distributed for the residual maturity were even collectively lower than the coupon. In certain cases the incorporation of the early repayment fee diverts the refinancing decision made merely on the basis of the par rate level since refinancing is not worth any more if the fee is taken into account. I summarise the model results calculated in light of the fee in Table 15.
1515 Statistics of the interest income impact – decreasing yield curve with early repayment cost
25
Sub-portfolios 1. 2. 3. 4. 5. Full
impact
Coupon 4% 5% 6% 7% 8%
Residual term 10 5 6 7 4
Average -3.32% -8.93% -22.86% -34.84% -39.37% -22.78%
Deviation 2.88% 2.75% 1.90% 1.50% 2.00% 0.99%
95% confidence level -6.55% -12.27% -25.94% -37.23% -42.65% -24.25%
99% confidence level -7.73% -13.79% -27.14% -38.14% -44.03% -24.67%
Source: based on my own calculations, my editing
The implementation of the early repayment fee further deteriorates the interest income impact (comparing the impact to the interest income available during the whole term). The reason for this is that due to the fee, early repayment takes place fewer times but when the loan is refinanced according to the model, on average it takes place at an interest rate that is lower than that in the case when there was no early repayment fee in the model.
3.3 Capital value-based approach
In the case of a capital value-based approach, the goal, due to the interest rate change, is to define the change in the economic capital value. Changes in the value of assets and liabilities would also have to be defined and the difference of these would give the change and the distribution of the economic capital value. During the simulations I examined the changes of the discounted cash flows of the loan portfolio, the simulation of the liabilities side was not taken into account, thus the value change in the loan portfolio will ceteris paribus be felt in the change of the economic capital value. The change in the economic capital value was defined as the quotient of the changes in the discounted cash flows and the original capital value.
26
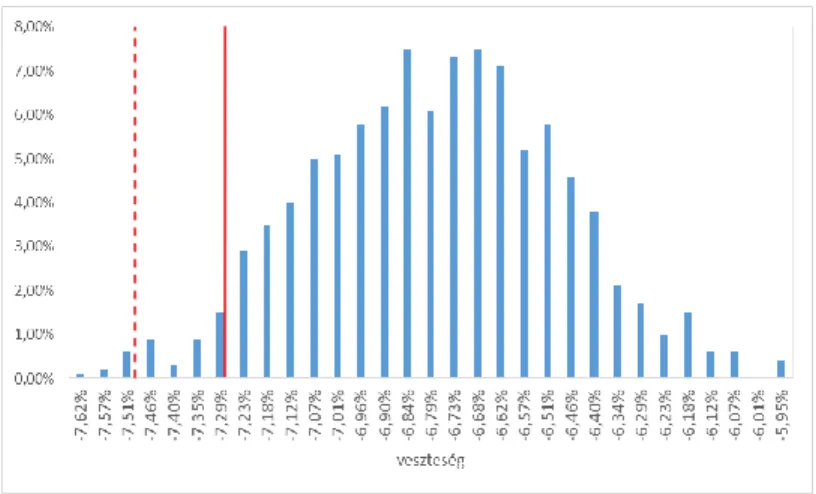
I have performed the calculations assuming both a decreasing and an increasing interest rate environment. Figure 6 illustrates the economic capital value impact projected onto the whole loan portfolio in the case of a decreasing interest rate environment.
66 Distribution of the economic capital value impact defined based on the discounted cash flow changes of the full loan portfolio (dashed line: 99% confidence level, continuous line: 95% confidence level)
Source: based on my own calculations, my editing
Table 16 shows the most important statistics regarding the individual loan portfolio elements and the full loan portfolio impact. In the case of the discounted cash flow impact, the results are lower than in the case of the interest income impact, which can be explained with the fact of the discounting. If we wish to spend the results on capital requirement, then these results are available for this purpose.
27
1616 Statistics of the economic capital value-based impact – decreasing yield curve
Sub-portfolios 1. 2. 3. 4. 5. Full
impact
Coupon 4% 5% 6% 7% 8%
Residual term 10 5 6 7 4
Average -0.27% -1.23% -7.03% -14.30% -11.18% -6.80%
Deviation 0.24% 0.55% 0.61% 0.68% 0.57% 0.30%
95% confidence level -0.75% -2.15% -8.04% -15.42% -12.12% -7.28%
99% confidence level -1.00% -2.49% -8.43% -15.84% -12.49% -7.49%
Source: based on my own calculations, my editing
Projected onto the whole loan portfolio, at a 95% confidence level, the market value of assets may potentially decrease by 7.28% which, ignoring the value change of liabilities, will be felt in the change of the capital’s market value and thus in the change of the economic capital’s value. As a result of this, the capital requirement of the hypothetical loan portfolio is 7.28% for the whole exposure due to the early repayment option characteristic of the interest rate risk in the banking book, at a 95%
confidence level.
In the case of an increasing interest rate environment, the distribution is shown in Figure 7. Table 17 shows the most important statistics regarding the individual loan portfolio elements and the full loan portfolio impact.
1717 Statistics of the economic capital value-based impact – increasing yield curve
Sub-portfolios 1. 2. 3. 4. 5. Full
impact
Coupon 4% 5% 6% 7% 8%
Residual term 10 5 6 7 4
Average 0.00% -0.01% -0.14% -3.42% -6.52% -2.02%
Deviation 0.01% 0.04% 0.20% 0.56% 0.52% 0.15%
95% confidence level 0.00% -0.07% -0.56% -4.33% -7.39% -2.28%
99% confidence level 0.00% -0.21% -0.88% -4.70% -7.71% -2.38%
Source: based on my own calculations, my editing
28
77 Distribution of the economic capital value impact defined based on the discounted cash flow changes of the full loan portfolio (dashed line: 99% confidence level, continuous line: 95% confidence level)
Source: based on my own calculations, my editing
3.4 Application of a stress interest rate environment
The application of interest rate shocks to evaluate the extent of the interest rate risk exposure appears as a special goal in the guidelines on the management of interest rate risk in the banking book which was issued by the EBA (European Banking Authority) in May 20154 and which revised the guidelines phrased by the former CEBS (Committee of European Banking Supervisors). According to the guidelines, the institutions shall assess the sensitivity of the economic capital value and the net interest income to the potential changes of the yield curve, including parallel shifting, along with shape changes. In addition, they have to assess the impact of the interest rate shock of the extent required by the regulatory authority projected onto the economic capital value. Extent of the regulatory interest rate shock: the
4 EBA/GL/2015/08, Guidelines on the management of interest rate risk arising from non- trading activities
29
parallel, sudden shift of the yield curve by +/-200 basis points, if it is lower than the change currently observed in the interest rate levels, the 99% VaR value5 of the daily changes in interest rates have to be taken as a basis for the calculations.
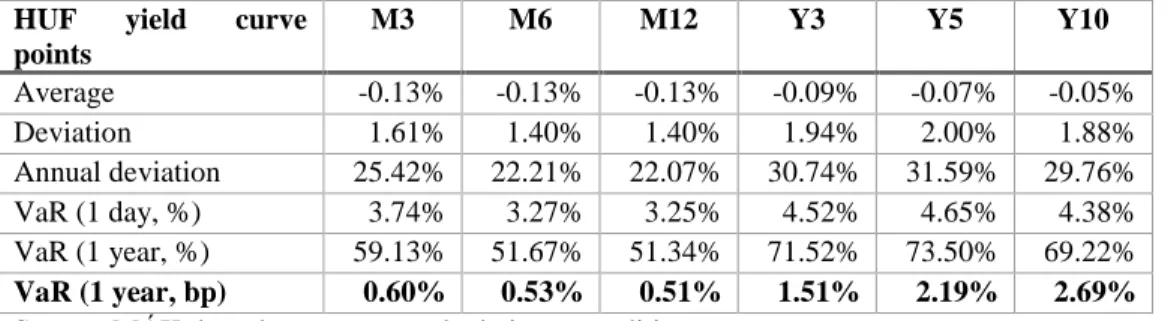
Table 18 includes the statistics calculated for the highlighted points of the HUF yield curve, specifically with the one-year VaR value at 99%
confidence level, expressed in basis points. I determined the value of the interest rate stress shift applied for the hypothetical portfolios from the one- year VaR values defined based on the 5-year data series pertaining to the 3- month HUF yield curve point (as the approximation of the short-term interest rate). It is shown in Table 19.
1818 VaR values of the highlighted points of the HUF yield curve HUF yield curve
points
M3 M6 M12 Y3 Y5 Y10
Average -0.13% -0.13% -0.13% -0.09% -0.07% -0.05%
Deviation 1.61% 1.40% 1.40% 1.94% 2.00% 1.88%
Annual deviation 25.42% 22.21% 22.07% 30.74% 31.59% 29.76%
VaR (1 day, %) 3.74% 3.27% 3.25% 4.52% 4.65% 4.38%
VaR (1 year, %) 59.13% 51.67% 51.34% 71.52% 73.50% 69.22%
VaR (1 year, bp) 0.60% 0.53% 0.51% 1.51% 2.19% 2.69%
Source: MÁK, based on my own calculation, my editing
19Interest rate stress scenarios in the modelling
Stress scenarios Decreasing yield curve Increasing yield curve
r0 6% 5%
b 4% 7%
VaR (1 year, bp) 3.55% 2.96%
Source: based on my own calculations, my editing
5 99th percentile of the daily interest rate changes calculated backwards for a period of 5 years, annualised
30
Assuming a decreasing interest rate environment, I examined the impact of the shift on the stress side with the 355 bp parallel downward and upward shift of the simulated yield curves. Assuming the downward shift of the yield curve, the income impact is significant in all sub-portfolios, the impact is nearly fourfold projected onto the whole portfolio compared to the results of the non-stress interest rate environment. The impact that is significant in the case of the sub-portfolios is also justified by the sudden change of the interest rate environment: from the 6% level applied in the model, the interest rate level suddenly falls below 4%, which increases the occurrence of early repayments in case of each sub-portfolio. In the case of the upward shift of the yield curve, willingness for early repayment decreases significantly, thus its impact is much lower compared to the non-stress environment. The downward shifting of the decreasing yield curve can be considered as a real stress scenario. The economic capital value-based impact produces a fourfold result compared to the non-stress environment.
Assuming an increasing interest rate environment, I examined the impact of the shift on the stress side with the 296 bp parallel downward and upward shift of the simulated yield curves. The downward shift of the yield curve, similar to the results received in a decreasing interest rate environment, is more than fivefold of the results observed in a non-stress interest rate environment. Compared to the stress results applied in a decreasing interest rate environment, the results received are half of them. The rise of the yield curve does not cause any significant stress scenarios, either. The trend is similar in the case of the economic capital value-based results: when the yield curve decreases, we receive six times greater potential losses compared to the non-stress interest rate environment.
31
4 Conclusions
Based on the model results, I evaluate the preliminary hypotheses as follows.
1. Hypothesis: The early repayment option makes a significant impact on the level of the economic capital.
Statement
My basic assumption is that the early repayment option may make a significant impact on the bank’s profitability and thus, the level of the economic capital. I assume that the extent of the impact of the early repayment option depends, on the one hand, on the general interest rate environment and the interest rate expectations; the differences between the interest rate structure of the bank’s balance sheet and the interest rate environment i.e. the early repayment incentive’s extent that can be assumed on the bank’s portfolio; the discretional risk composition of the bank’s portfolio and the behavioural patterns of the individual debtors; the regulation that may either support or complicate the exercising of the early repayment right; and the market structure, more precisely, the application of the agency sales channels.
Evaluation
The model examines the impact of the optimal early repayment option on the cash flows of the bank’s portfolio and the value of the economic capital.
Based on the results of the model, it can be declared clearly that depending
32
on the banking portfolio’s composition (interest rate level, maturity), the early repayment option can make a significant impact on the amount of both the short-term (i.e. one-year) interest income and the discounted value of the banking portfolio, and consequently, the value of the economic capital, through the change of the cash flows. The results are greatly influenced by the connection between the interest rate composition of the portfolio (coupon levels) and the changes in the interest rate environment (decreasing/increasing yield curve). In the case of a decreasing yield curve, the impact is stronger, while in the case of an increasing yield curve, the impact of the refinancing incentive is also valid but its extent is less robust.
The examination of the individual debtor behaviour patterns were not built into the model since it can only be performed based on real banking data.
The inclusion of the early repayment cost in the model shifts the results into an interesting direction since it results in an interest income impact that is stronger than the version without costs. Intuitively, we would think about the cost element that it significantly limits the application of the early repayment option and thus it decreases the impact thereof. A conclusion that can be drawn based on the results is that the cost level set in the model was too low to undo several optimal decisions in order for the decrease in the number of events to compensate for the impact of redemption at a lower interest rate on the interest income. However, the applied cost level cannot be much higher than the fair price that is the cost implication of the internal banking administrative processes related to early repayment, which does not compensate for even a fraction of the lost interest income.
The differences between the sales channels and their differing incentive mechanisms were not taken into account in the model, thus based on the model I cannot draw conclusions on the impact of these on early repayment.
33
The application of the agency sales channel may bring a strong distorting impact into the system since it does not necessarily support an optimal decision for the client and builds in an additional cost element that shows up at the client partially but may have a significant portfolio impact on the result side.
2. Hypothesis: The methodology quantifying the capital impact represents a better approach for the determination of the economic capital impact than the income-based methodology.
Statement
Basically there are two types of methodologies for the quantification of interest rate risk in the banking book: the approach quantifying the income impact which puts the short-term impact on the bank’s interest rate result into the forefront, and the approach quantifying the capital impact whose goal is define the impact projected onto the capital’s present value. I assume that the approach quantifying the capital impact is more appropriate to define the economic capital impact, primarily because the quantified impacts have to be channelled into the banks’ capital management and these decisions are for the long term. The income-based impact has to be felt in capital value through the change of the interest rate profit but because this approach is for the short term, it is more suitable as a tool for the management of the income base.
Due to its long-term approach, the methodology quantifying the capital impact enables dynamic modelling and, through this, the taking of long-term capital management criteria into account.
34
Evaluation
Based on the results of the model it can be said that depending on the assumption affecting the interest rate environment, the interest impact can be very significant on the interest income expected both in the short term and over the whole term. For the purposes of the income impact, I do not take the dynamic change of the balance sheet into account i.e. the impact of the fact that even multiple early repayments may occur, the portfolio may be repriced, the volumes may increase, therefore, the received results are only suitable for showing the short-term impact of the optimal early repayment which indicates the short-term interest income impact, defining a potential maximum. Since the income impact does not take into account the time value of money, therefore, this method is not suitable for the quantification of long- term impacts but it is a suitable tool for managing short-term revenues.
The change in the capital value is derived in the model as the result of the change in the present value of cash flows. This approach makes the quantification of long-term impacts possible since it defines a theoretical bond price along with the changes in it. Methodologically, this approach fits into the definition logic of the capital requirement, which can serve as a basis for long-term capital management decisions.
35
3. Hypothesis: The factors that influence the impact of the early repayment option on the level of economic capital can be identified easily.
Statement
Projecting the calculations onto a hypothetical portfolio, I perform calculations in respect of the model-based quantification of the early repayment impact and, based on the model’s results, I perform additional sensitivity tests to assess the change of which parameters makes the most impact on the result of the economic capital model quantifying the capital impact. These variables can be factors relevant for the portfolio’s composition and external environmental factors.
Evaluation
I prepared the model calculations based on two types of interest rate environment: besides a decreasing and an increasing yield curve. As for the composition of the portfolio, the individual sub-portfolios are included in the loan portfolio with equal weights in terms of capital value.
In the case of a decreasing yield curve, the interest income impact is stronger while in the case of an increasing yield curve, the impact of the refinancing incentive is also valid but its extent is less strong. The effects on the individual sub-portfolio elements are different. The interest income impact grows with the increase of the coupon, in the case of both decreasing and increasing yield curves.
The composition impact was not built into the model separately, it would change the result in a linear way with the modification of the ratios. This
36
factor would make sense if the correlations between the individual sub- portfolios would be modelled, which could be incorporated into the model with the correlation of the random figures used for the simulation.
37
5 New and novel scientific results
The dissertation evaluates the impact of the loan early repayment event related to the interest rate risk in the banking book on the banking income and the economic capital value. It is accepted in international regulation that the institutions apply the so-called dual approach for the interest rate risk in the banking book i.e. upon the evaluation and management of the risk, the (mainly short-term) income impact and the economic capital value impact are taken into account. The dissertation brings novelty by examining the impact of the early repayment opportunity and its potential extent along the lines of two dimensions, which we have not found in earlier literature.
The results of the dissertation support the idea that early repayment may make a significant impact on both the banking income and the capital value, therefore, it has to be managed on the side of risk management. The results support even the dual approach since according to the results received during the calculations, the cash flow impact is the strongest within one year, and accordingly, risk management based on the income impact is valid in the daily risk management. The economic capital value approach, in line with the latest regulatory approach, is suitable for the comparison of the portfolios operating in various economic environments i.e. it can serve as an input necessary for making of capital allocation decisions.