Research Article
Association of PPAR Alpha Intron 7 G/C,
PPAR Gamma 2 Pro12Ala, and C161T Polymorphisms with Serum Fetuin-A Concentrations
Bernadett Márkus,
1Krisztián Vörös,
1Dorina Supák,
2Zsolt Melczer,
2Károly Cseh,
3and László Kalabay
11Department of Family Medicine, Semmelweis University, Budapest, Hungary
22nd Department of Obstetrics and Gynecology, Semmelweis University, Budapest, Hungary
3Institute of Public Health, Semmelweis University, Budapest, Hungary
Correspondence should be addressed to L´aszl´o Kalabay; kalabay.laszlo@med.semmelweis-univ.hu Received 3 March 2017; Revised 24 May 2017; Accepted 6 June 2017; Published 11 July 2017 Academic Editor: Marcin Baranowski
Copyright © 2017 Bernadett M´arkus et al. This is an open access article distributed under the Creative Commons Attribution License, which permits unrestricted use, distribution, and reproduction in any medium, provided the original work is properly cited.
Background. Both peroxisome activator proteins (PPARs) and fetuin-A play a role in lipid and glucose metabolism.Aims. We investigated whether PPAR𝛼intron 7 G2468/C and PPAR𝛾2 Pro12Ala and PPAR𝛾exon 6 C161T polymorphisms are associated with serum fetuin-A concentrations.Patients and Methods. The PPAR𝛼intron 7 G/C polymorphism was studied in cohort 1 (79 reference individuals, 165 postinfarction patients). The two PPAR𝛾polymorphisms were investigated in cohort 2 (162 reference individuals, 165 postinfarction patients). Fetuin-A levels and PPAR polymorphisms were determined by radial immunodiffusion and polymerase chain reaction-restriction fragment length polymorphism techniques.Results. The C allele variant of PPAR𝛼intron 7 G2467C was associated with higher fetuin-A levels(𝑝 = 0.018). Postinfarction status(𝑝 = 0.001), PPAR𝛼intron 7 GG/GC/CC genotypes(𝑝 = 0.032), and the C allele(𝑝 = 0.021)were the strongest determinants of fetuin-A concentration in a multiple regression model. Higher fetuin-A levels were associated with the Pro variant of PPAR𝛾2(𝑝 = 0.047). Postinfarction status(𝑝 = 0.041)and BMI(𝑝 < 0.001)but not PPAR𝛾2 Pro were the strongest determinants of fetuin-A concentrations. PPAR𝛾exon 6 C161T genotypes were not associated with fetuin-A levels.Conclusions. Fetuin-A was determined mainly by the PPAR𝛼intron 7C allele and postinfarction status in cohort 1 and the BMI and postinfarction in cohort 2. The PPAR𝛼intron 7C and PPAR𝛾2 Pro variants are associated with fetuin-A levels.
1. Introduction
Human fetuin-A is a multifunctional hepatic glycoprotein that has been involved in the development of obesity [1–
3], insulin resistance [4], metabolic syndrome [1, 5], type 2 diabetes [6–8], adipocyte dysfunction [9], and fatty liver [4].
Peroxisome proliferator-activated receptors (PPARs) are members of the nuclear hormone receptor superfamily of ligand-activated transcription factors. The PPAR subgroups PPAR𝛼, PPAR𝛽/𝛿, and PPAR𝛾(𝛾1 and𝛾2) play an important role in the pathogenesis of these processes, which has been extensively reviewed [10–12].
There are several observations suggesting a relationship between serum fetuin-A levels and activities of different
PPARs. For example, the direct inhibitory effect of pioglita- zone on hepatic fetuin-A expression has been observed in rats [13] and in humans [14]; the former was reversed by GW9602, direct PPAR𝛾inhibitor.
Polymorphisms of PPAR𝛾 and PPAR𝛼 have also been described and found to be associated with disorders of hyperlipidemia, glucose homeostasis, and diabetes. Thus the C allele of the PPAR𝛼intron 7 polymorphism was found to be more frequent in patients with myocardial infarction and dyslipidemia [15]. The T allele of the PPAR𝛾exon 6 C161T polymorphism was supposed to have protective role against coronary artery disease in Chinese population [16], whereas others found that this allele was associated with an increased
Volume 2017, Article ID 7636019, 8 pages https://doi.org/10.1155/2017/7636019
risk for coronary heart disease [12]. The association between polymorphic variants of PPAR and serum fetuin-A levels, however, has not been investigated yet.
In our study, we aimed to investigate whether polymor- phisms of PPAR𝛾(PPAR𝛾2 Pro12Ala and exon 6 C161T) and PPAR𝛼(intron 7 G2467C) are associated with or may affect serum fetuin-A levels in two cohorts.
2. Patients and Methods
Three-hundred and forty-two patients were originally involved in this study. Exclusion criteria were as follows:
clinical or laboratory signs of acute vascular disease (myocardial infarction, stroke), acute infection, malignant tumor, hepatic disease, renal failure, immune suppression, severe medical or surgical conditions, and trauma. Finally, we had 327 patients (cohort 2) who had all comparable data (including successful genotyping for both PPAR𝛾 polymorphisms). We were able to perform successful PPAR𝛼 genotyping in a smaller number of patients (cohort 1, 𝑛 = 244). The genotyping success rate was greater than 99%
in both cohorts. The genotypes were in the Hardy-Weinberg equilibrium.
PPAR𝛼 polymorphism was studied in cohort 1. This cohort comprised 244 individuals (120 men and 124 women, age: 60.1± 11.2 years, mean ± SD). Cohort 1 consisted of 79 reference individuals (15 men, 64 women, age: 61.0±9.4 years) and 165 patients surviving myocardial infarction (105 men, 60 women, age: 59.6±12.2 years).
PPAR𝛾 polymorphisms were studied in cohort 2. This cohort consisted of 327 individuals (161 men, 166 women, age: 57.9±13.0 years). This cohort consisted of 162 reference subjects (61 men, 101 women, age: 56.1±13.8 years) and the same 165 postinfarction patients as in cohort 1 (105 men, 60 women, age: 59.6±12.2 years).
Postinfarction patients had a history of STEMI myocar- dial infarction (6–24 months prior to the start of the study).
Diabetes was diagnosed based on fasting plasma glucose>
7.0 mmol/l or the 2-hr OGTT >11.1 mmol/l. Patients with diabetes were treated with diet, metformin, and bedtime insulin.
All persons gave their informed consent prior to their inclusion in the study. The study was approved by the local Ethics Committee of the K´arolyi S´andor Municipality Hospital.
2.1. Determination of PPAR Polymorphic Variants. The deter- mination of the PPAR𝛾and PPAR𝛼variants was performed by PCR-RFLP technique.
The PPAR𝛼G2467C intron 7 polymorphism (rs 4253778) was studied by PCR-RFLP technique, using a 5 forward primer of ACA ATC ACT CCT TAA ATA TGG TGG and a 3 reverse primer of AAG TAG GGA CAG ACA GGA CCA GTA. The PCR product was digested with Taq1 (New England Biolabs, Boston, MA, USA) resulting in one fragment of 266 bp of the carriers of the wild-type allele and two fragments of 216 and 50 bp in the carriers of the mutant allele (thermocycles 94∘C 15 min, 30 × 94∘C 30 sec, 50∘C 20 sec, and 72∘C 30 sec) [17].
For PPAR𝛾Pro12Ala (rs 1801282) polymorphism, we used a 5forward primer of GCC AAT TCA AGC CCA GTC and a mutagenic 3reverse primer of GAT ATG TTT GCA GAC AGT GTA TCA GTG AAG GAA TCG CTT TCC G. The PCR product was digested with Bst U1 enzyme (New England Biolabs, Boston, MA, USA) resulting in one fragment of 270 bp in the carriers of wild-type and two fragments of 227 and 43 bp in carriers of mutant allele (thermocycles 95∘C 15 min, 35×94∘C 30 sec, 65∘C 45 sec, and 72∘C 1 min) [18].
The exon 6 polymorphism C161T of PPAR𝛾(rs 3856806) was investigated by PCR-RFLP technique using a 5forward primer of CAA GAC AAC CTG CTA CAA GC and a 3 reverse primer of TCC TTG TAG ATC TCC TGC AG. The PCR product was digested with Pml1 enzyme (New England Biolabs, Boston, MA, USA) resulting in two fragments of 120 and 80 bp in carriers of the wild-type allele and only one fragment of 200 bp in the carriers of the mutant allele (thermocycles 94∘C 15 min, 30×94∘C 30 sec, 56∘C 30 sec, and 72∘C 30 sec) [19].
2.2. Determination of Serum Fetuin-A Concentration. Serum fetuin-A concentrations were determined by radial immun- odiffusion using the commercially available product (anti- fetuin-A, IgG fraction, Incstar, cat. number 81931, 13.7 mg/ml, in a final concentration of 84𝜇l/11.5 ml gel), as previously described [20].
2.3. Determination of Insulin Resistance Parameters. Plasma glucose and insulin were determined by the routine HK- G6P-DH and ELCIA methods, respectively. The Homeostasis Model Assessment-Insulin Resistance (HOMA-IR) model was calculated according to Matthews et al. [21].
2.4. Statistical Analysis. Statistical analysis was carried out using the SPSS v.21 statistical software (SPSS Inc., Chicago, IL, USA). Nonparametric methods, including the Bonferroni (Dunn) post hoc test, were used. 𝑝 values < 0.05 were considered as significant.
3. Results
3.1. Subject Characteristics. The characteristics of the study participants are shown in Table 1.
Sixty-five per cent of the postinfarction patients received statins and 70% of them aspirin. Serum fetuin-A concentra- tions did not differ statistically between patients treated and not treated with these two medications (687±122 versus 636
±81 mg/l,𝑝 = 0.204for statins and 665±0.120 versus 672± 124 mg/l,𝑝 = 0.795for aspirin, resp.).
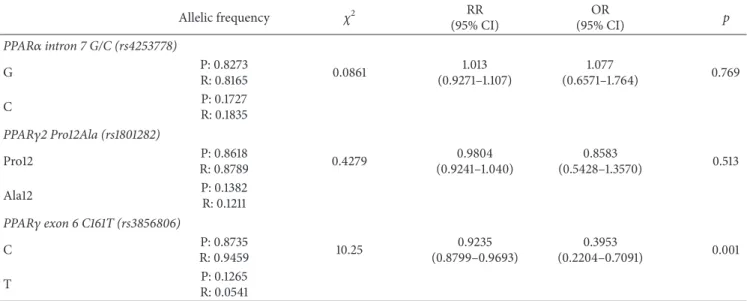
3.2. PPAR𝛼 Intron 7 G/C, PPAR𝛾2 Pro12Ala, and PPAR𝛾 Exon 6 C161T Allele Distribution in Postinfarction Patients and Reference Individuals. The distribution of PPAR𝛾and PPAR𝛼 alleles is shown in Table 2. PPAR𝛾 Pro12Ala and PPAR𝛼 intron 7 G/C alleles did not differ significantly between postinfarction patients and reference subjects. Postinfarction patients, however, had a significantly higher T allele fre- quency of the PPAR𝛾C161T compared to reference subjects.
Table 1: Subject characteristics.
Cohort 1
(𝑛 = 244) Cohort 2
(𝑛 = 327) Reference individuals
(𝑛 = 79) Postinfarction patients
(𝑛 = 165) Reference individuals
(𝑛 = 162) Postinfarction patients (𝑛 = 165)
Gender (male/female) 15/64 105/60 61/101 105/60
Age (years, mean±SD) 61.0±9.4 59.6±12.2 56.1±13.8 59.6±12.2
BMI (kg/m2) 24.1±1.6 28.1 ± 4.2∗∗ 27.4±0.4 28.1 ± 4.2∗
Obesity (no/yes) 68/11 46/119∗∗ 78/84 46/119∗∗
Diabetes status (no/yes) 79/0 112/53∗∗ 139/23 112/53∗∗
HOMA-IR 1.0±0.2 6.2 ± 4.6∗∗ 1.5±1.5 6.1 ± 4.6∗∗
∗𝑝 < 0.01and∗∗𝑝 < 0.001, compared to reference individuals; BMI: body mass index; HOMA-IR: Homeostasis Model Assessment-Insulin Resistance;
Mann–Whitney test.
Table 2: The PPAR𝛼intron 7 G/C, PPAR𝛾2 Pro12Ala, and PPAR𝛾exon 6 C161T allele distribution among postinfarction patients and reference individuals.
Allelic frequency 𝜒2 RR
(95% CI)
OR
(95% CI) 𝑝
PPAR𝛼intron 7 G/C (rs4253778)
G P: 0.8273
R: 0.8165 0.0861 1.013
(0.9271–1.107)
1.077
(0.6571–1.764) 0.769
C P: 0.1727
R: 0.1835 PPAR𝛾2 Pro12Ala (rs1801282)
Pro12 P: 0.8618
R: 0.8789 0.4279 0.9804
(0.9241–1.040)
0.8583
(0.5428–1.3570) 0.513
Ala12 P: 0.1382
R: 0.1211 PPAR𝛾exon 6 C161T (rs3856806)
C P: 0.8735
R: 0.9459 10.25 0.9235
(0.8799–0.9693)
0.3953
(0.2204–0.7091) 0.001
T P: 0.1265
R: 0.0541 P: postinfarction patients; R: reference subjects;𝑝:𝜒2test.
3.3. Analysis of Association between PPAR𝛼Intron 7 G2467C Variants and Serum Fetuin-A Concentrations. Serum fetuin- A levels of individuals with the CC genotype were higher than those of GG genotype (Table 3). In the dominant model (C versus non-C nucleotide), individuals with the minor variant C allele had significantly higher serum fetuin- A concentrations than those with the non-C. In a recessive model (G versus non-G nucleotide), there was no difference between the two variants (651±107 mg/l,𝑛 = 238versus 662
±171 mg/l,𝑛 = 6,𝑝 = 0.702).
Except for age, serum fetuin-A concentrations showed significant correlations with parameters listed in Table 4.
Serum fetuin-A levels associated weakly but significantly with PPAR𝛼intron 7 GG/GC/CC genotypes and the C allele but not with the G allele. During partial correlation analysis, however, the correlation between fetuin-A concentrations and PPAR𝛼intron 7 GG/GC/CC genotype lost significance when corrected for BMI (𝑟 = 0.100,𝑝 = 0.125), diabetes status (𝑟 = 0.108, 𝑝 = 0.092), HOMA-IR (𝑟 = 0.116,
𝑝 = 0.072), and postinfarction status (𝑟 = 0.122, 𝑝 = 0.058). Correlation between fetuin-A levels and the PPAR𝛼 intron 7C allele also became insignificant when corrected for BMI (𝑟 = 0.107,𝑝 = 0.095), diabetes status (𝑟 = 0.115, 𝑝 = 0.072), and HOMA-IR (𝑟 = 0.123, 𝑝 = 0.056) but remained significant after correction for postinfarction status (𝑟 = 0.131,𝑝 = 0.041).
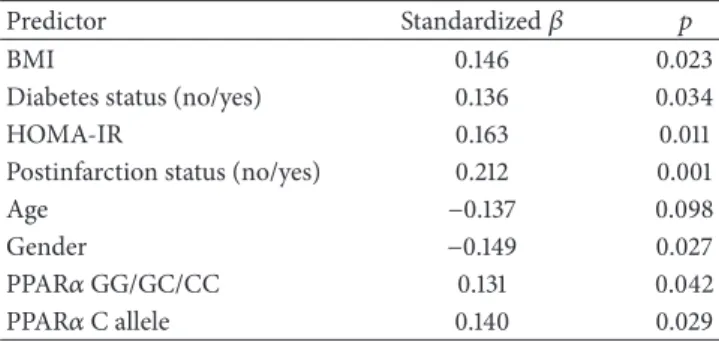
The results of the univariate linear regression analy- sis between independent variables (predictors) and serum fetuin-A concentration (dependent variable) are shown in Table 5. Serum fetuin-A levels showed weak but statistically significant data with all investigated potential predictors, including PPAR𝛼intron 7 G/C genotypes and the C allele but not with age. Thus age was excluded from further analysis.
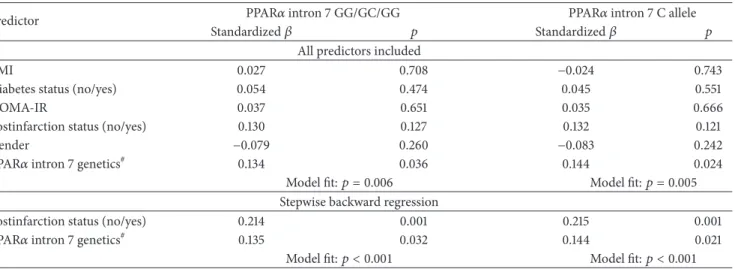
Next we investigated whether PPAR𝛼 intron 7 G/C genotype and the C allele may determine serum fetuin- A concentration in a multiple regression model (Table 6).
In the model containing all independent parameters, we investigated the PPAR𝛼 intron 7 GG/GC/CC genotype and
Table 3: Serum fetuin-A concentrations in individuals with different PPAR𝛼intron 7 G2467C SNP polymorphisms and alleles.
(a) PPAR𝛼intron 7 G2467C polymorphisms
GG GC CC 𝑝
Fetuin-A mg/l 𝑛 Fetuin-A mg/l 𝑛 Fetuin-A mg/l 𝑛
641±150 164 671±110 74 662±170 6 0.040#
(b) PPAR𝛼intron 7 G2467C alleles
C allele non-C 𝑝
Fetuin-A mg/l 𝑛 Fetuin-A mg/l 𝑛
670±114 80 641±105 164 0.018§
#Kruskal-Wallis test;§Mann–Whitney test.
Table 4: Correlation between serum fetuin-A and investigated parameters(𝑛 = 244).
Parameter Correlation coefficient 𝑝
BMI 0.167 0.009
Diabetes status (no/yes) 0.133 0.038
HOMA-IR 0.205 0.001
Age −0.109 0.188
Gender −0.168 0.017
Postinfarction status (no/yes) 0.277 <0.001
PPAR𝛼GG/GC/CC 0.144 0.025
PPAR𝛼C allele 0.151 0.018
PPAR𝛼G allele 0.025 0.700
BMI: body mass index; HOMA-IR: Homeostasis Model Assessment-Insulin Resistance; Spearman correlation.
Table 5: Univariate regression analysis between serum fetuin-A concentrations and metabolic parameters(𝑛 = 244).
Predictor Standardized𝛽 𝑝
BMI 0.146 0.023
Diabetes status (no/yes) 0.136 0.034
HOMA-IR 0.163 0.011
Postinfarction status (no/yes) 0.212 0.001
Age −0.137 0.098
Gender −0.149 0.027
PPAR𝛼GG/GC/CC 0.131 0.042
PPAR𝛼C allele 0.140 0.029
BMI: body mass index; HOMA-IR: Homeostasis Model Assessment-Insulin Resistance.
the C allele were the only statistically significant predictors of serum fetuin-A levels. In a backward stepwise regres- sion model, the postinfarction status, the PPAR𝛼 intron 7 GG/GC/CC genotypes, and the C allele proved to be the strongest determinants of fetuin-A concentration.
3.4. Analysis of Association between PPAR𝛾2 Pro12Ala Vari- ants and Serum Fetuin-A Concentrations. Patients with Pro/Pro and Pro/Ala genotype had significantly higher serum fetuin-A concentrations than those with the Ala/Ala geno- type (Pro/Pro: 681 ± 131 mg/l, 𝑛 = 247, Pro/Ala: 706 ±
131 mg/l, 𝑛 = 75, and Ala/Ala: 565 ± 116 mg/l, 𝑛 = 5, 𝑝 = 0.043, Kruskal-Wallis test). In the recessive model (Pro versus non-Pro), the fetuin-A level associated with the allele determining Pro exceeded that of the non-Pro variant (687± 131 mg/l,𝑛 = 322versus 565±116 mg/l,𝑛 = 5,𝑝 = 0.047, Mann–Whitney test). Fetuin-A concentrations did not differ in the recessive model (Ala versus non-Ala) (698±143 mg/l, 𝑛 = 80versus 681±131 mg/l,𝑛 = 247,𝑝 = 0.287).
Serum fetuin-A concentration was significantly associ- ated with BMI, HOMA-IR, gender, and the Pro allele but not with the diabetes and postinfarction status, PPAR𝛾Pro/Pro, Pro/Ala, and Ala/Ala genotypes or the Ala allele (Table 7).
Thus these two latter parameters were left out from further analysis. The correlation between fetuin-A concentration and the Pro allele was lost following correction for BMI and gender but not with HOMA-IR (Table 8).
Univariate regression analysis showed that serum fetuin- A (dependent variable) weakly but significantly correlated with BMI and the PPAR𝛾Pro allele (independent variable, Table 9). This latter independent variable lost its predictor role when BMI was included in the regression model.
In the multiple backward stepwise regression model, postinfarction status (𝛽 = 0.111,𝑝 = 0.041) and BMI (𝛽 = 0.426,𝑝 < 0.001) proved to be the strongest determinants of fetuin-A concentrations.
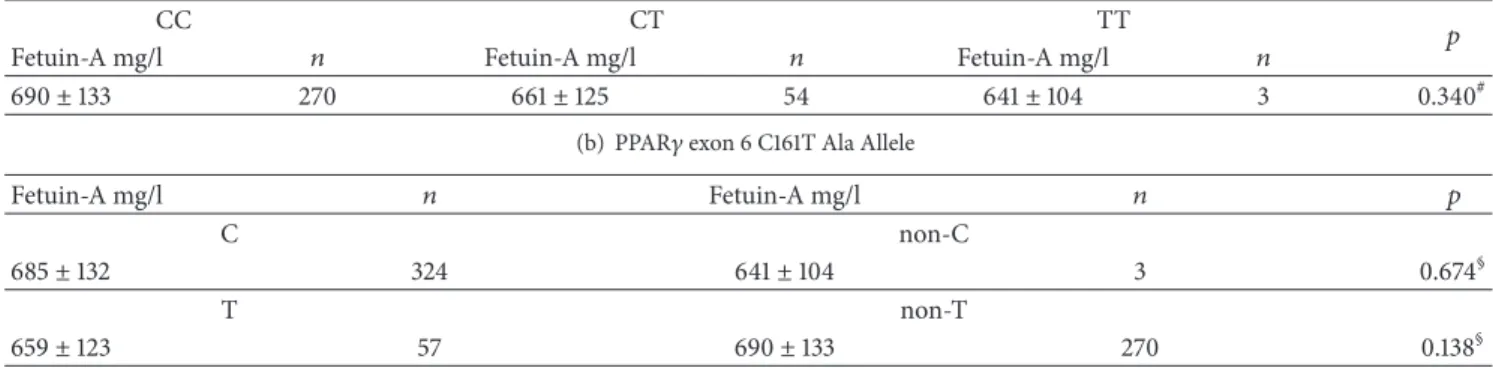
3.5. Analysis of Association between PPAR𝛾 Exon 6 C161T Variants and Serum Fetuin-A Concentrations. We found no significant differences among serum fetuin-A concentrations of individuals with different PPAR𝛾exon 6 C161T genotypes, nor between the C and non-C or T and non-T groups (Table 10). Fetuin-A levels did not correlate with the PPAR𝛾 C161T genotypes, C, and T alleles, either (data not shown).
There were 3 minor variant homozygotes (TT) in the postinfarction but none in the reference group. Thus the genotype distribution of postinfarction patients markedly differed from that of reference individuals (CC/CT/TT:
130/37/3 versus 140/17/0, 𝑝 = 0.006). The T allele was significantly more frequent among postinfarction patients compared to reference group (40/170 = 23.5% versus 17/157 = 10.8%,𝑝 = 0.002). Accordingly, postinfarction patients with the CC genotype had lower fetuin-A levels than reference subjects (668 ± 113 mg/l,𝑛 = 130 versus 710 ± 146 mg/l, 𝑛 = 140,𝑝 = 0.037).
Table 6: Multiple regression analysis of PPAR𝛼intron 7 G/C genotypes and C allele and serum fetuin-A concentration(𝑛 = 244).
Predictor PPAR𝛼intron 7 GG/GC/GG PPAR𝛼intron 7 C allele
Standardized𝛽 𝑝 Standardized𝛽 𝑝
All predictors included
BMI 0.027 0.708 −0.024 0.743
Diabetes status (no/yes) 0.054 0.474 0.045 0.551
HOMA-IR 0.037 0.651 0.035 0.666
Postinfarction status (no/yes) 0.130 0.127 0.132 0.121
Gender −0.079 0.260 −0.083 0.242
PPAR𝛼intron 7 genetics# 0.134 0.036 0.144 0.024
Model fit:𝑝 = 0.006 Model fit:𝑝 = 0.005
Stepwise backward regression
Postinfarction status (no/yes) 0.214 0.001 0.215 0.001
PPAR𝛼intron 7 genetics# 0.135 0.032 0.144 0.021
Model fit:𝑝 < 0.001 Model fit:𝑝 < 0.001
#Regression parameters of the PPAR𝛼intron 7 GG/GC/GG genotypes are indicated in the second and the third and those of the PPAR𝛼intron 7 C allele in the fourth and fifth columns of the table, respectively; BMI: body mass index; HOMA-IR: Homeostasis Model Assessment-Insulin Resistance.
Table 7: Correlation between serum fetuin-A and investigated parameters(𝑛 = 327).
Parameter Correlation coefficient 𝑝
BMI 0.426 <0.001
Diabetes status (no/yes) 0.102 0.064
HOMA-IR 0.129 0.027
Gender −0.178 0.008
Postinfarction status
(no/yes) 0.098 0.078
PPAR𝛾Pro/Pro, Pro/Ala,
and Ala/Ala 0.050 0.365
PPAR𝛾Pro allele 0.130 0.018
PPAR𝛾Ala allele 0.052 0.349
BMI: body mass index HOMA-IR: Homeostasis Model Assessment-Insulin Resistance; Spearman correlation.
Table 8: Partial correlation between serum fetuin-A concentrations and PPAR𝛾Pro allele(𝑛 = 327).
Corrected for Correlation coefficient 𝑝
Uncorrected 0.130 0.018
BMI 0.069 0.215
HOMA-IR 0.129 0.027
Gender 0.129 0.055
4. Discussion
In our study, we investigated whether PPAR𝛼intron 7 G/C, PPAR𝛾2 Pro12Ala, and PPAR𝛾C161T variants are associated with serum fetuin-A concentration. Since subjects in our groups had several parameters that are known to affect fetuin- A levels such as age, gender, BMI, parameters of insulin resistance (diabetes status, HOMA-IR), and postinfarction status [22], we chose regression model to estimate the impact of these variables.
Table 9: Univariate regression analysis between serum fetuin-A concentrations and predictor parameters(𝑛 = 327).
Predictor Standardized𝛽 𝑝
BMI 0.520 <0.001
Diabetes status (no/yes) 0.065 0.239
HOMA-IR 0.059 0.291
Postinfarction status (no/yes) 0.137 0.013
PPAR𝛾Pro allele 0.127 0.022
PPAR𝛾Pro allele + BMI
0.059 0.512
0.215
<0.001 BMI: body mass index; HOMA-IR: Homeostasis Model Assessment-Insulin Resistance.
PPAR𝛼has been termed as a lipid sensor and is involved in microsomal𝜔-oxidation and mitochondrial and peroxi- somal𝛽-oxidation resulting in energy burning and reduced fat storage [11]. The minor variant of the PPAR𝛼intron 7C has been considered to have a decreased activity compared to G, the major variant. The C haplotype promotes the early development of type 2 diabetes [17] and is more frequent among postinfarction patients [12, 15]. Doney et al. have found that the risk of myocardial infarction is higher in the presence of the C allele [23]. We also have found that the C allele is associated with higher fetuin-A levels and the multiple regression revealed that fetuin-A levels are strongly determined by the postinfarction status and remarkably by the PPAR𝛼intron 7 G/C polymorphism, as well. Although the C allele was not more frequent among our postinfarction patients, the higher fetuin-A concentration may also have deleterious effects in them. Elevated fetuin-A concentration is a marker of fatty liver, characterized by decreased𝛽-oxidation of fatty acids [4].
Fetuin-A is synthesized almost exclusively by the hepa- tocytes in adults [24] and the PPAR𝛼is mainly expressed in the liver, as well. Fetuin-A is known as an endogenous ligand
Table 10: Serum fetuin-A concentrations in individuals with different PPAR𝛾exon 6 C161T polymorphisms and alleles(𝑛 = 327).
(a) PPAR exon 6 C161T polymorphisms
CC CT TT 𝑝
Fetuin-A mg/l 𝑛 Fetuin-A mg/l 𝑛 Fetuin-A mg/l 𝑛
690±133 270 661±125 54 641±104 3 0.340#
(b) PPAR𝛾exon 6 C161T Ala Allele
Fetuin-A mg/l 𝑛 Fetuin-A mg/l 𝑛 𝑝
C non-C
685±132 324 641±104 3 0.674§
T non-T
659±123 57 690±133 270 0.138§
#Kruskal-Wallis test;§Mann–Whitney test.
that binds to free fatty acids and functions as an endoge- nous ligand for the Toll-like receptor TLR-4 thereby linking metabolic diseases (hyperlipidemia, insulin resistance) and subclinical inflammation [25]. This “missing link” character of fetuin-A has been further supported by the clinical studies of Stefan and H¨aring [26]. These findings are in line with our observation that postinfarction status, an endpoint of subclinical inflammation, and PPAR𝛼intron 7C allele were the strongest determinants of fetuin-A in our subjects.
Compared to Ala metabolically disadvantageous char- acteristics are attributed to the Pro variant of PPAR𝛾2 Pro12Ala [27]. Indeed, we found only the Pro allele among individuals with BMI over 25 kg/m2 and only lean (BMI
≤25 kg/m2) subjects had the Ala/Ala homozygous variant.
Nevertheless, even among individuals with the Ala variant, obesity was associated with higher fetuin-A levels compared to lean ones. Patients with diabetes had higher fetuin-A levels, the difference being significant in Pro/Pro major allele homozygotes (704±124 mg/l,𝑛 = 64versus 673±132 mg/l, 𝑛 = 183, 𝑝 = 0.020). Since fetuin-A is known to be the natural inhibitor of the insulin receptor tyrosine kinase, the Pro allele may convey increased insulin resistance. Indeed, we found minor variant Ala to be more frequent among nondiabetics (68/251 = 27.1%) compared to diabetics (12/76
= 15.8%,𝑝 = 0.044). This finding is in accordance with that of Vergotine, who observed that the Pro allele increases insulin resistance, along with IRS1Gly972 [28]. Conversely, the minor allele Ala seemed to be protective in Iranian and Chinese populations [29, 30]. In our model, however, the relationship of fetuin-A levels with BMI and postinfarction status was much stronger than the one with insulin resistance (diabetes status or HOMA). The Pro allele was associated with higher fetuin-A in the nondiabetic group, as well, which is reflected by the weak correlation with diabetes status and HOMA-IR.
Given the property of fetuin-A to increase insulin resistance, its weak association with the Pro allele can contribute to the deleterious effects of this allele.
Analysis of the effect of the PPAR𝛾 C161T variants on serum fetuin-A concentrations yielded the least consistent results. We had 3 minor homozygotes (TT) among the postinfarction patients but not among the reference subjects.
This finding is in accord with the observation of Qian et al., who found that coronary heart disease was not associated with the T-carrier state but these individuals had higher risk for acute coronary heart syndrome [12]. Wu et al. found mild protective effect of the T allele only in the Chinese but not in other populations [16]. We found no marked associations of C161T genotypes and alleles neither in postinfarction patients nor in the reference group, and not during the analysis of nonobese, nondiabetic individuals. This suggests that the C161T has the weakest association with fetuin-A levels out of the three PPAR polymorphisms we studied. Since PPAR𝛾 is expressed mainly in the fat tissue, its association with the levels of the liver secretory protein fetuin-A cannot be as close as that of PPAR𝛼.
Although not yet entirely clarified, several observations suggest the molecular basis of the association between PPAR variants and fetuin-A synthesis. The PPAR𝛼 agonist fibrates decrease fetuin-A expression in obese patients with or without type 2 diabetes mellitus [31]. The PPAR𝛾agonist pioglitazone strongly inhibits fetuin-A expression [14]. The upregulation of both PPAR𝛼 and PPAR𝛾 results in the downregulation of fetuin-A and NF𝜅B and upregulation of the AMPK kinase activities. Palmitate, the oxidation of which is highly induced by PPAR𝛼, has been shown to stimulate NF𝜅B binding to the fetuin-A promoter [9]. Thus a less functional variant of PPAR𝛼could finally result in enhanced fetuin-A expression.
Our study has its limitations. First, the sample size is not big enough to allow for analysis of a comparable number of minor variants. Second, our cohorts were not controlled for environmental factors and prescribed medication and dietary saturated and polyunsaturated fat as it has been suggested [32].
5. Conclusion
In summary, our results indicate a relatively close relationship between PPAR𝛼intron 7 G/C and PPAR𝛾2 Pro12Ala variants and serum fetuin-A concentrations reflecting higher levels in the presence of the C allele of the former and the Pro allele of the latter one. It is very likely that these associations
are obscured by obesity and/or diabetes. Larger scale studies are needed to further determine the biological and clinical significance of the PPAR polymorphisms on fetuin-A levels.
Conflicts of Interest
The authors declare that there are no conflicts of interest regarding the publication of this paper.
Authors’ Contributions
Bernadett M´arkus was responsible for the preparation of the manuscript; Kriszti´an V¨or¨os was responsible for the statistical analysis; Dorina Sup´ak and Zsolt Melczer were responsible for patient and data management; K´aroly Cseh was responsible for the determination of PPAR polymor- phisms and critical review of the manuscript; L´aszl´o Kalabay was responsible for conceiving the idea of the study and critical review of the manuscript.
Acknowledgments
The authors thank V. M. Nagyn´e for the determination of serum fetuin-A concentration. This work was supported by grant of the Hungarian Ministry of Health ETT 368/2009.
References
[1] T. Reinehr and C. L. Roth, “Fetuin-A and its relation to metabolic syndrome and fatty liver disease in obese children before and after weight loss,”Journal of Clinical Endocrinology and Metabolism, vol. 93, no. 11, pp. 4479–4485, 2008.
[2] C. Lavebratt, S. Wahlqvist, L. Nordfors, J. Hoffstedt, and P.
Arner, “AHSG gene variant is associated with leanness among Swedish men,”Human Genetics, vol. 117, no. 1, pp. 54–60, 2005.
[3] P. Suchanek, I. Kralova-Lesna, R. Poledne, V. Lanska, and J. A.
Hubacek, “An AHSG gene variant modulates basal metabolic rate and body composition development after a short-time lifestyle intervention,”Neuroendocrinology Letters, vol. 32, no.
2, pp. 32–36, 2011.
[4] N. Stefan, A. M. Hennige, H. Staiger et al., “𝛼2-Heremans- Schmid glycoprotein/fetuin-A is associated with insulin resis- tance and fat accumulation in the liver in humans,”Diabetes Care, vol. 29, no. 4, pp. 853–857, 2006.
[5] J. H. Ix, M. G. Shlipak, V. M. Brandenburg, S. Ali, M. Ketteler, and M. A. Whooley, “Association between human fetuin-A and the metabolic syndrome: Data from the heart and soul study,”
Circulation, vol. 113, no. 14, pp. 1760–1767, 2006.
[6] N. Stefan, A. Fritsche, C. Weikert et al., “Plasma fetuin-A levels and the risk of type 2 diabetes,”Diabetes, vol. 57, no. 10, pp. 2762–
2767, 2008.
[7] N. Stefan, H.-U. H¨aring, and M. B. Schulze, “Association of fetuin-A level and diabetes risk,”JAMA - Journal of the American Medical Association, vol. 300, no. 19, p. 2247, 2008.
[8] J. H. Ix, C. L. Wassel, A. M. Kanaya et al., “Fetuin-A and incident diabetes mellitus in older persons,”JAMA - Journal of the American Medical Association, vol. 300, no. 2, pp. 182–188, 2008.
[9] S. Dasgupta, S. Bhattacharya, A. Biswas et al., “NF-𝜅B mediates lipid-induced fetuin-A expression in hepatocytes that impairs
adipocyte function effecting insulin resistance,” Biochemical Journal, vol. 429, no. 3, pp. 451–462, 2010.
[10] C. P. Dong, L. He, J. N. Li, F. Ye, M. He, and Y. Wang,
“Association of the Pro12Ala and C1431T polymorphism of the PPAR gamma2 gene and their haplotypes with obesity and type 2 diabetes,”Chinese Journal of Medical Genetics, vol. 25, no. 4, pp. 447–451, 2008.
[11] B. Grygiel-G´orniak, “Peroxisome proliferator-activated recep- tors and their ligands: nutritional and clinical implications—a review,”Nutrition Journal, vol. 13, article 17, 2014.
[12] Y. Qian, P. Li, J. Zhang et al., “Association between peroxisome proliferator-activated receptor-alpha, delta, and gamma poly- morphisms and risk of coronary heart disease: A case-control study and meta-analysis,”Medicine (United States), vol. 95, no.
32, Article ID e4299, 2016.
[13] A. Ochi, K. Mori, M. Emoto et al., “Direct inhibitory effects of pioglitazone on hepatic fetuin-A expression,”PLoS ONE, vol. 9, no. 2, Article ID e88704, 2014.
[14] K. Mori, M. Emoto, T. Araki et al., “Effects of pioglitazone on serum fetuin-A levels in patients with type 2 diabetes mellitus,”
Metabolism: Clinical and Experimental, vol. 57, no. 9, pp. 1248–
1252, 2008.
[15] S. Purushothaman, V. K. Ajitkumar, and R. Renuka Nair, “Asso- ciation of PPARalpha Intron 7 Polymorphism with Coronary Artery Disease: A Cross-Sectional Study,”ISRN Cardiology, vol.
2011, Article ID 816025, 2011.
[16] Z. Wu, Y. Lou, W. Jin, Y. Liu, L. Lu, and G. Lu, “The C161T polymorphism in the peroxisome proliferator-activated recep- tor gamma gene (PPAR𝛾) is associated with risk of coronary artery disease: a meta-analysis,”Molecular Biology Reports, vol.
40, no. 4, pp. 3101–3112, 2013.
[17] D. M. Flavell, H. Ireland, J. W. Stephens et al., “Peroxisome proliferator-activated receptor𝛼gene variation influences age of onset and progression of type 2 diabetes,”Diabetes, vol. 54, no. 2, pp. 582–586, 2005.
[18] L.-M. Chuang, C. Hsiung, Y.-D. Chen et al., “Sibling-based association study of the PPAR𝛾2 Pro12Ala polymorphism and metabolic variables in Chinese and Japanese hypertension families: A SAPPHIRe study,”Journal of Molecular Medicine, vol. 79, no. 11, pp. 656–664, 2001.
[19] X. L. Wang, J. Oosterhof, and N. Duarte, “Peroxisome proliferator-activated receptor𝛾C161→T polymorphism and coronary artery disease,”Cardiovascular Research, vol. 44, no.
3, pp. 588–594, 1999.
[20] L. Kalabay, L. Jakab, Z. Proh´aszka et al., “Human fetuin/𝛼2HS- glycoprotein level as a novel indicator of liver cell function and short-term mortality in patients with liver cirrhosis and liver cancer,”European Journal of Gastroenterology and Hepatology, vol. 14, no. 4, pp. 389–394, 2002.
[21] D. R. Matthews, J. P. Hosker, A. S. Rudenski, B. A. Naylor, D.
F. Treacher, and R. C. Turner, “Homeostasis model assessment:
insulin resistance and 𝛽-cell function from fasting plasma glucose and insulin concentrations in man,”Diabetologia, vol.
28, no. 7, pp. 412–419, 1985.
[22] K. V¨or¨os, L. Gr´af Jr., Z. Proh´aszka et al., “Serum fetuin-A in metabolic and inflammatory pathways in patients with myocar- dial infarction,”European Journal of Clinical Investigation, vol.
41, no. 7, pp. 703–709, 2011.
[23] A. S. F. Doney, B. Fischer, S. Lee, A. D. Morris, G. P. Leese, and C.
N. A. Palmer, “Association of common variation in the PPARA gene with incident myocardial infarction in individuals with
type 2 diabetes: A Go-DARTS study,”Nuclear Receptor, vol. 3, article no. 4, 2005.
[24] J. T. Triffitt, U. Gebauer, B. A. Ashton, M. E. Owen, and J. J. Reynolds, “Origin of plasma 𝛼2HS-glycoprotein and its accumulation in bone,”Nature, vol. 262, no. 5565, pp. 226-227, 1976.
[25] D. Pal, S. Dasgupta, R. Kundu et al., “Fetuin-A acts as an endogenous ligand of TLR4 to promote lipid-induced insulin resistance,”Nature Medicine, vol. 18, no. 8, pp. 1279–1285, 2012.
[26] N. Stefan and H.-U. H¨aring, “Circulating fetuin-A and free fatty acids interact to predict insulin resistance in humans,”Nature Medicine, vol. 19, no. 4, pp. 394-395, 2013.
[27] A. S. F. Doney, B. Fischer, J. E. Cecil et al., “Association of the Pro12Ala and C1431T variants of PPARG and their haplotypes with susceptibility to Type 2 diabetes,”Diabetologia, vol. 47, no.
3, pp. 555–558, 2004.
[28] Z. Vergotine, Y. Y. Yako, A. P. Kengne, R. T. Erasmus, and T. E. Matsha, “Proliferator-activated receptor gamma Pro12Ala interacts with the insulin receptor substrate 1 Gly972Arg and increase the risk of insulin resistance and diabetes in the mixed ancestry population from South Africa,”BMC Genetics, vol. 15, article no. 10, 2014.
[29] A. Motavallian, S. Andalib, G. Vaseghi, H. Mirmohammad- Sadeghi, and M. Amini, “Association between PRO12ALA polymorphism of the PPAR-𝛾2 gene and type 2 diabetes mellitus in Iranian patients,”Indian Journal of Human Genetics, vol. 19, no. 2, pp. 239–244, 2013.
[30] X. Wang, J. Liu, Y. Ouyang, M. Fang, H. Gao, and L. Liu,
“The association between the Pro12Ala variant in the PPAR𝛾2 gene and type 2 diabetes mellitus and obesity in a Chinese population,”PLoS ONE, vol. 8, no. 8, Article ID e71985, 2013.
[31] M. H. Noureldein, R. S. Abd El-Razek, M. H. El-Hefnawy, and H. O. El-Mesallamy, “Fenofibrate reduces inflammation in obese patients with or without type 2 diabetes mellitus via sirtuin 1/fetuin A axis,”Diabetes Research and Clinical Practice, vol. 109, no. 3, pp. 513–520, 2015.
[32] A. V. Contreras, N. Torres, and A. R. Tovar, “PPAR-𝛼 as a key nutritional and environmental sensor for metabolic adaptation,”Advances in Nutrition, vol. 4, no. 4, pp. 439–452, 2013.
Submit your manuscripts at https://www.hindawi.com
Stem Cells International
Hindawi Publishing Corporation
http://www.hindawi.com Volume 2014
Hindawi Publishing Corporation
http://www.hindawi.com Volume 2014
INFLAMMATION
Hindawi Publishing Corporation
http://www.hindawi.com Volume 2014
Behavioural Neurology
Endocrinology
International Journal ofHindawi Publishing Corporation
http://www.hindawi.com Volume 2014
Hindawi Publishing Corporation
http://www.hindawi.com Volume 2014
Disease Markers
Hindawi Publishing Corporation
http://www.hindawi.com Volume 2014
BioMed
Research International
Oncology
Journal ofHindawi Publishing Corporation
http://www.hindawi.com Volume 2014
Hindawi Publishing Corporation
http://www.hindawi.com Volume 2014
Oxidative Medicine and Cellular Longevity
Hindawi Publishing Corporation
http://www.hindawi.com Volume 2014
PPAR Research The Scientific World Journal
Hindawi Publishing Corporation
http://www.hindawi.com Volume 2014
Immunology Research
Hindawi Publishing Corporation
http://www.hindawi.com Volume 2014
Journal of
Obesity
Journal ofHindawi Publishing Corporation
http://www.hindawi.com Volume 2014
Hindawi Publishing Corporation
http://www.hindawi.com Volume 2014
Computational and Mathematical Methods in Medicine
Ophthalmology
Journal ofHindawi Publishing Corporation
http://www.hindawi.com Volume 2014
Diabetes Research
Journal ofHindawi Publishing Corporation
http://www.hindawi.com Volume 2014
Hindawi Publishing Corporation
http://www.hindawi.com Volume 2014
Research and Treatment
AIDS
Hindawi Publishing Corporation
http://www.hindawi.com Volume 2014
Gastroenterology Research and Practice
Hindawi Publishing Corporation
http://www.hindawi.com Volume 2014
Parkinson’s Disease
Evidence-Based Complementary and Alternative Medicine
Volume 2014 Hindawi Publishing Corporation
http://www.hindawi.com