Research Article
Paleofluid Fingerprint as an Independent Paleogeographic Correlation Tool: An Example from Pennsylvanian Sandstones and Neighboring Crystalline Rocks (Tisia Composite Terrane, S Hungary)
Krisztián Fintor and Andrea Varga
Department of Mineralogy, Geochemistry and Petrology, University of Szeged, H-6722, Hungary Correspondence should be addressed to Andrea Varga; raucsikvarga@geo.u-szeged.hu Received 28 October 2019; Accepted 1 February 2020; Published 17 March 2020 Guest Editor: Antonio Benedicto
Copyright © 2020 Krisztián Fintor and Andrea Varga. This is an open access article distributed under the Creative Commons Attribution License, which permits unrestricted use, distribution, and reproduction in any medium, provided the original work is properly cited.
In the basement areas of the southern Pannonian Basin, Central Europe (Tisia Composite Terrane, Hungary), Variscan blocks are essential components. The existing paleogeographic reconstructions, however, are often unclear and contradictory. This paper attempts to give a contribution for paleogeographic correlation of the Tisia using paleohydrological features (e.g., vein mineralization types, inclusion fluid composition and origin) of the Pennsylvanian continental succession and neighboring crystalline complexes. Vein-type mineralization in the studied samples dominantly forms blocky morphological types with inclusion-rich quartz and carbonate crystals. The evolution of hydrothermal mineralization and host rock alteration in the study area comprises three major stages. The first one is characterized by chloritization, epidotization, and sericitization of metamorphic rocks together with subsequent formation of Ca-Al-silicate and quartz-sulfide veins (clinopyroxene-dominant and epidote-dominant mineralization). The related fluid inclusion record consists of high-temperature and low-salinity aqueous inclusions, corresponding to a reduced retrograde-metamorphicfluid phase during the Late Westphalian (~310 Ma). The next mineralization stage can be related to a generally oxidized alkalinefluid phase with a cross-formational character (hematite-rich alkali feldspar-dominant and quartz-dolomite veins). High-salinity primary aqueous inclusions probably were originated from the Upper Permian playafluids of the region. The parentfluid of the third event (ankerite-hosted inclusions) was derived from a more reductive and low-salinity environment and can represent a post-Variscanfluid system. Fluid evolution data presented in this paper support that the W Tisia (Mecsek–Villány area) belonged to the Central European Variscan belt close to the Bohemian Massif up to the Early Alpine orogenic phases. Its original position is presumably to the northeast from the Bohemian Massif at the Late Paleozoic, north to the Moravo-Silesian Zone. The presented paleofluid evolution refines previous models of the paleogeographic position of the Tisia and puts constraints on the evolution of the Variscan Europe.
1. Introduction
In the basement areas of the Pannonian Basin, Central Europe (Hungary), pre-Variscan and Variscan blocks are essential components [1–4]. Late Variscan age granitoids are known in the Tisia Composite Terrane or Tisza Mega- unit (e.g., ca. 330–360 Ma, Mórágy Granite Complex) where locally marine Silurian and terrestrial Permo-Carboniferous (meta) sediments are also preserved (Figure 1). Based on its
Variscan and early Alpine tectonostratigraphic characteris- tics, the Tisia was located at the margin of the European Plate prior to a rifting period in the Middle Jurassic [5–7]. The existing paleogeographic reconstructions, based on the corre- lation of the Paleozoic and Mesozoic facies belts in the Alpine–Carpathian domain, however, are contradictory (Figure 2). On the one hand, at the end of the Variscan cycle, the polymetamorphic complexes of the Tisia belonged to the southern part of the Moldanubian Zone, forming the
https://doi.org/10.1155/2020/3568986
European margin of the Paleo-Tethys [2, 3, 5]. Position of the Tisia can be determined east to the Bohemian Massif and to the Western Carpathians (Figure 2(a)).
On the other hand, the Bohemian Massif can project below the Eastern Alps and the Vienna Basin as a major base- ment promontory referred to as the Bohemian Spur [9, 11].
According to this concept, the conjugate upper margin can be found in the northern edge of the Moesian Platform (Romania and Bulgaria) which is a large microplate between the Southern Carpathians and the Balkans [12]. Therefore, its pre-Middle Jurassic reconstruction between the Bohemian Spur and the Teisseyre-Tornquist Zone leaves no space for the Tisia in this segment of the European margin
(Figures 1 and 2(b)). Consequently, the original paleogeo- graphic position of the Tisia on the European southern margin had to be to the west of the Bohemian Spur, hav- ing the structural characteristics of syn-rift development during the latest Triassic and Early Jurassic (e.g., pro- nounced extensional half-grabens with the characteristic Gresten facies siliciclastic basin fill) [9, 13]. This scenario was recently reinforced [14], suggesting a connection of the Tisia to the southern and/or southwestern part of the Bohemian Massif.
If the assumption that the Tisia was an integrated part of the Moldanubian Zone up to the latest Triassic is cor- rect, at least some lithostratigraphic units from both areas
Bohemian Spur
Pannonian Basin
Dacia Block
Adria Block
Alcapa
0 200 km
Budapest
Alpine–Carpathian Flysch Belt
Pieniny Klippen Belt Inner Alpine–Carpathian Mountain Belt and the Dinarides
19°E
48°N Danube
Danube Tisza Southern
Alps
Dinarides
Southern Carpathians Western Carpathians
Eastern Carpathians
Drava
Vienna
Drava Alps
Bohemian Spur (basement promontory)
1 2
3 Kunság Unit
Kőrös Subunit Békés Unit Tisia(Tisza)
Mórágy Subunit SDU
Slavonian Mts Paris
Vienna Praha
Massif Central
Vosges Black Forest
Bohemian Massif
Moldanubian Zone Saxo-Thuringian Zone Rheno-Hercynian Zone Subvariscicum 50°N
44°N
0 200 km
Neogene calc-alkaline volcanic rocks Cenozoic basin fill Oberpfalz MS
Forest
Bohemicum
N
Figure1: Regional geology. Simplified map of Variscan basement areas in W and Central Europe [1, 8] and geologic framework of the Carpathian–Pannonian area [1, 4]. Late Variscan age granitoids known in the Hungarian part of the Tisia are also indicated [2]. 1: Mecsek Mountains (Mórágy Complex), monzonite; 2: Danube–Tisza Interfluve, Kecskemét basement area, monzonite; 3: Battonya basement area, tonalite. Box indicates area studied in detail (see Figure 3(a)). MS: Moravo–Silesian (Brunovistulian) Zone; ALCAPA: Alpine–West Carpathian–Pannonian Block; SDU: Slavonia–Drava Unit.
should be characterized by similar Late Variscan and post- Variscan large-scale hydrothermal events and host rock alteration styles. Veins are common features in rocks and extremely useful structures to determine pressure- temperature range,fluid composition, andfluid origin dur- ing their formation [15]. This paper attempts to give a contribution for paleogeographic correlation of the Tisia
Composite Terrane using paleofluid features of the Penn- sylvanian (Upper Carboniferous) continental succession, Téseny Formation, S Hungary. In addition, the results from previous vein petrological and geochemical studies of the Téseny Formation and neighboring crystalline com- plexes in the study area [16–25] have also been integrated into this paper.
~325 Ma
Exposed land Shallow marine shale
Shallow marine carbonates
Flysch
European Plate Bohemian
Massif
Tisia (Tisza) Western
Carpathians
Outer Dinarides East Alpine Upper Austroalpine Lower
Middle Southern Alps
Austroalpine
Paleotethys Gulf Drauzug
Eastward
(a)
Bohemian Massif
Tisia (Tisza)
Moesia Vienna
Budapest
Bucharest Alps
Balkans
Black Sea Carpathians
TTZ
Teisseyre-Tornquist Zone (TTZ) Present-day
Early Jurassic Oblique/transform margin
of the Penninic Ocean Tisia (Tisza)
Moesia Bohemian Massif
Bohemian Spur (basement promontory)
Westward
(b)
Figure2: Speculative paleogeographic position of the Tisia. (a) Paleogeographic reconstruction for the Early Carboniferous [5]. (b) Position of the Tisia for the Early Jurassic [9]. The present-day outline of the Tisia is the end-result of severe continental E–W extension during the Miocene and equally important Eo-Alpine N–S shortening during the Cretaceous [10]. Thus, a more likely pre-Albian map-view outline of the Tisia should have an isometric shape [9].
mometry was applied to unravel the tectono-sedimentary record of the Téseny siliciclastic deposits in the Slavonia– Drava Unit (Figure 1). The paleofluid evolution presented in this article refines previous models of the tectonic history of the Tisia and puts constraints on the evolution of the Variscan Europe.
2. Geological Setting
The Tisia Composite Terrane, corresponding to a structural mega-unit, forms the basement of the southern Pannonian Basin [4, 6, 7]. Within the crystalline basement, three ter- ranes have been distinguished: (1) Slavonia–Drava Unit, which can be subdivided into the Babócsa and Baksa Com- plexes (Subunits); (2) Kunság Unit, including Variscan gran- itoids of the Mórágy Complex; and (3) Békés Unit [4]. The study area includes the western Mecsek Mountains, which are parts of the Kunság Unit (Mórágy Subunit), and the western flank of the Villány Mountains which is a part of the Slavonia–Drava Unit (Figures 1 and 3(a)). The crystalline complexes and the overlying Paleozoic and Mesozoic sequences show heterogeneous lithological and metamorphic characteristics, indicating various phases of geologic evolu- tion [4, 7]. The oldest Paleozoic rocks are the late Early Silurian Szalatnak Slate deposits (Szalatnak Unit) related to a marine clastic sedimentation. In the Pennsylvanian, a molasse-type siliciclastic and, locally, coal-bearing sequence called Téseny Sandstone Formation was deposited in a fore- land basin. In the Permian, continental red beds together with volcanosediments characterized the development of the study area [1, 4, 24, 26–28].
The nonmetamorphic (locally anchimetamorphic) Téseny Formation is interpreted as afluvial system deposit.
It unconformably overlies the Babócsa and Baksa metamor- phic basement complexes and has a maximum thickness of 1500 m, occurring subsurface in the area between the Mecsek and Villány Mountains (Figure 3(a)). It is composed of con- glomerate, sandstone, and siltstone; in addition, shale and coal seams also occur. These rocks contain a Namurian–
Westphalianflora and Westphalian palynomorphs [24, 25, 29–31].
Téseny rocks are known from numerous shallow wells in the western flank of the Villány Mountains (Figure 3), for example, in wells Téseny–2 (T–2) to Téseny–7 (T–7).
Additionally, it was also penetrated in deep boreholes Bogádmindszent–1 (Bm–1), Diósviszló–1 (Dv–3), and Sik- lósbodony–1 (Sb–1). Lithologically, the Téseny Sandstone samples are poorly to moderately sorted lithic-feldspathic wacke to arenite and arkose. They are composed of variable amounts of quartz, plagioclase, K-feldspar, micas, chlorite, clays, Fe oxides, and lithic grains such as quartz-rich metamor- phic, acidic-intermediate volcanic, granitoid, and siliciclastic rock fragments [20–24]. The poorly to moderately sorted polymictic Téseny conglomerate samples are characterized
viously distinguished [29]: (1) an older vein-type carbonate- feldspar mineralization, which comprises kidney-shaped siderite, K-feldspar, and chlorite and (2) a younger pure quartz infilling. Furthermore, mm-to-cm-thick veins (“aplite dykes”) were also described in the boreholes Bm–1 and Sb–1 which comprise quartz, dolomite, K-feldspar, and chlorite [31]. Petrographic features of some Téseny Sandstone samples reflect extensive hydrothermal alteration with con- comitant pyritization. Alteration styles that accompany this disseminated sulfide mineralization comprise carbonatiza- tion, silicification, chloritization, and sericitization of the host rock [22–25].
3. Materials and Methods
For petrographic analysis of the Pennsylvanian Téseny rocks, Mining and Geological Survey of Hungary provided thin sec- tion collection from borehole Bm–1 (date of drilling: 1968) at depths of 848.9–1350.0 m below surface. Covered thin sec- tions (n= 373) were studied by polarized light microscopy.
The petrographic characterization of the observed veins (1 cm wide maximum), occurring in 27 thin sections, is based on papers by Bons [15, 32]. Additionally, thin section collec- tion (n= 11) of the Eötvös Loránd University, Budapest, from the wells near the village of Téseny (date of drillings:
1967) was also used for petrographic analysis. After that, a total of 11 core samples from the boreholes Bm–1, T–3, T–
5, T–6, and T–7 were newly collected for this study. Detailed vein petrographic descriptions using CL microscopy, X-ray fluorescence analysis, and fluid inclusion study were con- ducted on representative thin sections (quartz and quartz- carbonate vein types). Vein sample locations (n= 40) are shown in Figure 3(b). Conventional mineral abbreviations have been used during the whole manuscript [33].
Cathodoluminescence (CL) studies were carried out by a Reliotron cold cathode luminoscope operating at 8 kV and 0.7 mA at the host department. Photomicrographs were made using an Olympus DP73 camera and the exposure times varied between 1 and 3 min.
X-ray element maps of representative areas of selected samples and single point analyses were made in order to monitor compositional variations of the minerals using a Horiba Jobin Yvon XGT 5000 X-rayfluorescence spectrom- eter at the host department. In the case of carbonates, Ca, Mg, Fe, and Mn were measured while Pb, Bi, Zn, Cu, Fe, As, Sb, Sn, Ag, Se, Te, Au, Ga, and Cd were analyzed for galena. Standardization was made by natural internal stan- dards. Beam diameter was 100μm and acceleration voltage was 30 kV during element mapping. Operating conditions of point analyses for carbonates and galena were 30 kV accel- erating voltage and beam diameter 100μm and 50 kV voltage with beam diameter 100μm, respectively.
Fluid inclusions were studied in 75–150μm double- polished thick sections prepared from the vein materials at the host department. A low speed sawing machine was used
to cut the samples in order to avoid changes in the volumes of thefluid inclusions. Microthermometric measurements were carried out with a Linkam THMSG 600 heating-freezing stage operating over a temperature range from −190 to +600°C. Syntheticfluid inclusions were used to calibrate at
−56.6, 0.0, and +374.0°C. The accuracy of the data is approx- imately±0.2°C under freezing and±0.5°C under heating con- ditions. An LMPlanFI 100x objective lens (Olympus) was used to analyze the inclusions. The measurements of inclu- sions trapped in quartz began with freezing, while in the case of carbonate, the heating experiments were carried outfirst.
In the latter case, inclusions can suffer permanent deforma- tion during the freezing experiment [34]. The cycling method
[34] was used to determine the last ice melting temperature offluids trapped in calcite. Determinations of volume frac- tions of vapor bubbles (φvap) were obtained from area analy- sis in a two-dimensional projection offluid inclusions. Terms and symbols are used after Diamond [35].
Thermodynamic model to derive the behavior of high- salinity H2O-salt system with complex composition does not exist yet [36]. Failing a model, the salinities are calculated based on the equivalent mass% principle in the H2O–NaCl binary and H2O–NaCl–CaCl2ternary model systems. Salin- ity calculations are based onTm(ice) andTm(Hh) data of fluid inclusions using AqSo-Vir software by Bakker [37], cor- responding to a numerical model [38]. Program module
Baksa Complex Téseny Sandstone
Babócsa Complex
T-5 T-7 Bm-1
Metamorphic rocks Variscan granitoid rocks
Triassic rocks Permian rocks
Jurassic rocks Pennsylvanian
rocks
Cretaceous rocks Mecsekalja Zone
Villány Mts T-3 Ba-2
T-6 Mórágy9017
Complex
Borehole Sampled borehole
Local tectonic line Regional
tectonic line
Nappe
boundary Overthrust
0 10 km
N
Gyód
Key to lithology
(a)
Bm-1 Depth (m)
0 100 200 300 400 500 600 700 800 900 1000 1100 1200 1300
0 10 20 30 40 50 60
Téseny-5 Depth (m)
0 10 20 30 40 50 60 70 80 90 100 110 120 130 140 150 160
Téseny-7 Depth (m) Téseny-3
Depth (m) 0 10 20 30 40 50 60 70 80 90 100 110
1 2
3 4
5 6 0
10 20 30 40 50 60 70 80
Téseny-6 Depth (m)
900 950 1000
1100
Key to lithology
Quartz veins Quartz-carbonate veins
Quartz-silicate- carbonate veins Carbonate veins
Fibrous or stretched veins Symbols
1050 850
(b)
Figure 3: Local geology. (a) Generalized geologic map of the Mecsek–Villány area, S Hungary, showing the pre-Neogene basement formations [4]. (b) Schematic lithologic logs of the studied boreholes, showing the positions of the investigated cores within the hole. Bm-1:
Bogádmindszent–1. Key to lithology: 1: Holocene soil; 2: Pleistocene sand, loess, and red clay; 3: Upper Miocene sand, clay, and/or marl, lower part; 4: Upper Miocene sand, clay, and bentonite, upper part; 5: Pennsylvanian (Upper Carboniferous) sandstone and conglomerate;
6: coal seams.
BULK from program package FLUIDS [36] was used to determine the main physical parameters such as homogeni- zation pressure (ph), molar volume (Vm), and liquid to vapor ratio (φvap) offluid inclusions. This program uses equations of state (EoS) of Zhang and Frantz [39] in the case of bulk fluid inclusion and EoS of Krumgalz et al. [40] in the case of aqueousfluids.
Raman microscopic analysis offluid inclusions was car- ried out at the Department of Mineralogy and Petrology of Montanuniversität Leoben using a Jobin Yvon LABRAM confocal Raman microspectroscope which works with a frequency-doubled Nd-YAG laser of 100 mW capacity. Irra- diations were made by using a laser light with 532.2 nm (green) wavelength in the case of each sample. The instru- ment is characterized by 4 cm−1spectral- and fewμm3spatial resolutions. The calibration of the spectrometer was made by using synthetic silicon chip, polyethylene, calcite, and natural diamond crystal. Recording time was 150 sec in the case of each spectrum with 30 sec accumulation periods. Raman spectra of salt hydrates can be found in the range of 3000–
3700 cm−1 with a most important peaks around 3400 cm−1 [41, 42]. During Raman spectroscopy-assisted microthermo- metry, the Linkam THMSG 600 heating-freezing stage was mounted on the Raman spectrometer. In order to make accu- rate identification of ice and salt hydrates, spectra were recorded at temperature condition lower than−170°C. This method is applicable with great efficiency to determine last melting temperature of salt hydrates and to distinguish the different types of salt hydrates from ice and each other.
Stable isotope analyses for seven representative carbonate samples were made using a Finnigan delta plus XP mass spectrometer at the Research Centre for Astronomy and Earth Sciences of the Hungarian Academy of Sciences, Buda- pest. The sampling was done by microdrilling of crackfilling carbonate, obtaining 0.1–0.3 mg powder. Each sample was reacted with purified phosphoric acid, producing CO2 gas which was analyzed by the mass spectrometer. The isotopic
compositions δ13C (V-PDB) andδ18O (V-SMOW) of each sample are averages of replicate analyses. Precision of the measurements was ±0.1–0.2‰ in cases of δ13C and δ18O. The 13C and 18O isotope results are reported in the standard δ notation of the difference in isotope ratio between the sample and a standard expressed in per mil (‰), where δ=½ðRsample/RstandardÞ−1∗1000.
4. Results
4.1. Vein Classification and Petrography. Based on their geometric, textural, and mineralogical characteristics, the observed veins can be subdivided into four main groups:
(1) blocky, (2) fibrous, (3) stretched, and (4) polytextured veins. Additionally, four subtypes of blocky veins can be dis- tinguished, based on dominant mineral phases. Hydrother- mal alteration of the siliciclastic host rock is rare; although, adjacent to some quartz-silicate-carbonate blocky veins, millimeter–submillimeter thick zones of feldspar alteration, carbonatization, and chloritization are present (Figure 4).
4.1.1. Blocky Veins
(1) Quartz Veins. This subtype contains almost exclusively quartz as a fracturefilling mineral. Thickness of the veins is in a range of~0.2–5 mm. They are closely parallel or at 10– 30°angle to the long axis of the drill core. Most of the quartz veins are filled almost entirely euhedral and/or subhedral quartz crystals which are generally deposited directly to the vein walls. At some places, however, vein walls are coated by microcrystalline iron oxide/hydroxide (goethite; <1 mm in thickness) preceding quartz mineralization. Some of the quartz veins show elongate blocky texture where the c-axis of each crystal is close to perpendicular to the vein wall and tiny open cavities are observable among them frequently.
Most of the quartz crystals are exhibiting well-developed growth zonation patterns indicated byfluid inclusion bands.
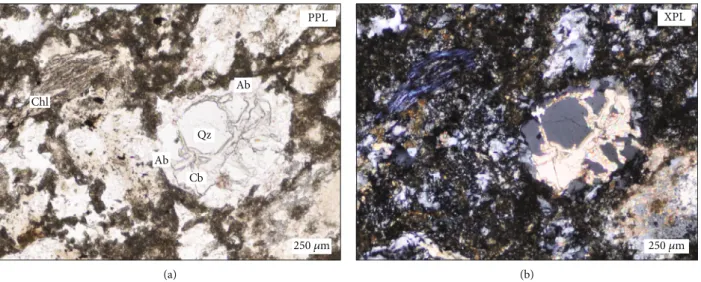
250 휇m Chl
Cb Qz Ab
Ab
(a)
250 휇m (b)
Figure4: Hydrothermal alteration of siliciclastic host rocks (borehole Bm–1, 1062.3 m). Note: dissolution of quartz (Qz) from the framework grains followed by albitization (Ab), pervasive carbonatization (Cb), and chloritization (Chl). Abbreviations: PPL: plane-polarized light; XPL:
crossed polars.
Additionally, faintly brown-luminescent adularia crystals subordinately occur either as replacement and/or overgrowth on blue-luminescent detrital K-feldspar grains of the sand- stone wall rock or as a fracture filling mineral among the quartz crystals (Figure S1).
(2) Carbonate Veins. This subtype contains almost exclu- sively carbonate (mainly dolomite) fracturefilling minerals.
Thickness of these veins is in a range of~0.05–1 mm. Sparry dolomite crystals have curved crystal boundaries and undu- lose (sweeping) extinction (Figure S1).
(3) Quartz-Carbonate Veins. This subtype can be found only in the drill core samples from the borehole Bm–1 where these veins occur frequently. Their thickness is in a range of~0.01– 1 cm and they are at 30–35°angle with the long axis of the core. The quartz-carbonate veins are composed of symmetri- cal fracture infilling. Within the veins, quartz is deposited directly on the walls as euhedral crystals followed by a white colored sparry carbonate phase (mainly dolomite). This latter phase shows bulky habit and, in thin section, is characterized by a hypidiomorphic appearance with curved crystal bound- aries (Figure S2).
Quartz crystals show growth zonation that is marked by fluid inclusion assemblages, while CL microscopy reveals a more detailed internal growth zonation pattern.
Cores of the carbonate crystals show significant turbidity owned to fluid inclusion clusters. Their rims are, however, clear so they are free from fluid inclusions. Majority of the carbonate crystals display undulose extinction but do not show any deformation twins (Figure S2). Raman measurements indicate that these crystals are dolomites (characteristic bands: ~1098, ~300, and ~176 cm−1; http://
rruff.info/ [43, 44]). Millimeter-sized blocky crystals of galena occur sporadically in the pore space among dolomite crystals. The dolomite and galena assemblage is followed by a carbonate phase with growth zonation pattern marked by fluid inclusion bands. This latter carbonate phase is ankerite (characteristic bands: ~1093,
~289, and ~172 cm−1; http://rruff.info/ [43, 44]).
Using CL microscopy, the rhombohedral dolomite crys- tals with curved faces are nonluminescent while their very thin (<10μm) clear rims have a characteristic red lumines- cence. The following ankerite shows fine-scale oscillatory zonation containing thin red- and nonluminescent bands.
Tiny calcite crystals (~5–20μm) with a bright orange lumi- nescence can be found frequently as solid inclusions in this oscillatory zoned phase (Figure S2).
(4) Quartz-Silicate-Carbonate Veins. This subtype can be found in several investigated boreholes but not occurs so fre- quently than the abovementioned blocky ones. This subtype contains dominantly euhedral quartz crystals and sparry habit alkali feldspars where the latter show turbid internal texture caused by minute hematite inclusions. More or less amount of chlorite±kaolin minerals, botryoidal calcite, and sulfide minerals (mainly pyrite) with a minor amount of epi- dote and Ti-oxides also occur in these veins (Figure S2). In a single sample from the lowermost part of the Pennsylvanian
section (borehole Bm–1 1062.1 m), chlorite and/or pyrite are accompanied by euhedral monazite and/or xenotime crystals (Figure S3).
4.1.2. Fibrous Veins.Fibrous veins appear only in subordinate amounts and their thickness is lesser than 1 mm. They are emplaced parallel or at very small angle (<20°) to sedimen- tary bedding. Elongatedfibrous crystals are parallel with each other and perpendicular to the vein plane. The observed internal microstructure indicates antitaxial growth morphol- ogy. Two subtypes can be distinguished among them, one with solid inclusion trails which are parallel with the vein walls. This subtype occasionally contains quartz beyond the dominant carbonate fracturefilling mineral. The other sub- type is made by carbonate and frequently contains sinusoidal solid inclusion bands (Figure S4).
4.1.3. Stretched Veins. Stretched veins occur in subordinate amounts and contain dominantly stretched crystals of quartz together with minor amounts of chlorite or carbonates (Figure S4). The thickness of these veins is in a range of 0.2–1 mm.
4.1.4. Polytextured Vein.Polytextured vein is the rarest vein type in the investigated area (only a single studied sample).
It contains a fibrous carbonate on the vein wall that is followed by a blocky textured carbonate in the middle of the vein (Figure S4).
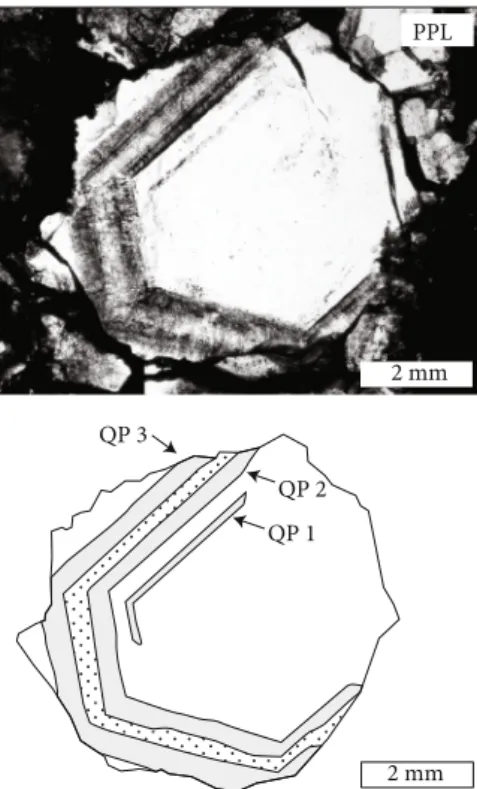
4.2. Mineral Chemistry.In order to reveal the element distri- bution in the carbonate phases of quartz-carbonate veins, X- ray element maps have been carried out (Figure 5). The results indicate that dolomite is chemically homogeneous.
On the other hand, two chemically distinct parts can be observed in ankerite. At the contact with dolomite, a thick band (50–200μm) is enriched in Mn (AnkMn) while other parts do not show Mn enrichment only the higher iron con- tent is typical for ankerite (AnkFe). Point analyses of dolomite indicate some iron substitution (Table S1). Their FeCO3 content varies between 8 and 10 mass% while MnCO3 content is <2 mass%. Composition of AnkMnshows 14–18 mass% FeCO3 and 5–8 mass% MnCO3 concentration, while MnCO3content of AnkFeshows 2–5 mass% and their FeCO3content varies in a wide range of 15–23 mass%.
Composition of galena differs a little bit from the stochio- metric composition (~86 mass% Pb and ~14 mass% S, respectively). Its Pb content varies between 83 and 89 mass%
while S content is in a range of 8–15 mass% with a relatively high Bi (0.5–1.4 mass%) content (Table S2). The analyzed galena is relatively rich in Ag (2200–4300 ppm), Se (1400–
5100 ppm), and Sn (1100–2900 ppm).
4.3. Stable Isotopes.A total of seven carbonate samples from quartz-carbonate veins were selected for stable isotope anal- yses (Table S3). The δ13C (V-PDB) and δ18O (V-PDB) values for dolomite vary from −6.15 to−5.77‰and from
−16.63 to −16.21‰, respectively. The studied ankerite samples display δ13C (V-PDB) values from −5.64 to
−5.39‰andδ18O (V-PDB) values from−16.09 to−14.93‰.
4.4. Fluid Inclusions.Petrographic characteristics and micro- thermometric data of the studiedfluid inclusion assemblages are summarized in Table 1. The raw data can be found in the Supplementary Materials (Table S4).
4.4.1. Quartz Veins. In the well-grown quartz crystals, pri- maryfluid inclusions can be distinguished due to their loca- tion along growing zones of the host crystal. In the euhedral quartz, three primary fluid inclusion assemblages (FIAs:
1 mm (a)
Mn 1 mm
(b)
Fe 1 mm
(c)
Dol
AnkFe
Ank
Mn
Void
Void
Gn
1 mm (d)
Figure5: X-ray element maps of carbonate phases of quartz-carbonate vein type (borehole Bm–1, 875.0 m). (a) Different carbonate phases together with galena in the quartz-carbonate vein type. (b, c) Distribution of intensity of Fe Kαline (green color) and Mn Kαline (red color) of ED spectra of the same area, respectively. (d) Summary outline about the textural distribution of different carbonate phases based upon petrographic, phase analytical (Raman), and EDS mapping information. Abbreviations: Dol: dolomite; Ank: ankerite; Gn: galena; PPL:
plane-polarized light.
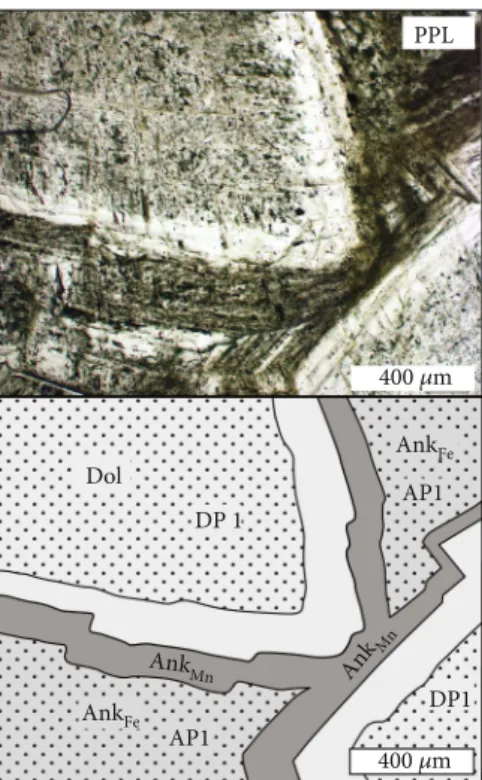
Table1: Petrographic characteristics and microthermometric data of the studied primaryfluid inclusions.
Mineral phases Th(°C) Ti(°C) Tm(ice) (°C) Tm(Hh) (°C)
Salinity
H2O-NaCl-CaCl2 H2O-NaCl
Quartz vein NaCl (mass%) CaCl2(mass%) NaCl (mass%)
Quartz
QP1 88 to 145 −53.7 to−47.8 −26.0 to−21.0 −22.0 to−2.8 15.2 to 22.4 2.6 to 11.7 — QP2 63 to 89 −53.4 to−49.7 −25.3 to−23.1 −13.0 to−3.4 16.0 to 19.4 6.6 to 10.6 — QP3 50 to 77 −56.2 to−50.7 −27.0 to−23.0 −17.0 to−5.2 15.0 to 20.7 5.3 to 11.8 — Quartz-carbonate vein
Quartz
QCP1 54 to 153 −55.2 to−52.4 −25.4 to−22.8 −16.0 to−1.6 16.4 to 21.2 4.8 to 10.6 — QCP2 46 to 82 −52.7 to−47.6 −25.2 to−22.8 −14.0 to−6.7 16.2 to 20.4 5.3 to 10.3 — QCP3 42 to 78 −56.3 to−47.3 −28.0 to−23.8 −25.0 to−6.5 10.3 to 19.1 7.2 to 15.6 — QCP4 47 to 74 −54.1 to−47.7 −25.0 to−21.7 −17.4 to−9.8 15.8 to 23.6 1.6 to 10.1 —
Dolomite DP1 127 to 167 −57.5 to−48.5 −28.6 to−25.5 — — 22.8 to 24.2 —
Ankerite AP1 61 to 109 — −2.5 to−1.6 — — — 2.7 to 4.6
Abbreviations:Th: temperature of homogenization;Ti: temperature of initial melting;Tm(ice): temperature offinal melting of ice;Tm(Hh): temperature of final melting of hydrohalite; QP: primaryfluid inclusions trapped in quartz from quartz veins; QCP: primaryfluid inclusions trapped in quartz from quartz-carbonate veins; DP: primary inclusions trapped in dolomite; AP: primary inclusions trapped in ankerite.
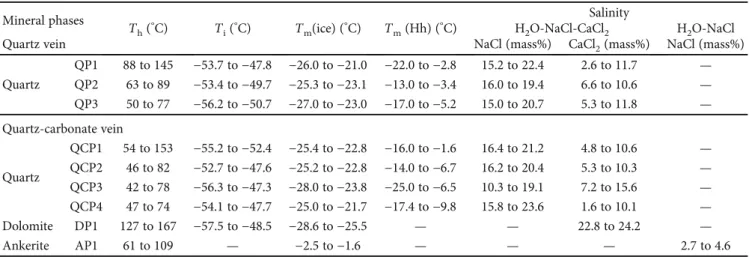
QP1, QP2, and QP3) can be distinguished, corresponding to the temporary sequence of the assemblages (Figure 6).
Along healed microcracks, tiny (<2μm) pseudosecondary and secondary assemblages rarely occur. They contain one-phase liquid, but they are inappropriate for exact microthermometry.
In the QP1 FIA, two-phase (liquid and vapor, L+V, respectively) inclusions are predominant. In the QP2 and QP3 assemblages, one-phase pure liquid (L) and two-phase (L+V) inclusions can be found in nearly equal amounts (Figure S5). Two-phase inclusions are liquid-dominant and theirφvapvalues are in a range of 0.10–0.17 for QP1, while lesser then~0.1 is typical for both QP2 and QP3. Shape of two-phase inclusions is generally irregular. Their size varies in a broad range from 5 to 30μm, while one-phase inclusions usually are smaller in size (5–10μm). Raman spectra acquired at room conditions (Tlab) from vapor and liquid phases of the inclusions indicate that their inclusion fluid is an aqueous-electrolyte solution without any volatile contents.
Regarding the QP1 to QP3 inclusions, ice nucleation occurred at low temperatures and Tn (ice) values varied between −75 and −62°C (Table S4). First melting phase during reheating of the inclusions occurred between −56 and −47°C. Last melting of ice occurred in the presence of salt hydrate crystals (hydrohalite, Hh: NaCl∗2⋅H2O) based on the Raman spectra (Figure S5). Tm (ice) data scatter in a range from−27 to−21°C (n= 37; Tables 1 and S4). Hydrohalite crystals were melted afterfinal ice melting
in each case. The Tm (Hh) values vary in a broad range from −22 to −3°C (n= 20). During heating procedure, the homogenization of the studied inclusions occurred into liquid phase (L+V⟶L) without any exception.
Homogenization temperatures (Th) for QP1 FIA are in a broad interval from +88 to +145°C (n= 18); nevertheless, lower values are observable for QP2 and QP3 FIAs (Th: from +63 to +89°C, n= 10 and Th: from +50 to +77°C, n= 14, respectively; Tables 1 and S4).
4.4.2. Quartz-Carbonate Veins
(1) Quartz-Hosted Fluid Inclusions. Primary (P), pseudose- condary (PS), and secondary (S) FIAs occur in euhedral quartz crystals (Figure 7). Four primary FIAs are arranged along growth zones in the quartz phase (from QCP1 to QCP4, respectively). Besides primary ones, two pseudosecondary (QCPS1 and QCPS2) and one secondary (QCS1) FIAs can be observable. The relative temporary succession of these assemblages is the following:
QCP1⟶QCPS1⟶QCP2⟶QCPS2⟶QCP3⟶QCP4-
⟶QCS1. Two-phase liquid-vapor (L+V) and one-phase liquid (L) inclusions can be found in each primary FIA at room temperature (Tlab). In the QCP1, QCP2, and QCP3 assemblages, two-phase (L+V) and one-phase (L) inclusions can be found in nearly equal amounts but pure liquid (L) inclusions are in a higher proportion in the QCP4 assem- blage. Most of the inclusions are irregularly shaped (Figure S6). Their longest dimension varies between 3 and
QP 1 QP 2 QP 3
2 mm 2 mm PPL
Figure6: Photomicrograph and sketch about the arrangement of primary fluid inclusion assemblages (QP1 to QP3) in a quartz single crystal from a quartz vein (borehole T–5, 60.8 m).
Abbreviation: PPL: plane-polarized light.
QCP3
QCP4 200 휇m
QCS1 QCP4
QCPS2
QCP1
QCP2 QCPS2
QCPS1
PPL
200 휇m
Figure7: Photomicrograph and sketch about the arrangement of fluid inclusion assemblages (primary: QCP1 to QCP4, pseudosecondary: QCPS1 and QCPS2, secondary: QCS1) in a quartz single crystal from a quartz-carbonate vein (borehole Bm– 1, 875.0 m). Abbreviation: PPL: plane-polarized light.
(L) inclusions and their maximal dimensions are in a range of 2–10μm. Based on Raman microscopy of vapor and liquid phases atTlab, each FIA of quartz contains pure aqueous-electrolyte solution without any gaseous/volatile components.
During cryoscopic analyses, nucleation of a vapor bubble can be occurred in many one-phase (L) inclusions during cooling. This phenomenon was observable in each FIA refer- ing to a vapor nucleation metastability that may occur fre- quently in these inclusions. Ice nucleation temperatures are between−86 and−51°C. The initial melting temperature of ice (Ti) occurred between−57 and −47°C in each FIA and most of the measured data are around−52°C. Additionally, Raman microscopy revealed the presence of hydrohalite crystals besides ice (Figure S6). The final melting temperatures of both ice and hydrohalite were measured during reheating procedure in each primary FIA. Last melting of ice occurred in the presence of hydrohalite crystal in each case. Similar melting temperatures are observable in each primary assemblage (QCP1 to QCP4).
Tm (ice) values are between −28 and −21.7°C (n= 39) while Tm (Hh) values are in a broad range from −25 to
−1.6°C (Tables 1 and S4). Two-phase fluid inclusions of the primary FIAs were homogenized into a liquid phase (L+V⟶L) in each case. The broadest range and the highest Th values can be observed in the case of the QCP1 assemblage where the data vary between +54 and +153°C (n= 18). From QCP2 to QCP4, the Th values can be found in a range of ~40–80°C (n= 39).
Nevertheless, in the QCP3 and QCP4 FIAs, more and more values are lesser than +60°C (Tables 1 and S4).
(2) Carbonate-Hosted Fluid Inclusions. In the dolomite phase,fluid inclusions are not arranged along growing zones of the crystals, and inclusions along trails or healed micro- cracks are not observable. The inclusions made continuous clusters whichfill the entire domain to the clear overgrowth band (Figure 8). This latter phase is almost free offluid inclu- sions except few minor (<3μm) ones which are inappropri- ate for microthermometry. The distribution of the studied inclusions follows the crystallographic directions, reflecting their primary origin hencefluid inclusions of dolomite can be classified into one primary originated FIA (DP1). Inclu- sions of DP1 mainly show two-phase (L+V) character (Figure S7) and one-phase (L) inclusions can be found in subordinate amounts. Regular, close to negative crystal- shaped inclusions are dominant but inclusions with an almost irregular shape can also be found among them.
Their size is very variable, and their longest dimension is in a range of 5–20μm. Two-phase inclusions are liquid- dominant and theirφvapare in a range of 0.15–0.2.
Owing to thefluorescence of dolomite, it was extremely difficult to obtain suitable Raman spectra from the inclusions both atTlaband lower temperature also. In a few cases where spectra were collected successfully, the shape of the curve
indicates high-salinity aqueous-electrolyte character of the inclusion fluid without any dissolved volatile components (Figure S7). Ice nucleation temperatures are around
−80°C and first melting occurs between −58 and −49°C.
Last ice melting temperatures are in a range from −29 to
−26°C (n= 10). Salt hydrate crystals were not able to detect visually in the inclusions; however, the Ti values propose the possible presence of this phase during reheating procedure. Since salt hydrate phases were detectable neither visually nor by using Raman signal, the last hydrate melting temperatures were not possible to detect in the FIA. The inclusions were homogenized into the liquid phase (L+V⟶L) during heating, and liquid to vapor homogenization was not observed.
Homogenization temperatures are in a range of 127–
167°C (n= 14; Tables 1 and S4).
In the AnkFephase,fluid inclusions are arranged along growing zones suggesting their primary origin (Figure 8).
They are not separated by inclusion free growth bands;
hence, they can be classified into one primary FIA designated by AP1. The AP1 assemblage contains irregular and negative crystal-shaped inclusions in nearly equal amounts and their size varies in a range of 5–17μm similarly to the DP1 FIA.
At room conditions (Tlab), two-phase (L+V) liquid- dominant (φvap= ~0:12) inclusions are predominant and one-phase (L) inclusions can be found in subordinate amounts. In spite offluorescence of the host mineral, in some cases, suitable Raman spectra were collected at Tlab. The appearance of these spectra indicates low-salinity aqueous-
DP1 Dol
DP 1
400 휇m 400 휇m
AnkMn Ank
Mn
AnkFe AP1
AP1 AnkFe
Figure8: Photomicrograph and sketch about the arrangement of the primary fluid inclusion assemblages (DP1 and AP1) in Dol and AnkFe phases from a quartz-carbonate vein (borehole Bm–
1,875.0 m). Abbreviation: PPL: plane-polarized light; Dol:
dolomite; Ank: ankerite.
electrolyte character of thefluid without any kind of volatile components (Figure S7).
During cooling procedure, ice nucleation occurred around −44°C in each case. First melting temperature was not possible to detect visually or by Raman spectros- copy. Tm (ice) values are in a very narrow range from
−3 to −2°C in each inclusion (n= 10). Besides ice, other phases such as salt hydrate were not observable during reheating. Homogenization of inclusions occurred into a liquid phase (L+V⟶L) between 60 and 110°C (n= 21),
and majority of the data are in a range from 80 to 100°C (Tables 1 and S4).
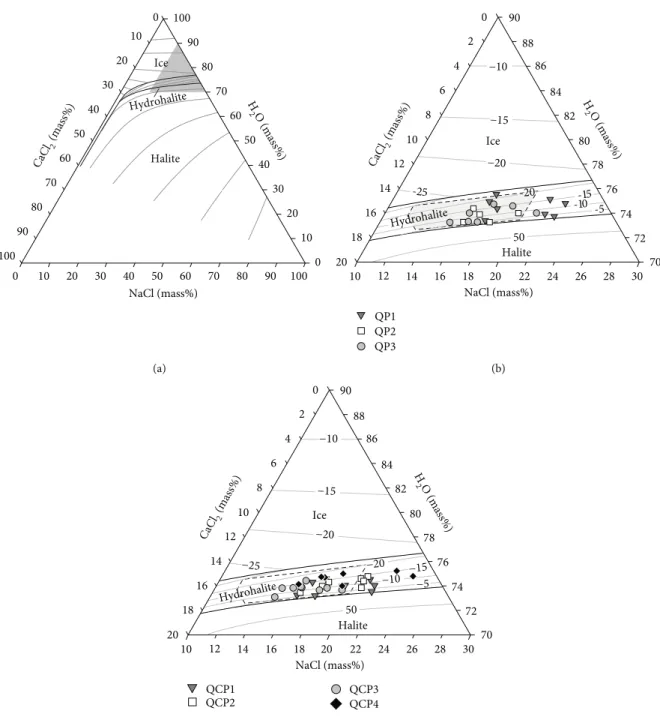
4.4.3. Composition of Inclusion Fluids.The abovementioned narrow range of initial melting temperatures of ice in the QP1 to QP3 and QCP1 to QCP4 FIAs indicates that the ana- lyzedfluids can be modeled by the NaCl-CaCl2-H2O model system (Figure 9, Table 1). In the studied DP1 fluid inclu- sions, last melting temperatures of hydrohalites were not detectable; therefore, the composition of these inclusion
0 10 20 30 40 50 60 70 80 90 100 0 10 20 30 40 50 60 70 80 90 100 0 10 20 30 40 50 60 70 80 90 100
Ice
Halite Hydrohalite
NaCl (mass%) CaCl
(mass%)2
H
2O (mass%)
(a)
NaCl (mass%) CaCl
(mass%)2
H
2O (mass%) 0
10
20
2 4 6 8
12 14 16 18
−10
−15 Ice
−20
-25 -20 -15
-10 -5 50
Halite 88
86 84
82
78 76
74 72
70 80
90
10 12 14 16 18 20 22 24 26 28 30
QP1 QP2 QP3
Hydrohalite
(b)
−10
−15
−20
−25
50
−20 −15
−10 Ice
Halite
−5 Hydrohalite
NaCl (mass%) CaCl
(mass%)2
H
2O (mass%) 0
10
20
2 4 6 8
12 14 16 18
88 86
84 82
78 76
74 72
70 80
90
10 12 14 16 18 20 22 24 26 28 30
QCP1 QCP2
QCP3 QCP4 (c)
Figure9: Salinity calculation of the inclusionfluids. (a) NaCl-CaCl2-H2O ternary phase diagram of the inclusionfluids; shaded triangle indicates the composition of the analyzedfluids. (b) Composition of the primary aqueousfluid inclusions in the quartz FIAs from quartz veins in the NaCl-CaCl2-H2O system. (c) Composition of the primary aqueousfluid inclusions in the quartz FIAs from quartz-carbonate veins in the NaCl-CaCl2-H2O system. For comparison, FI data from vein filling quartz of quartz-carbonate veins of a neighboring crystalline complex (Baksa Gneiss) [16] are also shown (shaded polygon; see discussion in the text).
fluids was calculated from last ice melting temperature data in the H2O-CaCl2 model system. Additionally, high Tm
(ice) values indicate the presence of low-salinity inclusions in the AP1 FIA. Compositions of the related inclusionfluid were calculated in the H2O-NaCl model system (Tables 1 and S4).
Theδ18O values of the mineralizingfluids can be deter- mined using theδ18O values of the dolomite and ankerite phases and the precipitation temperatures determined by fluid inclusion analyses above. Because the primary fluid inclusions of Dol (DP1) and AnkFe(AP1) do not show any evidences of post entrapment modifications, theirThvalues can be interpreted as a minimum formation temperature range of the Dol and AnkFephases. These temperature con- straints were used together with the fractionation equation of Zheng [45] to calculate the oxygen isotope range of the Dol and AnkFe precipitatingfluids, respectively. Neverthe- less, since there was no opportunity for a pressure correction
of Th data, oxygen isotope values of the fluid are slightly underestimated (max. 1–2‰). The calculated δ18O (V- SMOW) values of the parentfluid are in a range from−1.7 to +2.3‰ for DP1 FIA, while the calculated δ18O (V- SMOW) values of the fluid are in a range from −7.3 to
−2.3‰for AP1 FIA (Figure 10).
5. Discussion
5.1. Paleoenvironmental and Paleofluid Features of the Studied Téseny Rocks
5.1.1. Vein Styles and Fluid Fingerprints.Vein-type minerali- zation in the Téseny rocks dominantly forms blocky mor- phological types with inclusion-rich quartz and carbonate crystals, suggesting their potential to contain information about origin and geological relationships of the mineralizing fluids. Two major kinds of fluids can be distinguished: (1)
−20 −18 −16 −14 −12 −10 −8 −6 −4 −2 0
0 50 100 150
−5
−10
−15
−20 0
−1
−4−3
−2
δ18O‰dolomite (V-PDB)
Temperature (°C)
Dol
−20
−15
−10
−5 0
5
10 15 20
−4−3−2−1
−6−7
−8−9
AnkFe δ18O‰
water fluid
(V-SMOW)
−20 −18 −16 −14 −12 −10 −8 −6 −4 −2 0 0
50 100 150 200 250
δ18O‰ankerite(V-PDB)
Temperature (°C)
δ18O‰
water fluid
(V-SMOW)
Figure 10: Calculated δ18O values of the fluids entrapped in Dol and AnkFe using Th data of the DP1 and AP1 FIAs, respectively.
Fractionation equation of Hilgers and Urai [46] was used during calculations. (a)δ18Odolomite versus temperature for variousδ18Owater values. (b)δ18Oankeriteversus temperature for variousδ18Owatervalues. The curved lines represent constantδ18O values (V-SMOW) for waterfluid.
quartz- and carbonate (dolomite)-hosted high-salinity aque- ousfluids, and (2) carbonate (ankerite)-hosted low-salinity ones. The presented data suggest a paleohydrological communication between the crystalline basement and the overlying Téseny sedimentary rocks (see Figure 9) [17–19].
Therefore, the studied cross-formational fracture-vein sys- tems can be interpreted as region-specificfluid mobilization events. As a novel approach, specific characteristics of the studied blocky veins (e.g., alteration and mineralization types, fluid compositions) in the study area are used for regional reconstructions (see discussion parts below).
Thinfibrous, stretched, and polytextured veinlets appear only in subordinate amounts in the study area; hence, their correlative merit is insignificant. Bedding-parallel veins of fibrous calcite and rare quartz, corresponding to the“beef” or “cone-structure” with sinusoidal inclusions [46, 47], reflect the diagenetic environment. The Pennsylvanian coal- bearing Téseny Sandstone is a mature/over mature source rock with a vitrinite reflectance of ~3.35% [23]; therefore, horizontal fractures could be a result of high porefluid pres- sures during burial alteration of organic matter (hydrocarbon generation) [47].
5.1.2. Possible Correlation within the Tisia: Pennsylvanian Continental Records. In the Békés Unit (Figure 1), within the Hungarian part of the Tisia, several deep wells with inter- mittent coring near the town of Szeged (Great Hungarian Plain, AlgyőBasement High) penetrated greenish gray rocks described as Carboniferous breccia [30]. This breccia unit contains randomly oriented angular mica schist, gneiss, and quartzite fragments (up to 10 cm in diameter) in a mica- rich matrix. Tentatively, these fossil-less rocks were regarded as continental deposits which are tectonically covered by a Triassic sedimentary succession [30, 48]. According to the detailed investigations, a network of darkfine-grained veins was also observed and these rocks were reconsidered as ultra- cataclasites. Therefore, the breccia was redefined as a tecto- nized part of the crystalline basement [48].
Both the fractured metamorphic basement rocks and the overlying Triassic sequences are hydrothermally altered, con- taining veinlets and dissolution vugs partiallyfilled by saddle dolomite [49–51]. Under cathodoluminescence microscope, saddle dolomite crystals exhibit a marked zonation, whereas fluorescence microscopy reveals that significant part of the saddle dolomite crystals contains primary petroleum- bearing aqueous inclusion assemblages. Microthermometry performed on saddle dolomite-hosted FIAs suggests the pres- ence of hot (135–235°C) and moderately saline brines (4–9 eq. mass% NaCl) during the precipitation [50]. This post- Middle Triassic vein generation differs from the dolomite- bearing veins in this paper. Therefore, there is no way to give an extensible correlation for Téseny rocks eastwards.
Southwards, in Croatia, the Slavonian Mountains (Figure 1) represent rare basement outcrops of the Tisia where three tectono-metamorphic complexes can be defined:
Psunj, Papuk, and Radlovac Complexes [52–54]. The Radlo- vac Complex consists of very low- to low-grade metamorphic sequences largely composed of metapelites (slates and subor- dinate phyllites), metapsammites (metagraywackes), and
metaconglomerates deposited in a shallow marine environ- ment [54, 55]. In slates from the outcrop at Mt. Papuk, corre- sponding to the middle part of the metamorphic sequences, a Carboniferous (Westphalian) macroflora was reported [56].
It consists of Asterophyllites, Pecopteris, Neuropteris, and Cordaites plant assemblage. Therefore, representing similar developments, these metasedimentary rocks were tentatively correlated with the Téseny Sandstone Formation [30, 57].
The petrography and geochemistry of the Radlovac Complex, including provenance of the Pennsylvanian metap- sammites, was extensively characterized in the last few years [54, 58, 59]. According to these authors, the most common metasedimentary rocks of the Radlovac Complex are fine- grained metapelites (more than 70% matrix) and moderately sorted metapsammites (less than 40% matrix). Both groups have similar mineral composition with dominant quartz, illite-muscovite, chlorite, and plagioclase, subordinate K- feldspar, paragonite, hematite, and rare carbonate minerals.
Complex heavy mineral (monazite, xenotime) analyses sug- gested that one major source for the Radlovac Complex metasedimentary rocks was felsic igneous rocks of Variscan age. Additionally, the bulk chemistry for both metapelites and metapsammites pointed to felsic igneous rocks as proto- liths, corresponding to the continental island arc geotectonic environment [54].
A dominant felsic protolith source is in good correlation with the provenance of the Téseny Sandstone, but this latter succession has a more immature framework composition with significant amounts of acidic volcanic and metamorphic rock fragments [21, 24]. In comparison whole-rock geo- chemical data of the Téseny Sandstone samples [21–24] with the published data from the Pennsylvanian metapsammites of the Slavonian Mts [54], a difference between their geo- chemical fingerprints is also obvious (Figure 11). The rock and mineral fragments in the Téseny sands and conglomer- ates were identifiable as coming from three sources: (1) a recycled Variscan orogenic area (collision suture and fold- thrust belt), indicated by the presence of metamorphic and sedimentary lithic fragments; (2) an uplifted plutonic (gran- ite-gneiss) basement; and (3) an old (probably Variscan) magmatic arc, indicated by the lesser amounts of siliceous volcanic rocks [21, 24]. Thesefindings strongly suggest that the depositional basin of the Téseny rocks was spatially and/or temporally isolated from the Radlovac sedimentary basin in South Tisia.
5.1.3. Paleofluid Fingerprint of the Hungarian Part of W Tisia (Mecsek–Villány Area).The distinct nature of the Pennsylva- nian coal-bearing succession in the Slavonia–Drava Unit led to its paleohydrological comparison with the adjacent crys- talline basement blocks (W Tisia; Figures 1 and 3). Within it, the Baksa Complex is the likely main source area for gneiss/metagranitoid and mica schist clasts from Téseny sed- iments. Additionally, crystalline plutonic rocks together with microgranite dikes in the Mórágy Complex (Kunság Unit, Mórágy Subunit) represent the principal fine-grained plu- tonic source (Téseny aplite clasts) that fed the Pennsylvanian sedimentary basin during deposition of the Téseny Sand- stone Formation [24].
In the polymetamorphic rock body of the Baksa Complex (Figure 3), a well-developed fracturefilling networkfilled by Ca-Al-silicate minerals and/or sulfides (Fe-Zn-Pb; domi- nantly pyrite and sphalerite) was documented by previous authors [61–63]. In the silicate-rich paragenesis, clinopyrox- ene-dominant, epidote-dominant, and feldspar-dominant vein types were distinguished [17–19], following by quartz- carbonate (dolomite, calcite) veins in a later mineralization stage [16, 17].
A detailed investigation [17–19] revealed a characteristic diopside⟶epidote±clinozoisite⟶sphalerite⟶albite±K- feldspar⟶chlorite±adularia±prehnite⟶pyrite⟶calcite (calcite1+calcite2+calcite3) fracture filling mineral succes- sion, reflecting propylitic affinity during the older hydrother- mal events. Data from microthermometry of primaryfluid inclusions in diopside (Th: 276–362°C) and epidote (Th: 180–360°C) together with their nearly identical salinities (0.7–2.9 and 0.2–1.2 eq. mass% NaCl, respectively) indicated that the corresponding mineralization occurred in a same high-temperature and low-salinity fluid environ- ment [17, 19]. Unfortunately, there are not any fluid inclusion data from related feldspar phases.
The Ca-Al-silicate mineralization events also resulted in disseminated and vein-style sulfide mineralization in the Baksa Complex [17, 62, 63]. The veins which vary in thick- ness from 0.1 to 7 cm contain dominantly of common sul- fides (pyrite, marcasite, pyrrhotite, sphalerite, chalcopyrite, galena, pentlandite, and covellite) and small amounts of quartz; additionally, rare hematite also occurs [62, 63]. Fluid inclusion studies of vein filling quartz crystals (Th: 235–
295°C and 3.5–5.1 eq. mass% NaCl) indicated a postmag-
matic hydrothermal origin during cooling of a hydrothermal system [63].
Additionally, the crystalline host rocks (gneiss, mica schist) of the Baksa Complex are strongly altered, exhibiting extensive epidotization, chloritization, albitization, and seri- citization [18, 61]. The pervasive hydrothermal leaching caused significant secondary porosity (cavities) in the altered domains which was partiallyfilled by albite and epidote, and the total lack of the quartz phase is a characteristic feature of the metasomatized rocks. Fluid inclusions of cavity filling epidote show a similar character (Th: 180–360°C; salinity:
0.2–1.6 eq. mass% NaCl) that can be found in the Ca-Al- silicate veins [18].
In the Baksa Complex, development of calcite was char- acterized by filling the remaining pore space in the Ca-Al- silicate veins (first and second populations of calcite) and for- mation of crosscutting veins (second and third populations of calcite). Microthermometry of primary inclusions of the subsequent calcite1 and calcite2 generations (Th: 75–124°C, 17.5–22.6 eq. mass% CaCl2 andTh: 106–197°C, 2.9–6.3 eq.
mass% NaCl, respectively) reflects a significant change in the evolution of the vein system [19]. Based on the high salin- ity and low Th range of the earliest calcite, this carbonate phase was precipitated from downward-penetrating sedi- mentary brines or from descending meteoric water that infil- trated through evaporite bodies [17, 19]. This interpretation was also supported by low values of the calculated fluid δ18O (−13 to−4‰, V-SMOW). Calcite in the Ca-Al-silicate veins, therefore, can represent the subsequentfluid circula- tion that led to precipitation of quartz, dolomite, and calcite in the quartz-carbonate veins [19].
La
Th Sc
OIArc
CIArc Sc Zr/10
PM
ACM Th
Zr/10 Co
OIArc
OIArc CIArc
CIArc ACM
ACM
+ PM PM
Téseny Sandstone Radlovac metapsammites
Figure11: Ternary discrimination diagrams [60] display the compositional trends among the Téseny and Radlovac Pennsylvanian samples and confirm that these sediments were dominantly derived from different provenance areas. Data come from [24, 54], respectively.
![Figure 1: Regional geology. Simpli fi ed map of Variscan basement areas in W and Central Europe [1, 8] and geologic framework of the Carpathian – Pannonian area [1, 4]](https://thumb-eu.123doks.com/thumbv2/9dokorg/782257.36070/2.899.81.830.107.776/regional-variscan-basement-central-geologic-framework-carpathian-pannonian.webp)
![Figure 2: Speculative paleogeographic position of the Tisia. (a) Paleogeographic reconstruction for the Early Carboniferous [5]](https://thumb-eu.123doks.com/thumbv2/9dokorg/782257.36070/3.899.216.675.103.902/figure-speculative-paleogeographic-position-tisia-paleogeographic-reconstruction-carboniferous.webp)
![Figure 3: Local geology. (a) Generalized geologic map of the Mecsek – Villány area, S Hungary, showing the pre-Neogene basement formations [4]](https://thumb-eu.123doks.com/thumbv2/9dokorg/782257.36070/5.899.125.774.106.773/figure-generalized-geologic-villány-hungary-neogene-basement-formations.webp)

![Figure 11: Ternary discrimination diagrams [60] display the compositional trends among the Téseny and Radlovac Pennsylvanian samples and con fi rm that these sediments were dominantly derived from di ff erent provenance areas](https://thumb-eu.123doks.com/thumbv2/9dokorg/782257.36070/14.899.144.757.105.471/ternary-discrimination-compositional-radlovac-pennsylvanian-sediments-dominantly-provenance.webp)
