DOI:10.28974/idojaras.2019.4.6
IDŐJÁRÁS
Quarterly Journal of the Hungarian Meteorological Service Vol. 123, No. 4, October – December, 2019, pp. 501–519
Methodology for deriving synthetic meteorological droughts and its application for Budapest
Ognjen Gabrić*,1 and Jasna Plavšić 2
1University of Novi Sad, Faculty of Civil Engineering Subotica Department of Hydraulic and Environmental Engineering,
Kozaračka 2a, 24000 Subotica, Serbia
2University of Belgrade, Faculty of Civil Engineering Belgrade Department of Hydraulic and Environmental Engineering
Bulevar kralja Aleksandra 73, 11000 Beograd, Serbia
*Corresponding Author E-mail: ogabric@gf.uns.ac.rs
(Manuscript received in final form November 13, 2018)
Abstract⎯ In the recent years, nearly every part of Central Europe and the Balkans has experienced periods of reduced precipitation that can lead to droughts. Because of the complexity of the phenomenon and the different points of view from which the problem can be studied, it is difficult to decide when the drought started or when it ended. This paper presents a methodology for a stochastic analysis of meteorological droughts. This method is applied to precipitation and temperature data observed at a meteorological station of Budapest for the period of 1900–2000. The drought is defined as a consequence of a combined effect of temperature and prolonged dry period – consecutive days with daily precipitation below a chosen threshold for precipitation. The statistical analysis of the maximum meteorological droughts is performed by means of the peaks-over-threshold (POT) method. The proposed methodology provides probability distributions of the magnitude of droughts in terms of dry period duration and air temperatures, which can then be used to formulate synthetic design droughts for selected return periods.
Key-words: Budapest, drought, stochastic process, synthetic design drought, peaks-over- threshold (POT) method
1. Introduction
There are many different definitions of drought. Roughly, droughts can be defined as the temporary reduction in the rainfall, runoff, and soil moisture amounts, and they are related to the climatology of the region (Sen, 2015). Usually, the reduction in rainfall is referred to as a meteorological drought. Although there is no universal definition of drought, partly because of the complexity of the phenomenon and partly because of the point of view from which the problem is studied (hydrological, geological, environmental, agricultural, etc.), droughts can be classified into four categories (Mishra and Singh, 2010): meteorological, agricultural, hydrological, and socio-economic droughts. Lack of precipitation is the main cause of drought which leads to runoff deficit, soil moisture deficit and, at the end, to the food deficit.
From the beginning of the 16th century until the mid-18th century, summer weather was fairly warm and wet (Rácz, 1999). The trend of summers becoming drier made its appearance in the last third of the 18th century and continued until the 1860s. Summers became again wet in the last third of the 19th century, and a drier period commenced again at the turn of the 20th century. Wet summer weather prevailed again from the 1910s through the 1970s, and this trend ended when dry summers made a comeback in the 1980s and 1990s.
Up to the authors’ best knowledge, there were four great droughts in Hungary in the medieval time (1474, 1479, 1494, and 1507) (Kiss and Nikolić, 2015). The long-lasting severe shortage of precipitation resulted in extremely low water levels of major rivers, border security problems, harvest failures, severe food shortage, and danger of mass extinction of domestic animals.
Droughts are a recurrent feature of Hungary’s climate and can cause substantial damages to the nation’s agriculture (Wilhite and Svoboda, 2000). It is estimated that 36% of all agricultural losses are caused by drought, followed by hail, floods, and frosts.
There is a wide range of methods used to describe drought, and new ones are being introduced depending on the purpose of analysis. Some of them are Palmer indices, standardized precipitation index (SPI), De Martonne index, Palfai aridity index (PAI), and regional models like REMO and ALADIN (Blanka et al., 2013).
This paper analyzes meteorological droughts during the growing season (from April 1 to September 30) for the meteorological station of Budapest. The analysis is based on precipitation and temperature data published on the website of the Hungarian Meteorological Service (OMSZ) for the period of 1901–2000 (“CLIMATE DATA SERIES / BUDAPEST,” n.d.). The applied method is primarily intended for the needs of agriculture and meteorology, and it was developed by Fabian and Zelenhasic (Fabian, 2015; Fabian and Zelenhasic, 2016). The methodology is based on the stochastic processes and probabilistic assessment of the number and magnitude of droughts, where the drought is considered to be a consequence of a combined effect of prolonged dry periods and
high air temperatures. Dry periods are defined as consecutive days with daily precipitation below a chosen threshold for precipitation. Also, only dry periods with a duration exceeding the certain temporal threshold are considered in the methodology. The precipitation and duration thresholds can be selected to describe critical conditions for crops of interest. The proposed methodology provides probability distributions of the magnitude of droughts in terms of dry period duration and air temperatures, which can then be used to formulate synthetic design droughts for selected return periods.
The original methodology by Fabian and Zelenhasic (Fabian and Zelenhasic, 2016) proposed three probability functions to describe the magnitude of meteorological droughts: (1) double exponential distribution with two parameters, (2) adjusted empirical distribution, and (3) polynomial of degree 4. In this paper, a modification of the methodology is adopted so that the statistical analysis of the maximum meteorological droughts is performed by means of the peaks-over- threshold (POT) method (Plavšić, 2007; Todorovic and Zelenhasic, 1970;
Vukmirović and Petrović, 1998, 1997), which considers all extreme values of the meteorological droughts that exceed a given threshold. Generally, this is an advantage of this method over the annual maxima method, with which only the annual maximum values are included in the statistical analysis, thereby neglecting the fact that there can be more than one extreme value in some year that exceeds annual maxima in other years. The proposed methodology for describing the meteorological droughts was applied in a previous paper (Gabrić et al., 2017) to two meteorological stations in Vojvodina, the northern part of Serbia, but with a shorter data record of about fifty years.
2. Methodology
Definition of meteo-drought
The meteorological drought, or meteo-drought, Z (day°C), is defined here as the product of drought duration, D (days), and mean air temperature over the drought duration T (°C) (Fabian and Zelenhasic, 2016):
∙ . (1)
The drought duration is the duration of a dry spell in which days with precipitation smaller than a certain threshold are treated as dry days. In this study, a threshold of 5 mm is selected, because such a small amount of precipitation is insignificant for the roots of most crops. It is also assumed that dry spells lasting for 25 or more days are critical for crops, so a 25-day period is adopted as the threshold for drought duration.
The stochastic process of the meteorological droughts is conceived as a
beginning of meteo-drought τb, time of the end of meteo-drought τe, drought duration D = τe – τb, mid-point τ = (τb + τe)/2, mean air temperature T throughout the drought duration, meteo-drought ∙ , total number k of meteo-droughts in growing season (k = 0, 1, 2,...), and ordinal number n of meteorological drought in growing season (n = 1, 2, 3,..., k). Of particular interest is the greatest meteorological drought in growing season (Zam), X=Zam=sup{Zn, n=1, 2,…,k}, the distribution of which provides an assessment of design droughts, and which is the subject of this paper. With the described setup, it is also possible to analyze distributions of other variables, such as the time of occurrence τX of the greatest meteorological drought X.
Distribution of the maximum meteo-drought
To obtain the distribution of the greatest meteo-drought in the growing season, the peaks-over-threshold (POT) framework is used. This framework is based on the analysis of all extreme events that exceed the certain threshold within a fixed time interval. In this context, both the number of events and their magnitude are random variables. The statistical analysis of meteo-droughts within this framework is performed in three steps: (1) fitting the distribution of the number of exceedances of meteo-drought over the chosen threshold during the growing season, (2) fitting the distribution of the meteorological drought exceedances, and (3) combining the two above-mentioned distributions into the distribution of the greatest meteorological drought in the growing season.
2.2.1. The POT theoretical model
The number of meteo-droughts, k, in the growing season is a discrete random variable with a probability mass function
. (2)
The Poisson distribution is the most frequently used distribution for the number of exceedances above a threshold. Alternatively, binomial and negative binomial distributions can also be used. Theoretical distribution for the number of exceedances can be chosen based on the value of the dispersion index I, defined as the ratio between the variance and mean of k: for the Poisson distribution I = 1 (in practice the Poisson distribution is a good fit for 0.8 < I < 1.2), for the binomial distribution I < 1, and for the negative binomial distribution I > 1. Generally, the number of meteo-droughts decreases with increasing threshold the and consequently the number of years in which no meteorological droughts occur in the growing season increases.
The exceedance of meteo-drought Z over the chosen threshold Zb is a continuous random variable defined as − . Cumulative distribution function of the exceedances, H(u), is given with:
= − = ≤ . (3) Different theoretical distributions can be used to fit the distribution of
exceedances. The most commonly used are the exponential, Weibull, and general Pareto distributions. In this study, exponential and Weibull distributions are considered.
The annual maximum meteo-drought during the growing season is a random variable Z, defined as the maximum of a random number k of exceedances U in the growing season:
= , = 1,2, … , = + ; = 1,2 … . (4)
The cumulative distribution function of the annual maximum meteo- droughts, F(z), is given with:
( ) = { ≤ }, (5)
and is defined only for the values of z above the threshold, i.e. for z > Zb. The general expression for F(z) is derived by combining the distributions of the number and magnitude of exceedances (Todorovic, 1970):
( ) = +∑ ( − ) . (6)
Depending on the type of distribution for the number of exceedances and type of distribution for the magnitude of exceedances, the above general expression can be simplified. For the Poisson-Weibull combination, the above equation reduces to:
( ) = exp − exp − , (7)
and for the binomial-Weibull combination one obtains:
( ) = 1− exp − . (8)
In the last two equations, λ is the parameter of the Poisson distribution, p and m are the parameters of the binomial distribution, and and are the parameters of the Weibull distribution. Equations for the combination of the same discrete distributions with the exponential distribution for the exceedances are obtained for = 1.
2.2.2. The empirical distribution of the maximum meteo-drought
The number of droughts within the growing season depends on the threshold set for the duration of the dry spell. Over the record of N years, some years may not contain any meteo–droughts during the growing season. From the statistical point of view, a sample of N experiments in which only the values exceeding the given detection threshold are recorded, while the values below the threshold are not recorded, is referred to as the censored data sample. A distribution of the censored data sample is obtained from the total probability theorem considering the probability p0 that a recorded value would be below the threshold. If N' out of N experiments yield data above the detection threshold, then:
= . (9)
If G(z) denotes the conditional distribution function obtained from N' data values above the detection threshold, the unconditional distribution function is then given with:
( ) = + (1− ) ( ). (10)
Similarly, the empirical distribution function of the greatest meteo-drought in the growing season is then estimated with:
( ) = + (1− )⋅ ( ), (11)
where is the empirical distribution of the observed droughts that have a duration longer than the chosen threshold. When fitting the distribution of N' maximum droughts, the Weibull plotting position formula is used:
( ) = , = 1,2, … , , (12)
where N' is the number of years with at least one meteo-drought, and i is the rank of data in the ordered sample of N' data.
Distributions of the maximum drought duration and maximum mean drought temperature
Drought duration, D, and mean air temperature, T, of a meteorological drought are also random variables. Their distributions are needed to construct design meteo-droughts for the selected probability of occurrence. Analysis of maximum duration D or temperature T is performed here also by means of the peaks-over-
threshold method, analogously to identifying the distribution of the maximum meteo-droughts Z in the growing season.
Deriving design meteo-droughts
A design meteo-drought is the meteo-drought of a given probability of occurrence or return period R, obtained from the distribution of maximum meteo-droughts as the quantile ZR for the probability of exceedance of 1/R. Since the meteo-drought is the product of duration D and temperature T, the drought with the magnitude ZR might occur with different combinations of durations and temperatures. Fabian and Zelenhasic (Fabian and Zelenhasic, 2016) proposed to consider two combinations of duration and temperature that lead to the drought ZR: (1) duration DR of return period R and the corresponding temperature = / , and (2) temperature TR of return period R and the corresponding duration = / . Geometrically, these values define two rectangles shown in Fig. 1. Average rectangle ABCD, representing the R-year design meteo-drought, is obtained from the condition that the areas of two grey rectangles, A1 and A2, are equal. It can be shown that the sides Dd and Td of the average “design” rectangle are equal to:
= , = (13)
Fig. 1. Construction of the R-year design meteo-drought as proposed by Fabian and Zelenhasić (Fabian and Zelenhasic, 2016)
Application of the methodology
The practical application of the methodology for developing distribution of the maximum meteo-drought during the growing season includes three steps: (1) a preliminary analysis with statistical tests that are applied to the available data sets to test their randomness and homogeneity, (2) an identification of the distribution of the meteorological droughts Z, (3) an identification of distributions of drought duration D and mean temperature T, and (4) construction of the synthetic meteo- droughts.
To demonstrate the methodology, mean daily temperature and daily precipitation data from a meteorological station in Budapest (from 1900 – 2000) are used.
Fig. 2 presents the series of the mean annual temperature and Fig. 3 presents the annual precipitation for Budapest, as well as the corresponding series for the growing season, which begins on April 1 and ends on September 30. Figures show that the annual series exhibit some persistence.
The sample for the statistical analysis is created by extracting the drought events and their parameters during the growing season in each year of observations. The threshold for the drought duration is set at 25 days.
Fig. 2. Mean annual and growing season temperatures
Fig. 3. Annual and growing season precipitations
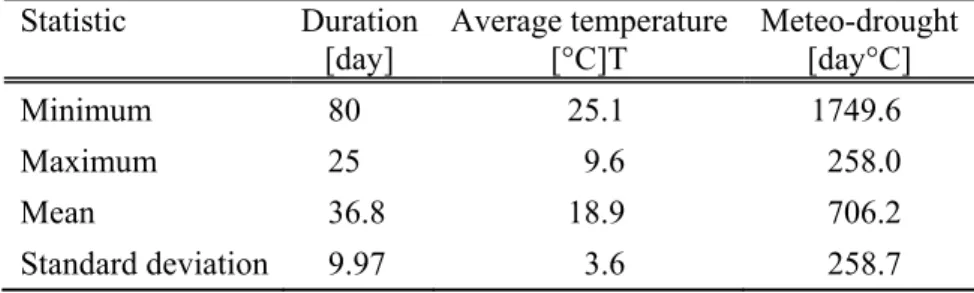
A total number of extracted meteo-droughts is 141. Table 1 shows some basic characteristics of the extracted drought events.
Table 1. Basic characteristics of 141 meteo-drought events Statistic Duration
[day]
Average temperature [°C]T
Meteo-drought [day°C]
Minimum 80 25.1 1749.6
Maximum 25 9.6 258.0
Mean 36.8 18.9 706.2
Standard deviation 9.97 3.6 258.7
Tests for homogeneity and randomness
The POT framework assumes that the sample consists of independent and identically distributed variables, and therefore, the appropriate statistical tests need to be undertaken to confirm these assumptions.
We applied the statistical tests of homogeneity to the annual mean temperature series and annual precipitation series and found that the hypothesis on homogeneity should be rejected. We also conducted the same tests for mean
temperatures and precipitation sums during the growing season. With these series we rejected the hypothesis on homogeneity of mean temperatures, but we could not reject it for precipitation in the growing season at the 5% significance level.
The series of durations of extracted meteo-droughts and its mean temperatures are also tested for homogeneity, and we found that we could not reject the homogeneity hypothesis at the 5% significance level. The same conclusion was made after testing durations of dry periods in the growing season, and we concluded that the homogeneity assumption is valid for our analysis.
The sample of extracted meteo-droughts is tested for homogeneity by two nonparametric tests (Mann-Whitney and Kolmogorov-Smirnov tests). The runs test is applied to test the randomness of sample data (Sheskin, 2004), and Bartlett’s test is used to test independence by testing the lack of serial correlation. All tests are applied at the 5% significance level.
For the homogeneity testing, original samples were split into two subsamples of similar size. Both Mann-Whitney and Kolmogorov-Smirnov tests have shown that the null hypothesis of homogeneity of the sample cannot be rejected at the 5% significance level (Table 2). The runs test has confirmed the assumption of randomness of data. The hypothesis of data independence is also confirmed by the Bartlett’s test.
Table 2. Results of homogeneity and randomness tests
Test Value of test statistic Critical region of test statistic at the 5% significance level
Mann-Whitney U = -0.13 |U| > 1.96
Kolmogorov- Smirnov D = 0.091 D > 0.229
Runs test U = -0.04 |U| > 1.96
Bartlett’s test
r1 = -0.150 r2 = 0.073
r3 = -0.005 |rk| > 0.170
3. Results and discussion
Distribution of meteo-droughts
In the process of fitting distributions of the number and magnitude of meteo- droughts, several different thresholds Zb are assumed. Based on goodness of fit and visual inspection of probability plots, the threshold value for meteo-droughts of Zb = 450 day°C was selected (Fig. 4). The results shown in this section are the results for the selected threshold.
Fig 4. Observed meteo-droughts against probability plots for different Zb
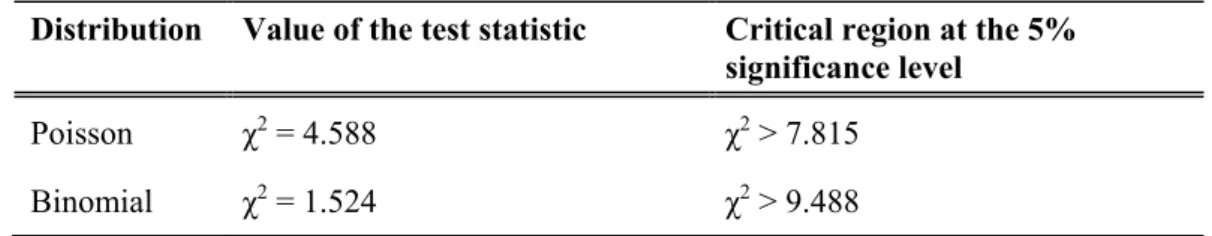
The number of meteo-droughts during the growing season that exceeds the chosen threshold is fitted with the Poisson and binomial distributions, because the dispersion index for all samples in this study was smaller than 1. Both binomial and Poisson distributions showed a good fit with the empirical distributions of the observed samples (Fig. 5). The application of the χ2 test has shown that none of the theoretical distributions can be rejected at the 5% significance level, as shown in Table 3. The binomial distribution is in better accordance with the observed data. Fabian and Zelenhasic (Fabian and Zelenhasic, 2016) showed that the Poisson distribution can be used for distribution of exceedances. On the other hand, there are cases (Gabrić et al., 2017) where only binomial distribution provides a good fit with the observed data.
Table 3. Chi-square test results for the number of exceedances (α=5%)
Distribution Value of the test statistic Critical region at the 5%
significance level Poisson χ2 = 4.588 χ2 > 7.815
Binomial χ2 = 1.524 χ2 > 9.488
Fig. 5. Distribution of the number of exceedances of meteo-droughts above the threshold Zb = 450 day°C.
The exceedances of meteo-droughts above the chosen threshold are fitted with the exponential and Weibull distributions (Fig. 6). The goodness-of-fit testing is carried out by the Cramer-von Mieses and Kolmogorov-Smirnov tests at the 5% significance level (Table 4). Unlike the results for Vojvodina in the previous paper (Gabrić et al., 2017) where both exponential and Weibull distributions could be used as theoretical distributions, for the Budapest data in this paper only the Weibull distribution can be accepted as the model for the meteo-drought exceedances. Fabian and Zelenhasic (Fabian and Zelenhasic, 2016) tried several solutions, including double exponential distribution, “by eye”
adjusted empirical distribution, and 4th degree polynomial as the distribution of exceedances obtained by the Lagrange interpolation formula. Only the 4th-degree polynomial passed the Kolmogorov-Smirnov test.
Table 4. Goodness of fit results for exceedances of meteo-droughts over the threshold of Zb = 450 day°C
Distribution Value of the test statistic Critical region at the 5%
significance level Cramer-von Mieses test
Exponential ω2 = 0.643
ω2 > 0.462
Weibull ω2 = 0.040
Kolmogorov-Smirnov test
Exponential D = 0.134
D > 0.125
Weibull D = 0.046
Fig. 6. Distribution of exceedances of meteo-droughts over the threshold of Zb = 450 day°C
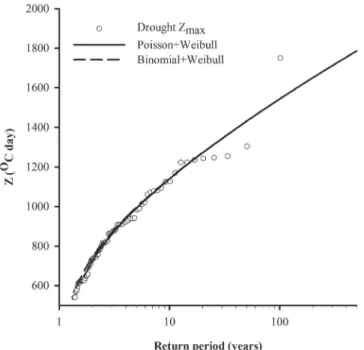
The distribution of the maximum meteo-drought in the growing season is obtained by combining the distributions of a number of exceedances and magnitude of exceedances over the threshold. For the Budapest data in this paper, the binomial-Weibull and Poisson-Weibull distribution combinations are used, since the exponential distribution was rejected by the goodness-of-fit tests. The
derived distribution of the maximum of meteo-drought is compared to the empirical distribution of the observed annual maxima. Since there were also years with no meteo-droughts lasting at least 25 days, the conditional probability model in Eq.(12) was used to establish the empirical distribution of the annual maximum meteo-droughts. The empirical and two theoretical distributions of maximum meteo-drought for Budapest are shown in Fig. 7, while the results of the goodness-of-fit tests are given in Table 5. Although the binomial distribution is a better fit for the number of exceedances, both combinations yield very similar distributions of the maximum meteo-drought in the growing season. The greatest differences between the binomial-Weibull and Poisson-Weibull models are smaller than 5 years for the return periods.
Fig. 7. Distribution of the maximum meteo-drought in the growing season in Budapest
Table 5. Goodness of fit results for the maximum meteo-droughts in the growing season in Budapest
Distribution Value of the test statistic
Critical region at the 5%
significance level Cramer-von Mieses test
Poisson+Weibull ω2 = 0.022
ω2 > 0.462 Binomial+Weibull ω2 = 0.060
Kolmogorov-Smirnov test
Poisson+Weibull D = 0.039
D > 0.136 Binomial+Weibull D = 0.065
Design meteo-droughts
A prerequisite for the construction of design meteo-droughts are the distributions of maximum drought duration (D) and maximum mean air temperature during the drought (T). To obtain these two distributions, the POT method is applied in the same manner as for the meteo-droughts. The adopted threshold for the duration is Db = 25 days, and for the mean air temperature it is Tb = 9.5 oC. The binomial- Weibull and the Poisson-Weibull combinations are used as theoretical distributions (Figs. 8 and 9). Again, the differences between the two models are negligible.
Fig. 8. Distribution of drought duration for droughts longer than 25 days
Fig. 9. Distribution of the mean air temperature during droughts longer than 25 days
Finally, the binomial-Weibull distribution combination is adopted for the maximum meteo-droughts, for the maximum drought duration, and for the maximum mean air temperature. As seen in previous figures, differences between the binomial-Weibull and the Poisson-Weibull distribution combinations are minimal. Since the binomial distribution follows the number of exceedances slightly better than the Poisson distribution does, the binomial-Weibull distribution is adopted.
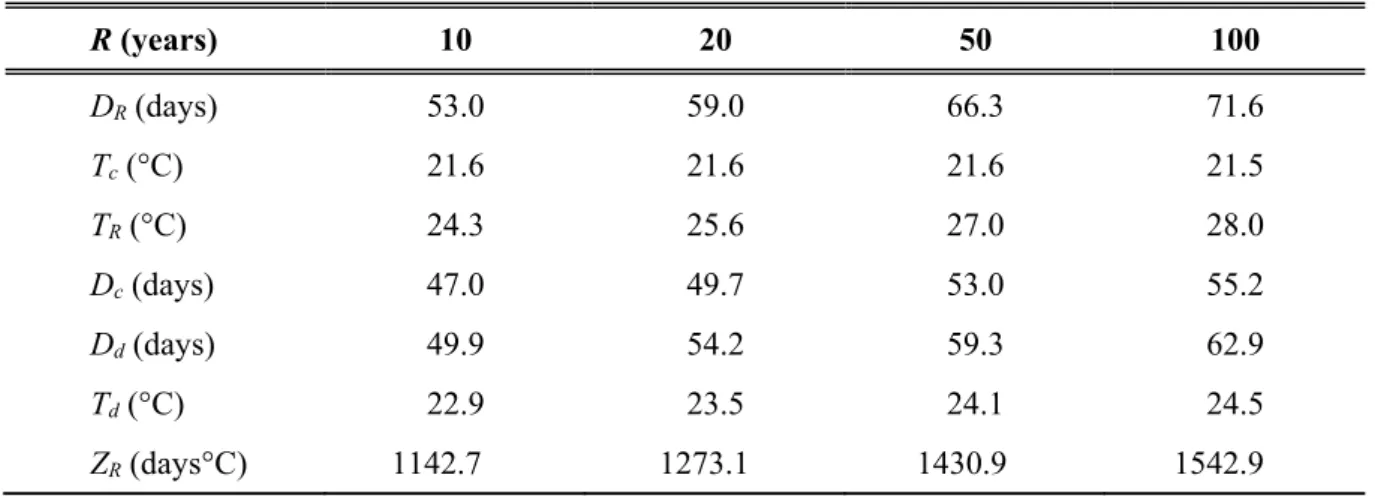
With the adopted theoretical distributions, design meteo-droughts for return periods of 10, 20, 50, and 100 years are determined and presented in Table 6 as explained in Section 2.4.
Table 6. Synthetic meteo-droughts for Budapest
R (years) 10 20 50 100
DR(days) 53.0 59.0 66.3 71.6
Tc(°C) 21.6 21.6 21.6 21.5
TR(°C) 24.3 25.6 27.0 28.0
Dc(days) 47.0 49.7 53.0 55.2
Dd(days) 49.9 54.2 59.3 62.9
Td(°C) 22.9 23.5 24.1 24.5
ZR (days°C) 1142.7 1273.1 1430.9 1542.9
In Table 6, Dd, Td, and ZR denote design drought duration, mean temperature, and their product, respectively; another notation is explained in Fig. 1.
Graphical representation of synthetic meteorological drought with a return period of 100 years is shown in Fig. 10.
Fig. 10. Synthetic meteo-drought of the 100-year-return period
4. Conclusion
This paper analyzes the phenomenon of occurrence of meteorological droughts during the growing season for a meteorological station in Budapest, with droughts defined as the product of dry period duration and mean air temperature during the drought. The peak-over-threshold (POT) method was applied for estimating the theoretical distributions of the maximum meteorological drought, dry period duration, and the mean air temperature during the drought. This method gives probabilistic estimation of extreme droughts over the growing season, and it is not intended to produce estimations for specific months. The droughts with a duration longer than 25 days are considered and a value of 450 day°C is adopted as a threshold value for meteorological drought. This threshold does not eliminate all droughts from the spring and late summer months, especially those with long duration times, and it is merely a parameter in the final distribution of meteo- droughts.
The results indicate that the POT models combining binomial or Poisson distribution for the number of exceedances with the Weibull distribution for the magnitude of exceedances are the most suitable models for describing this phenomenon for this meteorological station. Based on the adopted theoretical distributions of meteorological droughts, dry period duration and mean air temperatures, synthetic meteorological droughts for return periods of 10, 20, 50, and 100 years are determined. Although the design drought, as the product of
drought duration and mean temperature, can occur under different combinations of two factors, representative design drought duration and mean temperature are also proposed for each return period. Such a formulation of the meteorological droughts can be useful for agricultural management. The methodology can be applied for any choice of the growing season definition and thresholds pertinent for particular crops.
The methodology is demonstrated in this paper with the droughts defined using the precipitation threshold of 5 mm/day. As there is no general definition of droughts and thresholds to be used for definition of the drought, these definitions could be very different depending on the application of the method, e.g., for different crops. We selected this threshold arbitrarily in order to demonstrate the methodology. On the other hand, the methodology focuses on the extreme events, and as such, it deals only with the extreme droughts regardless of the initial threshold used for drought definition.
To get a complete picture of the occurrence and distribution of meteorological drought over a wider region, it is necessary to analyze data from other meteorological stations as well.
Acknowledgements: This study was funded by the Serbian Ministry for Science; project TR37010
“Stormwater Drainage Systems as Part of Urban and Traffic Infrastructure”.
References
Blanka, V., Mezősi, G., and Meyer, B., 2013: Projected changes in the drought hazard in Hungary due to climate change. Időjárás 117, 219–237.
CLIMATE DATA SERIES / BUDAPEST [WWW Document], Orsz. Meteorológiai Szolg. URL http://owww.met.hu/eghajlat/eghajlati_adatsorok/bp/Navig/201_EN.htm (accessed 6.15.17).
Fabian, Đ., 2015: Stohastička analiza suša u Vojvodini. Građevinski fakultet Subotica, Subotica.
(In Serbian)
Fabian, J. and Zelenhasic, E., 2016: Modelling of Meteo-Droughts. Water Res. Manage. 30, 3229–
3246. https://doi.org/10.1007/s11269-016-1342-6
Gabrić, O., Janjikopanji, Đ., Plavšić, J., and Fabian, Đ., 2017: Statistical Analysis of Meteo-Droughts for Sremska Mitrovica and Kikinda. In: Conference proceedings. Presented at the 5th International Conference Contemporary Achievements in Civil Engineering, Faculty of Civil Engineering Subotica, University of Novi Sad, Subotica, pp. 601–612.
Kiss, A. and Nikolić, Z., 2015: Droughts, Dry Spells and Low Water Levels in Medieval Hungary (and Croatia) I: The Great Droughts of 1362, 1474, 1479, 1494 and 1507. J. Environ. Geogr. 8., 11–22.
https://doi.org/10.1515/jengeo-2015-0002
Mishra, A.K. and Singh, V.P., 2010: A review of drought concepts. J. Hydrol. 391, 202–216.
https://doi.org/10.1016/j.jhydrol.2010.07.012
Plavšić, J., 2007: Flood risk analysis using the discrete stochastic processes (PhD). University of Belgrade, Faculty of Civil Engineering, Belgrade.
Rácz, L., 1999: Climate History of Hungary Since 16th Century: Past, Present and Future. Discussion Papers 28, 5–158
Sen, Z., 2015: Applied Drought Modeling, Prediction, and Mitigation. Elsevier, Amsterdam and Oxford.
Sheskin, D., 2004: Handbook of parametric and nonparametric statistical procedures. Chapman &
Hall/CRC, Boca Raton. https://doi.org/10.4324/9780203489536
Todorovic, P., 1970: On Some Problems Involving Random Number of Random Variables. Ann. Math.
Stat. 41, 1059–1063. https://doi.org/10.1214/aoms/1177696981
Todorovic, P. and Zelenhasic, E., 1970: A Stochastic Model for Flood Analysis. Water Res. Research 6, 1641–1648. https://doi.org/10.1029/WR006i006p01641
Vukmirović, V. and Petrović, J., 1998: An example of statistical analysis of drought variables, in:
FRIEND AMHY Low Flows Expert Meeting. Presented at the FRIEND AMHY Low Flows Expert Meeting, Belgrade, 67–74.
Vukmirović, V. and Petrović, J., 1997: Flood flow analysis using renewal processes, in: UNESCO IHP-V Technical Documents in Hydrology. Presented at the Annual FRIEND-AMHY meeting, 159–169.
Wilhite, D.A., Svoboda, and M.D., 2000: Drought early warning systems in the context of drought preparedness and mitigation. Proceedings of an Expert Group Meeting, Early warning systems for drought preparedness and drought management. 1–16.