DOI:10.28974/idojaras.2018.2.1
IDŐJÁRÁS
Quarterly Journal of the Hungarian Meteorological Service Vol. 122, No. 2, April – June, 2018, pp.101–118
Long-term relationships between air flow indices and air temperature over Southeast Poland
Krzysztof Bartoszek
Department of Meteorology and Climatology, Maria Curie-Sklodowska University in Lublin Postal address: Al. Krasnicka 2D, 20-718 Lublin, Poland
E-mail:k.bartoszek@umcs.pl
(Manuscript received in final form May 4, 2017)
Abstract⎯This paper concerns the relationships between selected circulation indices and air temperature over Southeast Poland between 1871-2010. The geostrophic wind speed and the resultant vorticity were computed based on daily gridded fields of mean sea-level pressure over an area defined from 5°20’ to 40°20’E and from 41°15’ to 61°15’N. The highest daily mean geostrophic wind speed over Southeast Poland is observed from December to February. In turn, the maximum (positive) values of the resultant vorticity occur in April and May, while the minimum (negative) values are observed in January.
Mean air temperature from November to February has a strong positive correlation with the geostrophic wind speed. Moreover, the occurrence of the highest coefficients regarding the correlation between the geostrophic wind speed and air temperature in winter as well as the NAO index was recorded at the beginning of the 21st century. This suggests that the range of impact of sea-level pressure distribution over the North Atlantic on the winter air temperature over Southeast Poland may have increased over the last decades. One of the causes may be an eastward shift of the position of the center of the Icelandic Low and the Azores High in the period from December to February.
Key-words: geostrophic flow, resultant vorticity, air temperature, NAO index, Southeast Poland
1. Introduction
One of the primary factors affecting climate is the large-scale atmospheric circulation that develops as a result of uneven distribution of solar radiation, the Earth’s rotation, and interactions between the atmosphere and geosphere (Klavins and Rodinov, 2010). It determines the spatial distribution of air temperature and humidity, cloudiness, or precipitation among others. Therefore,
it largely influences the weather conditions over a given area (Post et al., 2002).
A particularly high variability of weather patterns is observed at the European mid-latitudes – i.e., in the region where polar air masses collide with arctic or tropical air masses (Sepp and Jaagus, 2002). Over a longer time span, the character of atmospheric circulation is also subject to changes, as demonstrated by the results of research carried out by many authors (e.g., Bárdossy and Caspary, 1990; Kyselý and Huth, 2006; Rogers, 1990; Slonosky et al., 2000).
Large-scale atmospheric circulation can be described, among others, by means of physical parameters, including the geostrophic wind speed and the resultant vorticity (Maraun et al., 2010). These circulation indices can be useful tools for the determination of both the annual and interannual variability of air flow strength as well as cyclonic and anticyclonic circulation activity in a given area (Conway et al., 1996; Flocas et al., 2001). The relationship between the synoptic scale air flow strength and the resultant vorticity including air temperature as well as precipitation has been analyzed a number of times (Brandsma and Buishand, 1997; Kilsby et al., 1998; Wilby, 1999). The circulation indices under discussion can be calculated based on the values of mean sea-level pressure and have been deemed applicable and useful in the classification of circulation types (Chen, 2000; Linderson, 2001; Post et al., 2002; Trigo and Da Camara, 2000).
The climate of Poland is largely determined by the physical properties of air masses, inflowing from the west (from the Atlantic Ocean), east (from the Eurasian continent), north (from the Arctic), and south (from the Mediterranean Sea or North Africa). In addition to the direction of the air flow, weather conditions in this part of Europe can also be affected by air flow speed. Polish climatological literature analyzes the correlation between the geostrophic wind speed, among others, with air temperature (Degirmendžić et al., 2002), precipitation (Miętus, 1996), snow cover (Nowosad, 2012), as well as water level fluctuations along the southern Baltic Sea Coast (Olechwir, 2008).
However, no detailed studies exist so far concerning long-term changes in the geostrophic wind speed and vorticity, and its relationships with air temperature on a centennial time-scale over South-East Europe. Such an analysis may prove to be highly significant, because it could be used in research on climate change in this part of the continent.
The objective of this paper is to provide a comprehensive determination of the annual and interannual variability of the geostrophic wind speed and vorticity over the area of Southeast Poland, and an assessment of the strength of the correlation between the circulation indices and air temperature between 1871 and 2010.
2. Material and methods
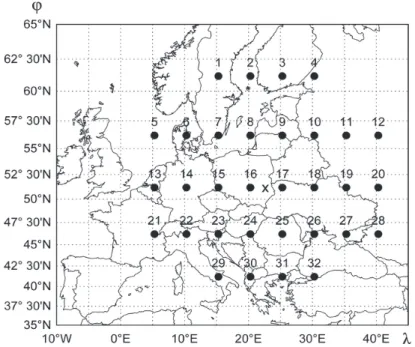
Circulation indices over Southeast Poland were calculated on the basis of equations adapted from Jenkinson and Collison (1977). In this paper, daily gridded fields (5°×5° longitude-latitude) of mean sea-level pressure (MSLP) were used over an area centered at 51°15’N and 22°50’E (Fig. 1). MSLP values covered the period from 1871 to 2010, and were obtained from the Twentieth Century Reanalysis version 2 (20CRv2). The historical reanalysis dataset generated by NOAA Earth System Research Laboratory and the University of Colorado CIRES is a comprehensive global atmospheric circulation dataset spanning 1871–2010, assimilating only surface pressure and using monthly Hadley Center SST and sea ice distributions (HadISST1.1) as boundary conditions (Compo et al., 2011). It should be mentioned that there may be data quality issues in the nineteenth century, but this problem is also implicit in the early gridded chart products (Jones et al., 2013). Therefore, prior to 1950, measured trends in the 20CR data should be treated with caution (Brönnimann et al., 2013; Bett et al., 2017). However, the time series of seasonal geostrophic wind speeds derived from the observations and from 20CR are in good agreement starting in 1893 (Wang et al., 2013).
Fig. 1. Location of grid points centered over the Lublin Region (central point at 51°15’N and 22°50’E). The numbers refer to the grid points used in the equations.
The geostrophic flow (F) was calculated on the basis of two air flow indices – i.e., westerly flow (W) and southerly flow (S):
) (
25 . 0 ) (
25 .
0 p23 p24 p25 p26 p7 p8 p9 p10
W= × + + + − × + + + , (1)
)]
2
2 ( 125 . 0 ) 2
2 ( 125 . 0 [ 596 . 1
24 16
8 23 15 7
25 17 9
26 18 10
p p
p p p p p
p p p p p
S +
×
+ + +
× +
×
− +
× + + +
× +
×
×
= , (2)
2
2 S
W
F= + . (3)
The direction of the geostrophic flow was determined for days on which F>2 ms-1:
) / arctan(S W
D= , if W ≤ 0, (4)
180 ) / arctan( +
= S W
D , if W > 0. (5)
The resultant vorticity (Z) was calculated on the basis of zonal shear vorticity (ZW) and meridional shear vorticity (ZS):
)]
( 25 . 0 )
( 25 . 0 [ 938 . 0 )]
( 25 . 0 ) (
25 . 0 [ 079 . 1
4 3 2 1 18
17 16
15 18
17 16 15 32
31 30 29
p p p p p
p p
p p
p p p p
p p p ZW
+ + +
×
− + +
+
×
×
− + + +
×
− + + +
×
×
= , (6)
)]
2
2 ( 125 . 0 )]
2 2
( 125 . 0 [ 273 . 1 )]
2
2 ( 125 . 0 ) 2
2 ( 125 . 0 [ 273 . 1
21 13 5
22
14 6
23 15 7
24 16 8
25 17
9 26 18 10
27 19 11
28 20 12
p p p p
p p p
p p p p p p
p
p p p p
p p p
p p p
ZS
+
× + +
+
× +
×
− +
× + + +
× +
×
×
− +
×
+ + +
× +
×
− +
× + + +
× +
×
×
=
, (7)
ZS ZW
Z= + . (8)
The coefficients in the formulas differ from those used by Jenkinson and Collison (1977), as the latitude is different. The grid points from p1 to p32
correspond to the sea-level pressure values (hPa). The flow units (F) are geostrophic, expressed as hPa per 10° latitude at the central latitude (51°15’N); each unit is equivalent to 0.62 ms-1. It should be note that the geostrophic wind direction does not always correspond to real air flow direction near the surface. The resultant vorticity (Z) units are expressed as hPa per 10° latitude at the central latitude (51°15’N), per 10° latitude; 1 unit is equivalent to 0.7 x 10⁻⁶ s-1.
The monthly and seasonal North Atlantic Oscillation Index from 1871 to 2010 (Jones et al., 1997) was applied to evaluate the correlations between the strength of the zonal flow over Southeast Poland and the North Atlantic
Ocean. The NAO index is defined as the difference between the normalized sea-level pressure over Gibraltar and Southeast Iceland. In order to determine the correlations between the air circulation indices and thermal conditions in the analyzed area, a long-term homogeneous series of mean monthly temperature measurements in Puławy was applied (Górski and Marciniak, 1992). Dataset after the 1980s were obtained from the Polish Institute of Meteorology and Water Management (IMGW-PIB). The meteorological station is located in Southeast Poland (φ=51°25'N, λ=21°58'E, h=142 m a.s.l.), and belongs to the Institute of Soil Science and Plant Cultivation in Puławy.
In order to identify periods manifesting an increased or reduced strength of correlation between the variables, correlation coefficients were determined for each of the subsequent 30-year periods within the period from 1871 to 2010.
3. Results
3.1. Frequency distributions and annual variability of air flow indices
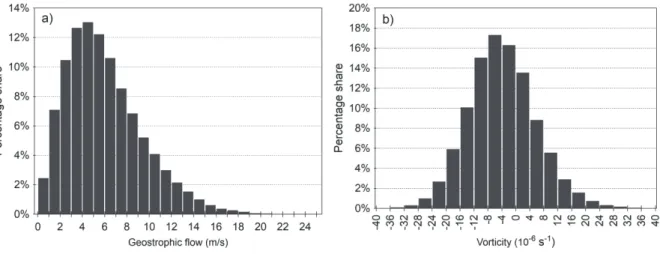
In the period from 1871 to 2010, the daily mean geostrophic wind speed over Southeast Poland ranged from 3 to 6 ms-1 in the majority of cases (Fig. 2a).
The lowest values (F <1 ms-1) occurred over 9 days in a year on average, while the highest (F ≥15 ms-1) would occur over 5 days in a given year (Fig. 2a). In the case of daily mean resultant vorticity, the distribution of days was distinguished by an occurrence of the maximum in the domain of negative vorticity values (Fig. 2b). The contribution of days with negative and positive vorticity values over Southeast Poland amounted to 67.2% and 32.8%, respectively, whereas 10.9% corresponded to days with a stronger anticyclonic circulation (Z < –15×10-6s-1), and only 3.6% to a stronger cyclonic circulation (Z ≥ 15×10-6s-1).
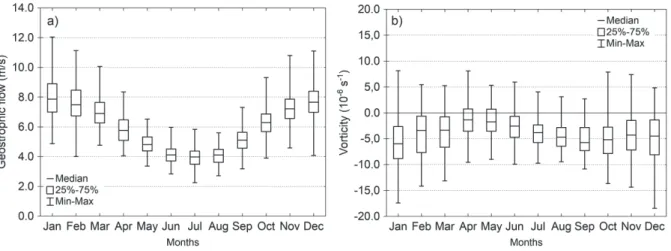
Over Southeast Poland, the highest daily mean geostrophic wind speed (7≤ F <9 ms-1) is recorded from December to February (Fig. 3a). This results from the occurrence of large horizontal air pressure gradients in the North Atlantic/European sector at this time of the year. Additionally, in winter, a higher variability in the monthly mean geostrophic wind speed is observed on the annual scale (Fig. 4a). From the beginning of March until the end of the summer season, the daily mean geostrophic wind speed rapidly decreases, and the minimum occurs from June to August (F ≈ 4.0 ms-1), when monthly mean values do not reach the lowest value from January (Fig. 4a).
Fig. 2. Frequency distributions of daily mean values of (a) the geostrophic wind speed and (b) the resultant vorticity over Southeast Poland from 1871 to 2010.
Variability in daily mean vorticity values over Southeast Poland is distinguished by its irregularity during the course of a year (Fig. 3b). Their minimum occurs in the middle of January, while they peak from April to May.
The second annual minimum of daily mean vorticity occurs from September to October, followed by an increase in the values towards those recorded in summer (Fig. 3b). Similarly as in the case of the geostrophic wind speed, the highest variability of monthly mean vorticity values over Southeast Poland is observed in winter, and the lowest in summer (Fig. 4b).
Fig. 3. Annual course of the daily mean (a) geostrophic wind speed and (b) resultant vorticity values over Southeast Poland in the period 1871–2010.
Fig. 4. Features of the empirical distribution of the monthly mean (a) geostrophic wind speed and (b) resultant vorticity values over Southeast Poland in the period 1871–2010.
3.2. Interannual variability of air flow indices over Southeast Poland
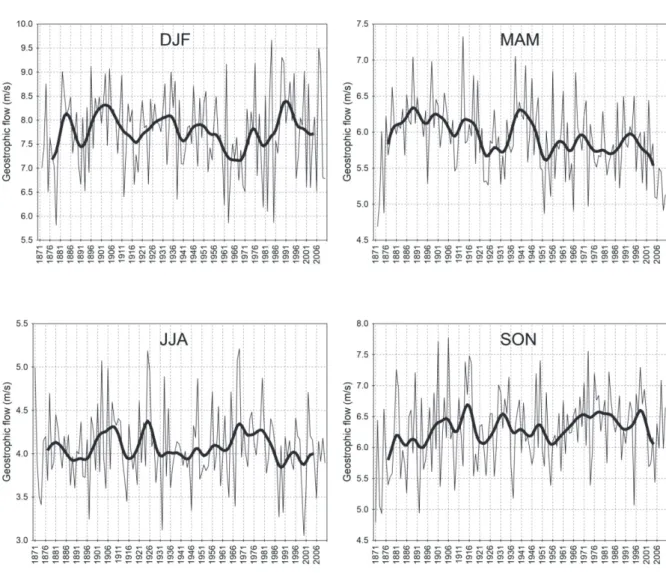
In winter, the highest mean geostrophic wind speed values were recorded in the years 1896–1910 and at the turn of the 1980’s and 1990’s, whereas the lowest was noted between 1963 and 1970 (Fig. 5). In spring, higher values occurred at the end of the 19th century and at the turn of the 1930’s and 1940’s, with lower figures in the 1920’s and 1950’s, as well as in the first decade of the 21st century. In summer, mean air flow speed often reached low values in the last three decades; the absolute minimum was recorded in 2000 (F = 3.1 ms-1). In autumn, no occurrence of longer periods with higher or lower wind speed was recorded. In the case of annual means, higher values were the most evident in the first decade of the 20th century, whereas they were lower in the 1960’s, (Fig. 5). In the period from 1871 to 2010, the highest mean annual value was recorded in 1993 (F = 6.7 ms-1), and the lowest in 1982 (F = 5.3 ms-1).
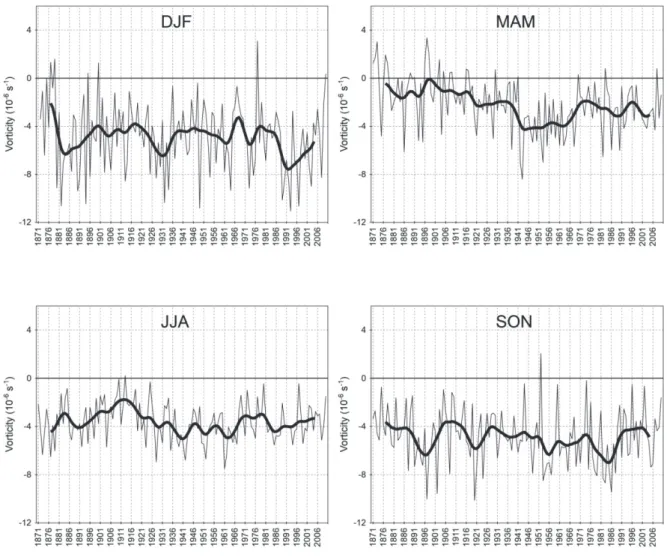
The lowest mean vorticity values in winter occurred between 1925 and 1934, and from the end of the 1980’s to the beginning of the 21st century (Fig. 6). In spring, the minimum occurred in the period 1942-1969, with the maximum occurring at the turn of the 19th and 20th century. In summer and autumn, as well as annually, the highest mean vorticity values (intensified cyclonic circulation) were recorded between 1900 and 1915. Out of all of the analyzed years, the highest mean annual vorticity value was recorded in 2010 (Z = –0.8 × 10⁻⁶s-1). The maximum for May and November also occurred in the same year (Z = 5.3 × 10⁻⁶s-1 and 7.4 × 10⁻⁶s-1, respectively). The lowest annual mean was recorded in 1961 (Z = –7.4 × 10⁻⁶s-1). The minimum for the summer period was also recorded for that year (Z=–7.5 × 10⁻⁶s-1).
Fig. 5. Long-term variability of the mean values of the geostrophic wind speed in winter (DJF), spring (MAM), summer (JJA), autumn (SON), and the year. Values are smoothed by 13-element Gaussian filter (bold line).
Fig. 6. Long-term variability of the mean values of the resultant vorticity in winter (DJF), spring (MAM), summer (JJA), autumn (SON), and the year. Values are smoothed by a 13-element Gaussian filter (bold line).
3.3. Relationships between air flow indices and air temperature
The mean geostrophic wind speed over Southeast Poland shows no evident correlation with mean sea-level pressure values (Table 1). Statistically significant correlation is recorded only in June and September – i.e., decreases (increases) in MSLP are accompanied by a stronger (weaker) air flow.
Throughout the year, decreases (increases) in MSLP are accompanied by an increase (decrease) in vorticity. With the exception of the July to September period, the correlation coefficient (r) between vorticity and air pressure reaches a value of approximately –0.80 (Table 1).
Table 1. The linear correlation coefficients between the mean sea-level pressure and the geostrophic wind speed (F), as well as the resultant vorticity (Z) at grid point 51°15’N;
22°50’E, in the period 1871–2010
Index Jan Feb Mar Apr May Jun Jul Aug Sep Oct Nov Dec Year F -0.05 -0.03 0.07 -0.08 -0.04 -0.32a -0.18 -0.11 -0.24b -0.14 -0.15 -0.07 0.04 Z -0.78a -0.78a -0.79a -0.77a -0.80a -0.81a -0.71a -0.62a -0.62a -0.77a -0.79a -0.82a -0.76a
a, b – significant at p < 0.01, p < 0.05, respectively
From October to February, a statistically significant correlation is observed in the study area between the geostrophic air flow speed and the NAO index (Table 2). High positive NAO index values and, therefore, the occurrence of large horizontal air pressure gradients between Gibraltar and Iceland suggest an increasing intensity of the western zonal circulation over a large part of Europe.
In the case of Southeast Poland, the highest positive correlation coefficients occur in the winter months (Table 2). This confirms that at this time of the year, the strength of air flow over the European continent is largely determined by two centers of atmospheric activity in the Northeast Atlantic Ocean – i.e., the Icelandic Low and the Azores High.
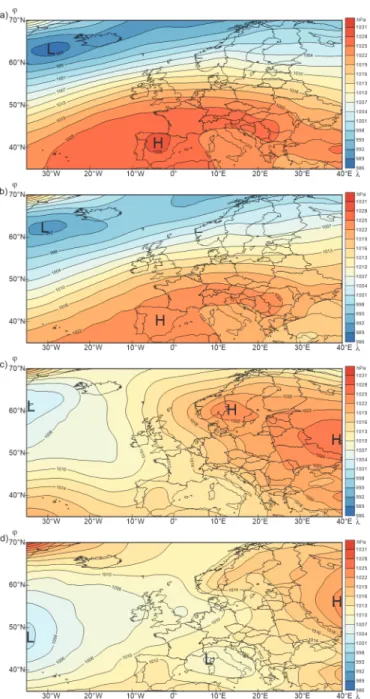
The resultant vorticity shows a statistically significant correlation with the NAO index in all months, whereas the correlation is the strongest in the winter season (Table 2). A negative correlation coefficient value suggests that increases (decreases) in the air pressure gradients over the North Atlantic correspond to a strengthening of anticyclonic (cyclonic) circulation over Southeast Poland. This may result from the fact that during winters with high positive NAO index values, the Azores High pressure system is strongly extended northeastwards towards East Europe (Fig. 7a–b). The strengthening of anticyclonic circulation over the analysed area can also occur during winters with negative NAO index values, if the atmospheric circulation in East Europe is affected by the ridge of the Siberian High (Fig. 7c). However, low negative NAO index values usually correspond to the weakening of anticyclonic circulation in this part of the continent (Fig. 7d).
Table 2. The linear correlation coefficients between the NAO index and the geostrophic wind speed (F), as well as the resultant vorticity (Z) in the period 1871–2010
Jan Feb Mar Apr May Jun Jul Aug Sep Oct Nov Dec Year F 0.52a 0.33a 0.14 -0.01 -0.18 -0.07 0.16 0.03 -0.04 0.22b 0.24b 0.36a 0.30a Z -0.37a -0.38a -0.38a -0.22b -0.39a -0.28a -0.24b -0.49a -0.51a -0.33a -0.36a -0.28a -0.31a
a, b – significant at p < 0.001, p < 0.01, respectively
Fig. 7. Mean sea-level pressure fields from December to February at the Euro-Atlantic sector in the winter seasons of (a) 1988-89 (NAODJF = +2,99), (b) 1974-75 (NAODJF = +1,96), (c) 1995-96 (NAODJF = –2,24), and (d) 2009-10 (NAODJF = –3,12). Data from the NCEP/NCAR Reanalysis (Kalnay et al., 1996).
Mean air temperature in the period from November to February has a strong positive correlation with the geostrophic wind speed (Table 3). As it was previously mentioned, the occurrence of large horizontal air pressure gradients over the North Atlanticin winter is responsible for the intensified western zonal circulation. Therefore, the occurrence of mild winters in Southeast Poland is determined in particular by a strong advection of relatively warm air at this time of the year from westerly and northwesterly directions – i.e., from the Atlantic Ocean (Table 4). In turn, a higher frequency of days with northeasterly and easterly circulation – i.e., from the cool interior of the Eurasian continent – corresponds to the occurrence of severe winters. In June, July, and September, the geostrophic wind speed is negatively correlated with air temperature (Table 3). At this time of the year, the temperature of the Atlantic is lower than that of the surface of the continent. Therefore, cooler summer seasons over Southeast Poland occur in tandem with an increased frequency of westerly and northwesterly circulation, whereas warmer summers are experienced if days with easterly and southeasterly circulation are prevalent (Table 4).
Table 3. The linear correlation coefficients between the air temperature and the geostrophic wind speed (F), as well as the resultant vorticity (Z) in the period 1871–2010
Jan Feb Mar Apr May Jun Jul Aug Sep Oct Nov Dec Year F 0.54a 0.28a 0.12 -0.02 0.00 -0.31a -0.35a -0.20 -0.28a 0.16 0.22b 0.30a 0.17 Z -0.02 -0.03 -0.05 -0.05 -0.13 -0.32a -0.21 -0.02 -0.27b 0.03 0.27b 0.19 -0.14
a, b – significant at p < 0.001, p < 0.01, respectively
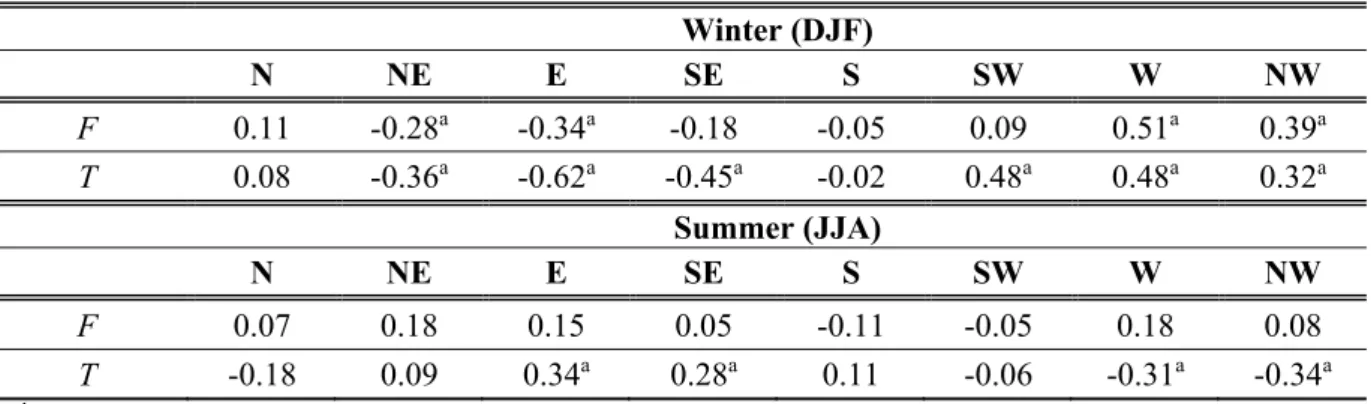
Table 4. The linear correlation coefficients between the frequency of air flow directions and the geostrophic wind speed (F), as well as air temperature (T) in winter and summer (1871–2010)
Winter (DJF)
N NE E SE S SW W NW F 0.11 -0.28a -0.34a -0.18 -0.05 0.09 0.51a 0.39a
T 0.08 -0.36a -0.62a -0.45a -0.02 0.48a 0.48a 0.32a
Summer (JJA)
N NE E SE S SW W NW
F 0.07 0.18 0.15 0.05 -0.11 -0.05 0.18 0.08
T -0.18 0.09 0.34a 0.28a 0.11 -0.06 -0.31a -0.34a
a, b – significant at p < 0.001, p < 0.01, respectively
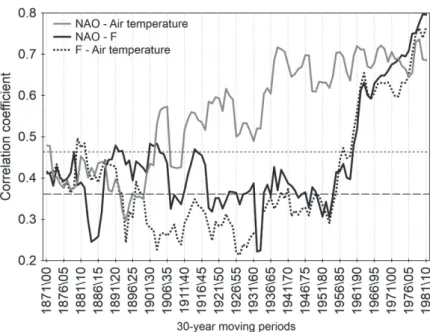
The strength of the correlation between the geostrophic wind speed in winter and the NAO index has recently been subject to a considerable change (Fig. 8). In each of the subsequent 30-year periods, the lowest correlation coefficients (0.2< r< 0.3) occurred in the second decade of the 20th century and in the first half of the 1960’s. A weak correlation was also determined from the 1930’s to the 1960’s between air flow speed and air temperature. In both cases, a very rapid increase in the correlation coefficient values from the 1980’s to the end of the analyzed period was significant. In the first decade of the 21st century, more than 50% of the variance of the mean air temperature in winter was explained by the geostrophic wind speed. In the case of correlations between the air temperature and the winter NAO index, reasonably high correlation coefficient values (0.6< r< 0.7) have been recorded since the mid 1960’s (Fig. 8).
Fig. 8. Long-term variability of correlation coefficient for each of the 30-year moving periods between the geostrophic wind speed (F), the NAO index, and the mean air temperature in winter (DJF). Horizontal dotted lines indicate correlation significant at a p-value of 0.01; horizontal dashed lines at a p-value of 0.05.
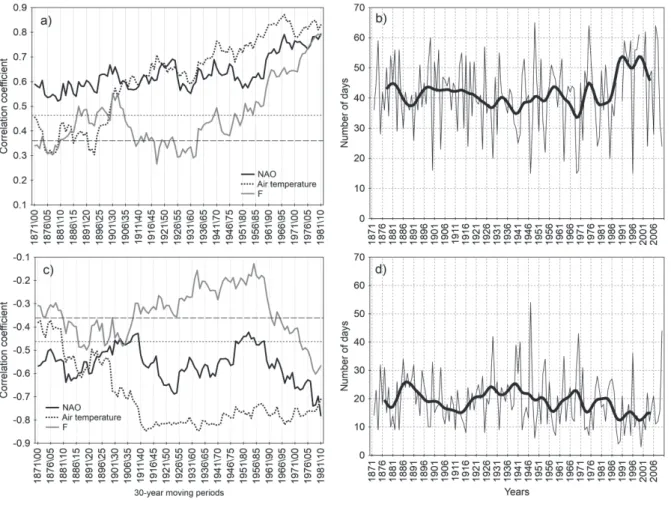
Over recent decades, a considerable increase has been also noted in the strength of the correlation between the geostrophic wind speed and the number of days with westerly and easterly air flow in winter (Fig. 9a and c). A higher correlation than in previous years has also been recorded since the end of the 1980’s between the frequency of western zonal circulation and the NAO index as well as the air temperature in winter (Fig. 9a). Moreover, in the 1988–2002 period, a maximum (minimum) frequency of westerly (easterly) zonal
Fig. 9. Long-term variability of correlation coefficient for each of the 30-year moving periods among the geostrophic wind speed (F), the NAO index and the mean air temperature, and the frequency of (a) westerly (SW+W+NW) and (c) easterly air flow (NE+E+SE) in winter (DJF). Horizontal dotted lines indicate correlation significant at a p-value of 0.01; horizontal dashed lines at a p-value of 0.05. The interannual frequency of (b) westerly and (d) easterly air flow is also presented. Values are smoothed by a 13-element Gaussian filter (bold line).
4. Discussion and conclusions
The present study has revealed that the daily mean geostrophic wind speed over Southeast Poland ranged from 3 to 6 ms-1. For comparison, in the area of the British Isles, the maximum frequency of days corresponded with a range of values from 6 to 7.5 ms-1 (Conway et al., 1996). The highest values occur from December to March, and the lowest ones from June to August. In Central Europe the occurrence of the highest mean geostrophic wind speed in winter and the lowest in summer was also revealed by the results of research undertaken by Marosz and Miętus (2012) as well as Brandsma and Buishand (1998). In the case of daily mean resultant vorticity, the distribution of days over Southeast Poland and British Isles was approximate.
The first decade of the 21st century was distinguished by a lower geostrophic mean wind speed than in the 1980’s and 1990’s. A strengthening of the westerly zonal circulation in the final decades of the 20th century in the North Atlantic/European sector was also noted in several climatological studies (e.g., Bárdossy and Caspary, 1990; Degirmendžić et al., 2000; Keevallik et al., 1999; Kyselý and Huth, 2006; Werner et al., 2000). Furthermore, higher annual mean values were the most evident in the first decade of the 20th century, and lower in the 1960’s. Similar occurrences of maximum and minimum wind speed values were found in Switzerland (Brönnimann et al., 2012). In turn, the decade of the 1960’s was analyzed by Ustrnul (1997) and Degirmendžić et al. (2000).
According to the studies, exceptionally weakened western zonal circulation was observed over the European continent at this time.
The highest mean values of resultant vorticity occurred at the beginning of the 20th century (a period with intensified cyclonic circulation). The evident prevalence of cyclonic over anticyclonic frequency at the beginning of the 20th century is also confirmed by the results of research conducted by Przybylak and Maszewski (2009), referring to the western area of Central Poland. On an annual scale, the maximum values of vorticity over Southeast Poland occur in April and May, and the minimum in January. Considerably weakened anticyclonic circulation in the spring season was also recorded in the eastern part of Germany (Brandsma and Buishand, 1998).
Geostrophic wind speed over Southeast Poland affects air temperature to the greatest extent during the period from December to February. This confirms the earlier results obtained for Poland by Kożuchowski and Żmudzka (2002). The warmest winters are accompanied by a greater than average number of days with westerly circulation and a stronger zonal flow. In contrast to air flow speed and direction, no clear correlations were found between vorticity and air temperature.
The highest strength of the correlation (r=0.80) between the air flow speed and frequency of days with a westerly circulation as well as the NAO index values in winter has also been observed recently. This suggests that the range of impact of sea-level pressure distribution on the character of the atmospheric circulation over the North Atlantic and air temperature during winter over Southeast Poland may have increased in the recent years. One of the causes may be an eastward shift of the position of the center of the Icelandic Low and the Azores High in the period from December to February that began in the late 1970s (Hilmer and Jung, 2000; Johnson et al., 2008). It was reported that the relationship between the air temperature over Eastern Europe and the winter NAO has strengthened considerably since then because of NAO-related intensified zonal flow anomalies over this region (Jung et al., 2003).
References
Bárdossy, A. and Caspary, H.J., 1990: Detection of climate change in Europe by analyzing European atmospheric circulation patterns from 1881 to 1989. Theor. Appl. Climatol. 42, 155–167.
https://doi.org/10.1007/BF00866871
Bett, P.E., Thornton, H.E., and Clark, R.T., 2017: Using the Twentieth Century Reanalysis to assess climate variability for the European wind industry. Theor. Appl. Climatol. 127, 61–80.
https://doi.org/10.1007/s00704-015-1591-y
Brandsma, T., and Buishand, T.A., 1997: Statistical linkage of daily precipitation in Switzerland to atmospheric circulation and temperature. J. Hydrol. 198, 98–123.
https://doi.org/10.1016/S0022-1694(96)03326-4
Brandsma, T., and Buishand, T.A., 1998: Simulation of extreme precipitation in the Rhine basin by nearest neighbour resampling. Hydrol. Earth Syst. Sci. 2, 195–209.
https://doi.org/10.5194/hess-2-195-1998
Brönnimann, S., Martius, O., von Waldow, H., Welker, C., Luterbacher J., Compo G.P., Sardeshmukh P.D., and Usbeck T., 2012: Extreme winds at northern mid-latitudes since 1871. Meteorol. Zeit.
21, 13–27.
https://doi.org/10.1127/0941-2948/2012/0337
Brönnimann, S., Wegmann M., Wartenburger R., and Stickler A., 2013: Arctic Winds in the Twentieth Century Reanalysis. In: Weather extremes during the past 140 years (S. Brönnimann and O.
Martius, Eds.). Geographica Bernensia G89, 59–67.
Chen, D., 2000: A monthly circulation climatology for Sweden and its application to a winter temperature case study. Int. J. Climatol. 20, 1067–1076.
https://doi.org/10.1002/1097-0088(200008)20:10<1067::AID-JOC528>3.0.CO;2-Q
Compo, G.P., Whitaker, J.S., Sardeshmukh, P.D., Matsui, N., Allan, R.J., Yin, X., Gleason, B.E., Vose, R.S., Rutledge, G., Bessemoulin, P., Brönnimann, S., Brunet, M., Crouthamel, R.I., Grant, A.N., Groisman, P.Y., Jones, P.D., Kruk, M.C., Kruger, A.C., Marshall, G.J., Maugeri, M., Mok, H.Y., Nordli, Ø., Ross, T.F., Trigo, R.M., Wang, X.L., Woodruff, S.D., and Worley, S., 2011: The Twentieth Century Reanalysis Project. Q. J. R. Meteorol. Soc. 137, 1–28.
https://doi.org/10.1002/qj.776
Conway, D., Wilby, R.L., and Jones, P.D., 1996: Precipitation and air flow indices over the British Isles. Clim. Res. 7, 169–183. https://doi.org/10.3354/cr007169
Degirmendžić, J., Kożuchowski, K., and Żmudzka, E., 2002: Uwarunkowania cyrkulacyjne zmienności temperatury powietrza w Polsce w okresie 1951-2000. Prz. Geof. 47, 93–98 (in Polish).
Degirmendžić, J., Kożuchowski, K., and Wibig, J., 2000: Epoki cyrkulacyjne XX wieku i zmienność typów cyrkulacji atmosferycznej w Polsce. Prz. Geof. 45, 221–238 (in Polish).
Flocas, H.A., Maheras, P., Karacostas, T.S., Patrikas, I., and Anagnostopoulou, C., 2001: A 40-year climatological study of relative vorticity distribution over the Mediterranean. Int. J. Climatol.
21, 1759–1778. https://doi.org/10.1002/joc.705
Górski, T., and Marciniak, K., 1992: Temperatura powietrza w Puławach w ciągu lat 1871-1990. Pam.
Puł. 100, 7–26 (in Polish).
Hilmer, M., and Jung, T., 2000: Evidence for a recent change in the link between the North Atlantic Oscillation and Arctic sea ice export. Geophys. Res. Lett. 27, 989–992.
https://doi.org/10.1029/1999GL010944
Jenkinson, A.F., and Collinson, F.P., 1977: An initial climatology of gales over the North Sea.
Synoptic climatology branch memorandum 62, Meteorological Office, Bracknell.
Johnson, N.C., Feldstein, S.B., and Trembley, B., 2008: The continuum of Northern Hemisphere teleconnection patterns and a description of the NAO shift with the use of self-organizing maps.
J. Clim. 21, 6354–6371. https://doi.org/10.1175/2008JCLI2380.1
Jones, P.D., Jonsson, T., and Wheeler, D., 1997: Extension to the North Atlantic Oscillation using early instrumental pressure observations from Gibraltar and South-West Iceland. Int. J.
Climatol. 17, 1433–1450.
https://doi.org/10.1002/(SICI)1097-0088(19971115)17:13<1433::AID-JOC203>3.0.CO;2-P
Jones, P.D., Harpham, C., and Briffa, K.R., 2013: Lamb weather types derived from reanalysis products. Int. J. Climatol. 33, 1129–1139. https://doi.org/10.1002/joc.3498
Jung, T., Hilmer, M., Ruprecht, E., Kleppek, S., Gulev, S.K., and Zolina, O., 2003: Characteristics of the recent eastward shift of interannual NAO variability. J. Clim. 16, 3371–3382.
https://doi.org/10.1175/1520-0442(2003)016<3371:COTRES>2.0.CO;2
Kalnay, E., Kanamistu, M., Kistler, R., Collins, W., Deaven, D., Gandin, L., Iredell, M., Saha, S., White, G., Woollen, J., Zhu, Y., Leetmaa, A., Reynolds, R., Chelliah, M., Ebisuzaki, W., Higgins, W., Janowiak, J., Mo, K.C., Ropelewski, C., Wang, J., Jenne, R. and Joseph, D., 1996: The NMC/NCAR 40-Year Reanalysis Project. Bull. Amer. Meteor. Soc. 77, 437–471.
https://doi.org/10.1175/1520-0477(1996)077<0437:TNYRP>2.0.CO;2
Keevallik, S., Post, P. and Tuulik, J., 1999: European circulation patterns and meteorological situation in Estonia. Theor. Appl. Climatol. 63, 117–127. https://doi.org/10.1007/s007040050097
Kilsby, C.G., Cowpertwait, P.S., O'Connell, P.E., and Jones, P.D., 1998: Predicting rainfall statistics in England and Wales using atmospheric circulation variables. Int. J. Climatol. 18, 523–539.
https://doi.org/10.1002/(SICI)1097-0088(199804)18:5<523::AID-JOC268>3.0.CO;2-X
Klavins, M., and Rodinov, V., 2010: Influence of Large-scale Atmospheric Circulation on Climate in Latvia. Boreal Env. Res. 15, 533–543.
Kożuchowski, K., and Żmudzka, E., 2002: Cyrkulacja atmosferyczna i jej wpływ na zmienność temperatury powietrza w Polsce. Prz. Geogr. 74, 591–604 (in Polish).
Kyselý, J., and Huth, R., 2006: Changes in atmospheric circulation over Europe detected by objective and subjective methods. Theor. Appl. Climatol. 85, 19–36.
https://doi.org/10.1007/s00704-005-0164-x
Linderson, M.J., 2001: Objective classification of atmospheric circulation over Southern Scandinavia.
Int. J. Climatol. 21, 155–169. https://doi.org/10.1002/joc.604
Maraun, D., Rust, H.W., and Osborn, T.J., 2010: Synoptic airflow and UK daily precipitation extremes. Extremes 13, 133–153. https://doi.org/10.1007/s10687-010-0102-x
Marosz, M., and Miętus, M., 2012: Opis lokalnych aspektów cyrkulacji atmosferycznej za pomocą wektora wiatru geostroficznego. In: Rola cyrkulacji atmosfery w kształtowaniu klimatu (Z.
Bielec-Bąkowska, E. Łupikasza and A. Widawski, Eds.). Uniwersytet Śląski, Sosnowiec, 89–
100 (in Polish).
Miętus, M., 1996: Zmienność lokalnej cyrkulacji atmosferycznej nad północną Polską i jej związek z elementami klimatu Wiad. IMGW 20, 9–29 (in Polish).
Nowosad, M., 2012: Zmiany grubości pokrywy śnieżnej w Lublinie i ich uwarunkowania cyrkulacyjne. Pr. Wydz. NoZ Uniw. Śl. 74, 157–166 (in Polish).
Olechwir, T., 2008: Wpływ kierunku i prędkości wiatru geostroficznego na wahania poziomów wody na Zalewie Szczecińskim. Inż. Mor. i Geotech. 29, 52–54.
Post, P., Truija, V., and Tuulik, J., 2002: Circulation weather types and their influence on temperature and precipitation in Estonia. Boreal Env. Res. 7, 281–289.
Przybylak, R., and Maszewski, R., 2009: Zmienność cyrkulacji atmosferycznej w regionie bydgosko- toruńskim w latach 1881-2005. Acta Agroph. 14, 427–447 (in Polish).
Rogers, J.C., 1990: Patterns of low-frequency monthly sea level pressure variability (1899–1986) and associated wave cyclone frequencies. J. Clim. 3, 1364–1379.
https://doi.org/10.1175/1520-0442(1990)003<1364:POLFMS>2.0.CO;2
Sepp, M., and Jaagus J., 2002: Frequency of circulation patterns and air temperature variations in Europe. Boreal Env. Res. 7, 273–279.
Slonosky, V.C., Jones, P.D., and Davies, T.D., 2000: Variability of the surface atmospheric circulation over Europe, 1774–1995. Int. J. Climatol. 20, 1875–1897.
https://doi.org/10.1002/1097-0088(200012)20:15<1875::AID-JOC593>3.0.CO;2-D
Trigo, R.M., and Da Camara, C.C., 2000: Circulation weather types and their influence on the precipitation regime in Portugal. Int. J. Climatol. 20, 1559–1581.
https://doi.org/10.1002/1097-0088(20001115)20:13<1559::AID-JOC555>3.0.CO;2-5
Ustrnul, Z., 1997: Zmienność cyrkulacji atmosfery na półkuli północnej w XX wieku. Mat. Bad. IMGW Ser. Met. 27, Warszawa. (in Polish).
Wang, X.L., Feng, Y., Compo, G.P., Zwiers, F.W., Allan, R.J., Swail, V.R., and Sardeshmukhet, P.D., 2013: Is the storminess in the Twentieth Century Reanalysis really inconsistent with observations? A reply to the comment by Krueger et al. (2013b). Clim. Dyn. 42, 1113–1125.
https://doi.org/10.1007/s00382-013-1828-3
Werner, P.C., Gerstengarbe, F.W., Fraedrich, K., and Oesterle, H., 2000: Recent climate change in the North Atlantic/European sector. Int. J. Climatol. 20, 463–471.
https://doi.org/10.1002/(SICI)1097-0088(200004)20:5<463::AID-JOC483>3.0.CO;2-T
Wilby, R.L., 1999: Statistical downscaling of daily precipitation using daily airflow and seasonal teleconnection indices. Clim. Res. 10, 163–178. https://doi.org/10.3354/cr010163