68
Brain Tumor Segmentation in MRI Data
Petra Takács†*, Andrea Manno-Kovacs†*
†Machine Perception Research Laboratory, MTA SZTAKI, Budapest, Hungary
* Pázmány Péter Catholic University, Faculty of Information Technology and Bionics, Budapest, Hungary Keywords: visual saliency, 3D medical image segmentation, convolutional neural networks
Abstract:
This paper proposes a brain tumor segmentation method based on visual saliency features on MRI image volumes. The proposed method uses a novel combination of multiple MRI modalities and highlights the potential tumors by applying a healthy template generated from the annotated database slices without tumors.
The introduced method proposes a saliency model that includes color and spatial features and as a novel contribution, also incorporates information about the relation of neighboring slices. Based on the saliency map, the outline of the tumor is detected by a region-based active contour method. Moreover, the proposed method is also combined with convolutional neural networks to reduce the networks’ eventual overfitting which may result in weaker predictions for unseen cases. The proposed methods were tested on the BRATS2015 database, and the quantitative results showed that hybrid models (including both trained and handcrafted features) can be promising alternatives to reach higher segmentation performance.
Introduction
Gliomas are the most frequent primary brain tumors in adults [1], comprising about 30 per cent of all brain tumors and central nervous system tumors. Being highly malignant, this type covers 80 per cent of all malignant brain tumors. In case of patients with such brain tumors, the role of noninvasive imaging techniques are even more important, as repeated tumor biopsies have high risk. Therefore, continuous monitoring using 3D image modalities (CT, MRI) is a widely applied tool.
When categorizing state-of-the-art tumor segmentation algorithms, we can divide them into two broad families [2]. Generative models use detailed prior information about the appearance and spatial distribution of multiple different tissues, including anatomical and domain-specific knowledge. They usually also perform brain tissue segmentation [3], [4]. In our proposed model we followed a similar approach as in [3] and we built a healthy template for the applied image scans (T2 and FLAIR components in our case). They can handle unseen images efficiently, but they strongly rely on the registration step.
The other large group is discriminative models, using annotated training images and directly learning the characteristics of different segmentation labels without any prior domain knowledge [5], [6]. To cover intensity and shape variations of tumors, they require huge amount of training data to extract tumor features thoroughly.
Nowadays, deep learning methods are the most popular models of this group, using convolutional neural networks. Different network architectures, such as U-Net [7] or cascaded anisotropic networks (WTNet) [8]
are applied for training segmentation models using 2D or 3D interpretation. However, the disadvantage of these methods is still their strong dependence on the training data, e. g., they cannot handle images with differing imaging protocols from the ones used for acquiring the training data.
To compensate for the mentioned drawbacks, one solution might be to use a mixed generative-discriminative model to fuse handcrafted features and learning.
From a medical point-of-view, the existence of tumors may support diagnosis, therefore these objects may function as the ROI of the image. This motivates to consider tumors as salient regions in the image, and highlight them by applying a visual saliency model. Our proposed algorithm follows this direction and, inspired by [9], constructs a saliency model using handcrafted features. The referred saliency-based detection algorithm [9] is based on a pseudo-coloring scheme using FLAIR, T2 and T1c sequences respectively as RGB channels, followed by a bottom-up color and spatial distance calculation to highlight tumor areas as salient regions in the image.
In this paper, a novel pseudo-color image is introduced, calculating channels as difference images between a specific image patch and a healthy image template built up using the healthy slices of the database for FLAIR and T2 sequences. Beside calculating color and spatial distance in the image patch, information between brain volume slices is also incorporated in the proposed saliency function, exploiting the connection between
69 neighboring slices concerning the location, size and shape of the tumor. The calculated saliency map estimates the location of the tumor. To produce a more accurate tumor outline, a region-based active contour step [10] is also performed.
As a proof-of-concept step the proposed saliency map is combined with trained convolutional neural networks (U-Net and WT-Net) by applying a weighting function for the saliency map and the network’s prediction map.
The quantitative results on the Multimodal Brain Tumor Image Segmentation Benchmark (BRATS) 2015 [2]
showed that the hybrid models (including both trained and handcrafted features) can be promising alternatives to reach higher segmentation performance.
Visual saliency based tumor segmentation
Pseudo color model
We construct a color image from the available MRI sequences. Improving the color model of [9] we have also calculated a difference image for the FLAIR and T2 scans in the BRATS2015 database. By analyzing the annotated ground truths, we selected slices without marked tumor regions. For all axial slices, available healthy scans were collected and we constructed the healthy mean templates HMFLAIR, HMT2. The proposed color model has the following form:
R :FLAIR,
G : T2 ∗ α − HMT2 ∗ β, (1)
B : FLAIR ∗ α − HMFLAIR ∗ β,
where we selected α = 1.5 and β = 0.2 based on the experiments. As a simple registration, the brain area (pixels with non-zero values) in the template is fitted to the brain region in the actual image. To further enhance local contrast, the pseudoRGB image is transformed to the CIE L∗a∗b∗ color space, which is later used for saliency calculation.
Saliency map for ROI estimation
To build the saliency model, [9] advised to apply color difference and spatial difference in a block-based processing system. To achieve this, first the image slice was rescaled to 256×256. Then, the rescaled image was decomposed into nonoverlapping blocks with size k×k, where w is a multiple of k. Therefore, saliency calculation was performed for w/k×w/k patches and the Sc color difference feature for Ri patch was computed as:
The color difference was calculated for each L∗a∗b∗ channels, and 𝑅𝑖𝑐ℎ̅̅̅̅ marks the mean value for ch channel, which represents the ith image patch Ri.
Motivated by the human observation that tumors are spatially concentrated objects, close to a spatially salient area, the probability is high to find further salient regions. On the other hand, regions further from the salient area have a smaller probability to be salient. Therefore, spatial distance feature was incorporated for saliency calculation:
(4)
where d(Ri,Rj) is the Euclidean distance of the mean spatial coordinates of Ri, Rj patches.
The Scs saliency map is then scaled back to its original size saliency model scale-invariant to local feature sizes, the Scs (denoted by 𝑆̂cs), using bilinear interpolation. To make the saliency model scale-invariant to local feature sizes, the Scs color-spatial saliency is calculated for different block sizes. 8 × 8 and 16 × 16 blocks are used for saliency calculation: Scs = ∑𝑘=8,16𝑟𝑘× 𝑆̂𝑐𝑠𝑘 , where rk is the weighting parameter for the color-spatial based saliency map of different sizes. By following the recommendations of [9], rk = 0.5 is applied.
70 Beside these features, we added 3D spatial information and the color-spatial saliency model was further extended to extract salient information from neighboring slices. Motivated by the fact that the location, size and shape of the tumor is quite similar in neighboring slices, we calculated the final saliency map as a weighted fusion of the actual ( ), previous (Scsp ) and next ( ) slice’s color-spatial saliency. The proposed saliency map looks as follows:
S = 𝑤𝑝× 𝑆𝑐𝑠𝑝 + 𝑤𝑎× 𝑆𝑐𝑠𝑎 + 𝑤𝑛× 𝑆𝑐𝑠𝑛, (6)
where wp,wa,wn denote the weights for the different slices, after extensive testing, wa = 0.4 and wp = wn = 0.3 were set.
Finally a 25×25 mean filter was applied on the calculated S saliency map to get a smoother final estimation.
Active contour based tumor outline detection
The original method [9] highlights tumor regions, however it sometimes fails for healthy slices. In such cases, the calculated saliency map has balanced values for the whole brain region, falsely emphasizing large healthy areas. To avoid such errors, we add a spatial checking step before the tumor outline detection. The saliency map is first binarized by applying an adaptive threshold motivated by the original paper:
(7) where γ = 3.55 is set, as proposed in [9].
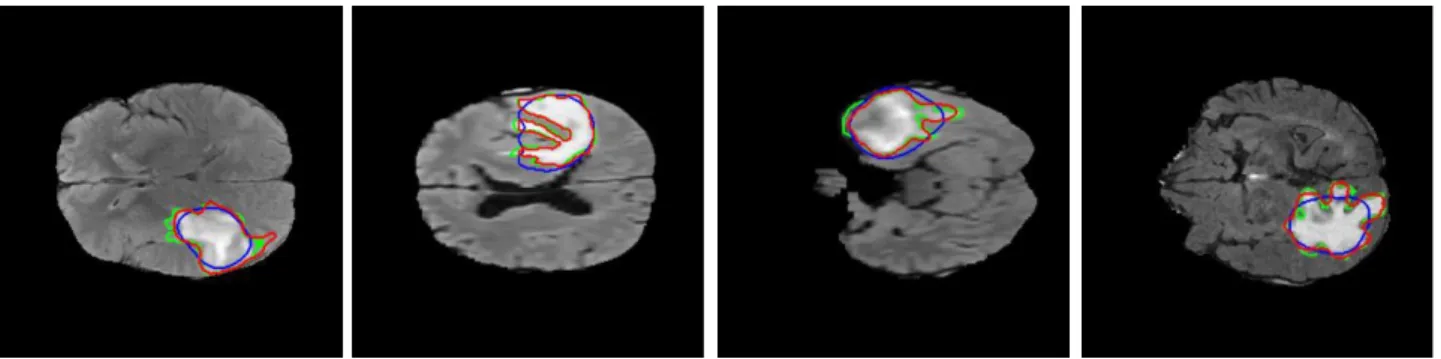
The area of the foreground in the binarized image (the estimation of the potential tumor) and the area of the whole brain region is measured, and if their ratio exceeds a Tr threshold (Tr = 0.425, set based on the experiments), then the salient area is filtered out, and the slice is claimed to include no tumor. The ratio was set based on the analysis of the annotated tumor sizes and their rate to the coherent brain regions in the BRATS2015 database. The saliency based tumor estimation gives a rough localization of the ROI (blue contour in Fig. 1), however the fine details of the object outline are usually missed. To detect the complex shapes more accurately we used a region based active contour method [10]. Fig. 1 shows the results of the tumor outline detection, blue marking the initial contour, which is the binarized estimation of the color-spatial saliency map, red is the result of the iterative Chan-Vese active contour method and green shows the ground truth. We checked the final active contour detection for overly large areas, rejecting areas exceeding the mentioned Tr ratio. After running the segmentation algorithm for all the slices of a volume, we added a final drop-out step to eliminate false positive hits. Tumor candidates were followed throughout neighboring slices, and the number of slices (length of the chain) with the tumor was counted. Finally, only the detection of the longest chain was kept. If a tumor appeared only on a few slices, then it was assumed to be false and deleted.
Fusion of deep learning based predictions and handcrafted saliency maps
As it was discussed in the Introduction, nowadays neural networks are widely used for brain tumor segmentation. However, adapting deep learning methods to new data can be hard, requiring lengthy retraining, making real world application very challenging. In case of novel data, they have to be retrained, which makes real world application or software implementation very challenging. This motivates the idea to fuse a generative, handcrafted feature-based model and a discriminative learning based technique.
As a proof-of-concept, we have fused our saliency-based model with two, state-of-the-art network architectures, the U-Net [7] and the WT-Net [8]. The U-Net introduces a convolutional network for end-to-end image segmentation, resulting in a segmentation map. The first part of the network is a contractive part, highlighting the image information, while the second part is creating a high-resolution segmentation map.
The U-Net was very successful, when processing medical image data.
In [8] a cascade of CNNs were introduced to segment brain tumor subregions sequentially. The complex segmentation problem is divided into 3 binary segmentation problems: WNet segments the whole tumor, its output is a bounding box, which is used as input of the second network, called as TNet, to segment the tumor
71 core. Finally, its output bounding box is applied as input for ENet to detect enhancing tumor core. As in our case we only concentrate on the whole tumor, and we use the implementation of WNet/TNet, called WT-Net, from the NiftyNet [11] platform.
Fig. 1. Tumor contour detection using the Chan-Vese method; blue is the thresholded, binary tumor estimation of the color-spatial saliency map, red is the improved result of the active contour step, green is the ground truth tumor outline.
To exploit the benefits of both approaches, the proposed S saliency map (Eq. 6) is fused with the prediction map, calculated by the neural network (denoted by PU and PWT for U-Net and WT-Net respectively). As a shallow convolution, the two maps are fused with a weighting function:
S{U,WT} = δ × S + (1 − δ) × P{U,WT}, (8)
where δ = 0.5 was applied for U-Net, and δ = 0.5 and δ = 0.25 were tested for WT-Net. According to our experiences, while saliency based algorithms have high precision value and lower recall, neural networks behave inversely with higher recall than precision. Moreover, the performance of neural networks with good generalization skill can be further improved for unseen, special cases by fusing them with handcrafted features.
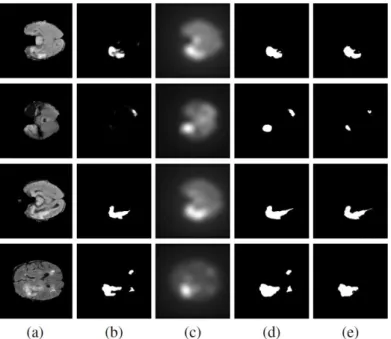
The examples in Fig. 2 illustrate the performance, the first two samples are generated by U-Net, third and fourth samples by WT-Net. In the first sample, the U-Net separates the tumor into 2 parts, while the saliency- based method gives a more homogeneous estimation, therefore their combination detects the whole tumor in one piece; in the second sample, both the U-Net and the saliency-based approach detect only one blob, thus their fusion is able to localize both areas. WT-Net achieves high accuracy values (see Table I in the Experimental evaluation), still its performance can be slightly increased by combining it with the saliency- based method, i.e. tumors with complex shape (third row). The fourth example shows that sometimes the estimation is quite similar for both the neural network and the saliency map, therefore their combination will also propagate the falsely detected blobs. Although the marked areas look suspicious even on the FLAIR image scan, according to the ground truth, only one tumor is present on this slice. Nevertheless, the hybrid model estimates the real tumor’s shape more accurately.
Experimental evaluation
We performed the evaluations on the BRATS2015 dataset [2], which includes altogether 220 HGG volumes and 54 LGG volumes (HGG and LGG stand for high-grade and low-grade glioma respectively) with T1, T1c, T2 and FLAIR sequences. Each volume has the size of 240×240×155 voxels with pixel-wise ground truth.
During the evaluation we used the axial view, i.e., 155 slices with a size of 240 ×240 pixels for each volume.
In our evaluation, we used a publicly available implementationof the U-Net. All available sequences (T1, T1c, T2 and FLAIR) were used for training with 16-bit slice images and 8-bit ground truth labels. The 90% of all BRATS2015 image volumes was randomly selected for training; the remaining 10% was used for testing. In the training part, 10 epochs were performed, the learning rate was set to 1e − 4, the loss type was binary cross entropy. From the training set 20% was randomly selected for validation. Two training runs were performed for the U-Net with two randomly partitioned training/test sets (Test set I and II). The performance was quantitatively evaluated for the randomly selected 22 HGG volumes. For comparison, the same volumes were evaluated for the original saliency-based method [9], the WT-Net based network [8] and for the proposed method as well.
72 We also evaluated the Test set I using the NiftyNet [11] implementation of the WT-Net. Similarly to the U-Net, WT-Net was also trained with 90% of the available sequences, learning rate was set to 1e−4, the applied loss type was Dice, and the training was performed in 20000 epochs. Again, 20% of the training volumes were randomly separated for validation.
Fig. 2. Fusion of neural networks and saliency-based features, row 1-2: UNet; row 3-4: WT-Net; (a) FLAIR image slice; (b) result of the neural network based segmentation; (c) calculated saliency map; (d) binary segmentation result achieved by the 0.5−0.5 weighted
combination (Eq. 8); (e) the binary ground truth for the whole tumor from BRATS2015.
Altogether, in one test set 3410 slices were evaluated for the WT-Net and its combined version with the saliency, and 6820 slices in two test sets were used for testing the original method, the proposed method, the U-Net based network and the U-Net – saliency combination.
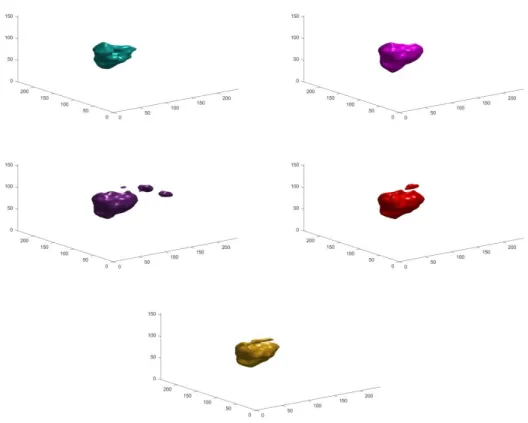
At the end a 3D representation with Gauss- smoothing was made to see the separated brain tumors together, instead of slice by slice. Besides the proposed method and the ground truth, U-Net, WT-Net and U-Net + Proposed have been visualized (Fig. 3).
We have calculated different quantitative measures: Precision, Recall, Fβ (β=0.3) and True Negative Ratio (TNR).
Quantitative results are given in Table I. As it can be seen, the proposed method outperforms the original approach by receiving higher precision and recall values. Out of the neural networks, WT-Net achieves higher performance than U-Net, however it should be mentioned, and that WT-Net was designed specifically for such brain tumor detection tasks (targeting the BRATS2017 dataset).
As for the fusion of U-Net and saliency-based methods, we have also tested 1/3 – 2/3 and 2/3 – 1/3 weightings, however, the results were just slightly worse than the performance of 0.5 – 0.5 weighting, therefore we only included the numbers for the weighting with the highest performance. Moreover, by fusing the calculated saliency map with the prediction map of the selected neural networks, higher precision, Fβ and TNR can be achieved. Please note, that the proposed method usually performs with lower recall and higher precision, which means that usually it gives smaller, but more precise estimations.
73
Fig. 3. 3D representation of a brain tumor with the different approaches; row 1: Proposed (turquoise) and Proposed + U-Net (magenta); row 2: U-Net (purple) and WT-Net (red); row 3: Ground Truth with yellow.
Two sample images are shown in Fig. 3 for the compared original and proposed methods, with 0.5 – 0.5 weighting for the hybrid models. The tumors are well localized by every algorithm; however their complex shapes are most accurately segmented by the fusion models.
To summarize the discussion, the results show that the combination of trained networks and handcrafted feature based techniques gives promising segmentation results; the fusion achieves higher precision and Fβ values than the performance of the network alone.
Table 1.
QUANTITATIVE RESULTS ON BRATS2015 DATASET FOR THE ORIGINAL ALGORITHM, THE PROPOSED METHOD, U-NET, WT-NET AND THEIR WEIGHTED COMBINATION WITH THE PROPOSED APPROACH.
BOTH TEST SETS CONSIST OF 22 HGG VOLUMES.
Algorithm
Test set I Test set II
Precision Recall Fβ TNR Precision Recall Fβ TNR
Original [9] 0.5949 0.2497 0.5340 0.8547 0.5766 0.2072 0.5026 0.8520
Proposed 0.8535 0.5328 0.8131 0.9738 0.8636 0.5093 0.8167 0.9756
U-Net [7] 0.6884 0.8812 0.7010 0.9593 0.6917 0.8844 0.7044 0.9674
U-Net + Proposed (0.5 – 0.5) 0.7356 0.8233 0.7422 0.9442 0.7461 0.8161 0.7514 0.9536
WT-Net [11] 0.8205 0.8569 0.8234 0.9748 0.8226 0.8559 0.8253 0.9753
WT-Net + Proposed (0.5 – 0.5) 0.8370 0.8115 0.8348 0.9783 0.7894 0.8626 0.7950 0.9743 WT-Net + Proposed (0.25 – 0.75) 0.8735 0.6443 0.8486 0.9851 0.8656 0.6195 0.8381 0.9890
74 Conclusion
In this paper, a novel, saliency-based algorithm has been introduced for tumor segmentation in brain MRI image volumes. The proposed method is based on a state-of-the-art approach; however novel features have been introduced for higher segmentation performance. A new pseudo-color model has been proposed, by building a healthy mean image template for FLAIR and T2 scans to highlight tumors as salient image regions.
To detect salient regions, the connectivity of neighboring slices was incorporated into the final saliency map besides color and spatial features. To detect the outline of the localized tumor, region-based active contour was applied.
The proposed model was also combined with two different, state-of-the-art convolutional neural networks (U- Net and WTNet), by introducing a weighting function for the saliency map and the networks prediction maps.
The combined map integrates the networks’ abstraction and the handcrafted features’ ability to also handle special, unseen cases more efficiently. Quantitative tests on the BRATS2015 dataset confirmed that the proposed model is quite efficient by itself, however by combining it with neural networks, the segmentation accuracy can further be increased.
In the future, we plan to create a more sophisticated fusion model of training-based methods and handcrafted features, by designing a deep convolutional network that incorporates the saliency features into the training process itself.
Acknowledgment
This work was partially funded by the Hungarian National Research, Development and Innovation Fund (NKFIA) grant nr. KH-126688 and the Hungarian Government, Ministry for National Economy (NGM), grant nr. GINOP-2.2.1-15-201700083.
REFERENCES
[1] Eric C Holland, “Progenitor cells and glioma formation,” Current opinion in neurology, vol. 14, no. 6, pp. 683–688, 2001.
[2] Bjoern H Menze, Andras Jakab, Stefan Bauer, Jayashree KalpathyCramer, Keyvan Farahani, Justin Kirby, Yuliya Burren, Nicole Porz, Johannes Slotboom, Roland Wiest, et al., “The multimodal brain tumor image segmentation benchmark (BRATS),” IEEE Transactions on medical imaging, vol. 34, no. 10, pp. 1993–2024, 2015.
[3] Marcel Prastawa, Elizabeth Bullitt, Sean Ho, and Guido Gerig, “A brain tumor segmentation framework based on outlier detection,” Medical Image Analysis, vol. 8, no. 3, pp. 275–283, 2004.
[4] Mikael Agn, Oula Puonti, Ian Law, PM af Rosenschöld and K van Leemput, “Brain tumor segmentation by a generative model with a prior on tumor shape”, Proceeding of the Multimodal Brain Tumor Image Segmentation Challenge, pp. 1-4, 2015.
[5] Stefan Bauer, Lutz-P Nolte, and Mauricio Reyes, “Fully automatic segmentation of brain tumor images using support vector machine classification in combination with hierarchical conditional random field regularization,” in International Conference on Medical Image Computing and Computer-Assisted Intervention, 2011, pp. 354–361.
[6] Wei Wu, Albert YC Chen, Liang Zhao, and Jason J Corso, “Brain tumor detection and segmentation in a CRF (conditional random fields) framework with pixel-pairwise affinity and superpixel-level features,” International Journal of Computer Assisted Radiology and Surgery, vol. 9, no. 2, pp. 241–253, 2014.
[7] Olaf Ronneberger, Philipp Fischer, and Thomas Brox, “U-net: Convolutional networks for biomedical image segmentation,”
in International Conference on Medical image computing and computer-assisted intervention. Springer, 2015, pp. 234–241.
[8] Wang Guotai, Li Wenqi, Ourselin Sebastien, and Vercauteren Tom, “Automatic brain tumor segmentation using cascaded anisotropic convolutional neural networks,” in Brainlesion: Glioma, Multiple Sclerosis, Stroke and Traumatic Brain Injuries.
Springer, 2018, pp. 179–190.
[9] Subhashis Banerjee, Sushmita Mitra, B Uma Shankar, and Yoichi Hayashi, “A novel GBM saliency detection model using multi-channel MRI,” PloS one, vol. 11, no. 1, pp. e0146388, 2016.
[10] Tony F. Chan and Luminita A. Vese, “Active contours without edges,” IEEE Trans. on Image Processing, vol. 10, no. 2, pp.
266–277, 2001.
[11] Eli Gibson, Wenqi Li, Carole Sudre, Lucas Fidon, Dzhoshkun I. Shakir, Guotai Wang, Zach Eaton-Rosen, Robert Gray, Tom Doel, Yipeng Hu, Tom Whyntie, Parashkev Nachev, Marc Modat, Dean C. Barratt, Sbastien Ourselin, M. Jorge Cardoso, and Tom Vercauteren, “Niftynet: a deep-learning platform for medical imaging,” Computer Methods and Programs in Biomedicine, vol. 158, pp. 113 – 122, 2018.