Investigating Tissue Optical Properties and Texture Descriptors of the Retina in Patients with Multiple Sclerosis
Boglárka EnikőVarga1, Wei Gao2, Kornélia Lenke Laurik1, Erika Tátrai1, Magdolna Simó3, Gábor Márk Somfai1,2, Delia Cabrera DeBuc2*
1Department of Ophthalmology, Faculty of Medicine, Semmelweis University, Budapest, Hungary, 2Bascom Palmer Eye Institute, University of Miami, Miller School of Medicine, Miami, Florida, United States of America,3Department of Neurology, Faculty of Medicine, Semmelweis University, Budapest, Hungary
*dcabrera2@med.miami.edu
Abstract
Purpose
To assess the differences in texture descriptors and optical properties of retinal tissue layers in patients with multiple sclerosis (MS) and to evaluate their usefulness in the detection of neurodegenerative changes using optical coherence tomography (OCT) image
segmentation.
Patients and Methods
38 patients with MS were examined using Stratus OCT. The raw macular OCT data were exported and processed using OCTRIMA software. The enrolled eyes were divided into two groups, based on the presence of optic neuritis (ON) in the history (MSON+ group, n = 36 and MSON- group, n = 31). Data of 29 eyes of 24 healthy subjects (H) were used as con- trols. A total of seven intraretinal layers were segmented and thickness as well as optical parameters such as contrast, fractal dimension, layer index and total reflectance were mea- sured. Mixed-model ANOVA analysis was used for statistical comparisons.
Results
Significant thinning of the retinal nerve fiber layer (RNFL), ganglion cell/inner plexiform layer complex (GCL+IPL) and ganglion cell complex (GCC, RNFL+GCL+IPL) was observed between study groups in all comparisons. Significant difference was found in contrast in the RNFL, GCL+IPL, GCC, inner nuclear layer (INL) and outer plexiform layer when comparing MSON+ to the other groups. Higher fractal dimension values were observed in GCL+IPL and INL layers when comparing H vs. MSON+ groups. A significant difference was found in layer index in the RNFL, GCL+IPL and GCC layers in all comparisons. A significant differ- ence was observed in total reflectance in the RNFL, GCL+IPL and GCC layers between the three examination groups.
OPEN ACCESS
Citation:Varga BE, Gao W, Laurik KL, Tátrai E, Simó M, Somfai GM, et al. (2015) Investigating Tissue Optical Properties and Texture Descriptors of the Retina in Patients with Multiple Sclerosis. PLoS ONE 10(11): e0143711. doi:10.1371/journal.
pone.0143711
Editor:Knut Stieger, Justus-Liebig-University Giessen, GERMANY
Received:October 24, 2014 Accepted:November 9, 2015 Published:November 30, 2015
Copyright:© 2015 Varga et al. This is an open access article distributed under the terms of the Creative Commons Attribution License, which permits unrestricted use, distribution, and reproduction in any medium, provided the original author and source are credited.
Data Availability Statement:All relevant data are within the paper and its Supporting Information files.
Funding:This work was supported by a Juvenile Diabetes Research Foundation Grant (http://jdrf.org/
grant-center/(DCD)); National Institute of Health Grant No. NIH R01EY020607 (http://grants.nih.gov/
grants/funding/r01.htm(DCD)); National Institute of Health Center Grant No. P30-EY014801 (http://www.
nimh.nih.gov/funding/grant-writing-and-application- process/p30-centers-program-research-core-grants.
shtml(DCD)); Research to Prevent Blindness Inc.
(http://www.rpbusa.org/rpb/grants/grants/
Conclusion
Texture and optical properties of the retinal tissue undergo pronounced changes in MS even without optic neuritis. Our results may help to further improve the diagnostic efficacy of OCT in MS and neurodegeneration.
Introduction
Multiple sclerosis (MS) is a neurodegenerative disorder, a chronic inflammatory process that affects the central nervous system (CNS) by the demyelination of axons of the brain and spinal cord. It is the most common disease of the CNS that causes permanent disability in young adults. [1] The non-myelinated parts of the axons of the retinal ganglion cells, the retinal nerve fiber layer (RNFL) provides an optimal opportunity to examine the neuronal loss caused by demyelination.
Optical coherence tomography (OCT) is a non-invasive, non-contact, high-resolution imaging modality that is capable of capturing cross-sectional images of the retina. [2] It is based on the optical reflectance differences of the analyzed tissue and thus it may be applied in the detection of pathological retinal changes. [3] OCT technology has gained very wide use in ophthalmology and it is stipulated that it is one of the most frequently used decision making techniques in the field. [4] The use of custom-built algorithms for the segmentation of retinal OCT images may enable the detection and follow-up of early neural loss in patients with MS.
[5–8] It has also been postulated that the inner nuclear layer (INL) is possibly also involved in the pathological processes in MS, with different observations describing microcystic edema of the INL and also the thickness changes of the INL. [9,10]
Although thickness differences may discern regions with signs of retinal disease from nor- mal regions, differences in texture descriptors of normal and abnormal retinal tissue may also provide additional information of disease development. In fact, the appropriateness of texture to classify tissues in OCT images has been shown in previous studies. [11] By analyzing the spatial arrangement of color or intensities in an image or selected region of interest (ROI), the image irregularities can be measured. Consequently, texture features, such as contrast and frac- tal dimension could be analyzed for the macula and each intraretinal layer. The fractal dimen- sion (FD) of a profile or surface is a roughness measure regarded as a local property of the system with higher values indicating rougher surface. [12] There are different methods to determine the FD. The typical conventional approach used to calculate the fractal dimension of an image is the box-counting method but the power spectrum method is demonstrated to be more robust. [13,14]
Finally, as mentioned above, the most common parameter investigated during the OCT examination is retinal thickness. In reality, reflectance is the direct measurement from which thickness is calculated in OCT systems. The human retina is an almost transparent tissue that only reflects about 1% of the incident light. [15] Retinal tissue is characterized by many small random fluctuations in refractive index caused by the ultrastructure of the tissue. [16] As a con- sequence, incident light on tissue is deflected or scattered off this structure. Therefore, differ- ences in optical properties of normal and abnormal retinal tissue may also provide additional information of disease development in pathological eyes allowing OCT technology to be used for quantitative analysis of tissue optical properties. [17–19] Accordingly, Bizheva et al have shown previously that optical properties of the retina may change due to their metabolic activ- ity. They were using optical coherence tomography for this purpose and named the method
(unrestricted grant to the University of Miami, DCD));
Hungarian Academy of Sciences, Zsigmond Diabetes Fund (http://mta.hu/english/(GMS)); Hungarian Scholarship Fund, Eötvös Scholarship (http://www.
scholarship.hu/(GMS)). The funders had no role in study design, data collection and analysis, decision to publish, or preparation of the manuscript. This work was also supported by Helen Keller Foundation for Research and Education (http://www.
helenkellerfoundation.org/(GMS)). Also, the authors declare that this funder also had no role in study design, data collection and analysis, decision to publish, or preparation of the manuscript.
Competing Interests:The authors have read the journal’s policy and the authors of this manuscript have the following financial competing interests: The University of Miami and Dr. Cabrera DeBuc hold a patent used in the study and have the potential for financial benefit from its future commercialization.
The data of the patent: U.S. Patent No. 8 868 155;
Name: System and method for early detection of diabetic retinopathy using optical coherence tomography; Pub. No. : WO/2010/080576.
International Application No. :PCT/US2009/068653.
This patent does not alter the authors' adherence to all PLOS ONE policies on sharing data and materials, as detailed online in the PLOS One’s guide for authors. There are no restrictions on sharing of data and/or materials. All the other authors have nothing to declare. All authors declared that no other competing interests exist.
optophysiology. [20] Huang et al. have shown the early changes of reflectance of the RNFL in a rat model of glaucoma preceding the pathological changes in the retina. [21] We have shown previously that diabetes not only causes thinning of the inner retinal layers, but also reduces the amplitude of the back-reflected signal from these layers. [22,23] Consequently, diagnostic predictors based on reflectance changes may be of interest in multiple sclerosis as well where pathological processes of the inner retina have been well described previously.
In this study, the differences in texture and optical properties of the retinal tissue in patients with MS compared to healthy subjects are evaluated using OCT image segmentation in order to investigate their usefulness in the detection of retinal neurodegenerative changes. Significant differences in the nerve fiber layer and the ganglion cell/plexiform layer complex are observed in MS patients compared to healthy subjects and in eyes affected by optic neuritis compared to those unaffected. Our findings may help to further improve the diagnostic efficacy of OCT in MS and neurodegeneration.
Patients and Methods
Study Population and examinations
All participants were treated in accordance with the tenets of the Declaration of Helsinki. Insti- tutional Review Board approval was obtained for all study protocols (Semmelweis University Regional and Institutional Committee of Sciences and Research Ethics). Written informed con- sent was obtained from all participants in this study. Thirty-eight patients with relapsing- remitting multiple sclerosis were enrolled from the Department of Neurology of Semmelweis University. The clinical data, including disease duration, medical treatment and the date of MSON episodes was compiled as part of a complete neurological examination performed by a board-certified neurologist. Based on the neurological, functional, elecrophysiological, radio- logical and laboratory examinations, all ON episodes were diagnosed as MS associated ON and all patients were meeting the revised McDonald criteria. [24] The control group (H) was made of twenty-nine randomly selected eyes of twenty-four age-matched healthy controls.
Each subject underwent routine ophthalmic examination including best corrected visual acuity measurement, applanation tonometry, critical flicker frequency assessment (CFF) and slit-lamp examination. All study subjects were assessed by the same, expert and trained opera- tor with a Stratus OCT device (Carl Zeiss Meditec Inc., Dublin, CA, USA) using the“macular map protocol”, which consists of six fovea centered scan lines in radial directions, each having a 6 mm transverse length. One study eye per each patient was selected randomly.
In order to ensure quality control of the OCT scans included and segmented in the study, we used the scan quality factor (SQF) criteria in OCTRIMA for checking the scan variance using the foveal center point thickness as reported previosuly [25] and also adapted the OSCAR-IB system described by Tewarie at al. [26]
The scan quality factor (SQF) is based on the standard deviation calculation (in percent) of the center point thickness (CPT) for the six radial line scans included in the OCTRIMA soft- ware and is used to control the variability of measurements associated to image acquisition pit- falls. A high standard deviation (>10% of center point thickness) means high variability, usually due to patient movement or boundary line error, thus leading to incorrect center point thickness values. [25,27] We only included scans with a SQF = 1, indicating that the percent- age standard deviation of the foveal center point was10%.
Furthermore, using the OSCAR-IB system the following details were observed and evaluated on each set of scans to be included in the study: Obvious problems not covered by items below;
Sufficient OCT Signal (SS>6, [25]); Foveal centered scans (as a second pass of quality control);
Algorithm failure; Retinal pathology impairing the segmentation; Proper fundus illumination;
and Measurement beam placed centrally (no tilting of the B-scans). The exclusion criteria were similar to those applied by Tewarie et al., including the following: (1) spherical or cylindrical cor- rection higher than 3.0 diopters, (2) the presence of any media opacities (corneal pathologies, cat- aract, floaters, etc.) (3) the presence of any retinal disease or optic neuropathy including
glaucoma, except ON, (4) intraocular pressure higher than 20 mmHg in the medical history, (5) previous eye surgery, (6) amblyopia, (7) last MSON episode less than 6 months prior to enroll- ment, (8) bad fixation cooperation during the OCT examination (e.g. due to nystagmus) and (9) low signal strength of the OCT images (SS6). None of the patients were under fingolimod treat- ment before and during the examination period. [28] As in previous TD-OCT studies [29–31]
where highly repeatable measurements have been obtained with signal intensity scores of at least 6 to 7, we excluded images with signal strength SS6 as we have previously shown this is the threshold for repeatable segmentation analysis with OCTRIMA. [25]
The eligibility criteria for control subjects were best-corrected Snellen visual acuity of 20/20 and the lack of any ocular or systemic diseases, with good quality OCT scans as described above.
OCT image processing
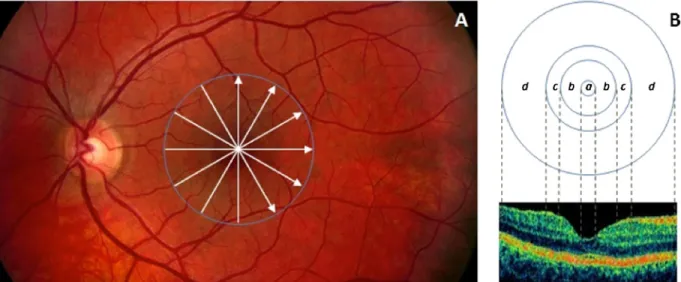
The radial scans were exported and processed by a custom-built software (OCTRIMA) devel- oped by Cabrera et al. [6]. This OCT image segmentation program is capable of segmenting 7 cellular layers of the retina based on their optical densities (seeFig 1): the RNFL, the ganglion cell and inner plexiform layer complex (GCL+IPL), the INL, the outer plexiform layer (OPL), the outer nuclear layer and inner photoreceptor segment (ONL+IS), outer photoreceptor seg- ment (OS) and retinal pigment epithelium (RPE). [6] Because of the special arrangement of the retinal structure below the foveal pit where the inner retinal layers are displaced concentrally,
Fig 1. Macular image segmentation results using OCTRIMA.(A) The image of a healthy macula scanned by Stratus OCT with the division of the macular regions used for the analysis (foveolar region (a) with a diameter of 0.375 mm, foveal region (b) with a diameter of 1.85 mm; parafoveal region (c) with a diameter of 2.85 mm and perifoveal region (d) with a diameter of 5.85 mm) (B) The same OCT scan processed with OCTRIMA. Abbreviations: Ch, choroid;
GCL+IPL, ganglion cell layer and inner plexiform layer complex; INL, inner nuclear layer; ONL+IS, combined outer nuclear layer and inner segment of photoreceptors; OS, outer segment of photoreceptors; OPL, outer plexiform layer; RNFL, retinal nerve fiber layer; RPE, retinal pigment epithelial layer; V, vitreous.
doi:10.1371/journal.pone.0143711.g001
the segmentation of the foveolar region was limited to the three outer retinal layers (ONL+IS, OS, RPE).
The OCTRIMA software integrates a denoising and edge enhancement technique (also removing the speckle noise) along with a segmentation algorithm. [6] In our previous works the high repeatability and reproducibility of OCTRIMA measurements in healthy subjects was found. The reproducibility was the highest for the thickness measurements of the ONL, gan- glion cell complex (GCC, composed by the RNFL and GCL+IPL), GCL+IPL and RNFL, the inter- and intraexaminer, intervisit variabilities being around the resolution of currently avail- able OCT devices for all layers (<6μm for all layers and all comparisons). [25] It is of note that total retinal thickness is measured between the inner limiting membrane and the inner bound- ary of the photoreceptor outer segment/RPE junction by this software. It is also important to mention that ONL is a thin membrane, which contains both the external limiting membrane and the inner segment of the photoreceptors. This layer cannot be visualized clearly in Stratus OCT images which makes the segmentation of the inner segment more difficult. Thus, the seg- mentation of this layer does not reflect the actual anatomic structure.
The eyes of the MS patients were divided into two study groups for further analyses. The first group was composed of 36 eyes, which had MS-associated ON at least 6 months prior to enrollment (MSON+). 31 eyes without ON episode (MSON-) in the history formed the second group. The diagnosis of optic neuritis was based on the patient's medical history. An acute epi- sode of MSON was defined by clinical symptoms such as decreased visual acuity developing in few days, pain on eye movement, abnormal response on visual evoked potential examination confirming prechiasmal lesion and decrease in the CFF. The CFF is a basic examination of optic nerve function, and plays an important role in the diagnosis and also in the follow-up of ON. Decreased CFF is a common characteristic of an acute ON episode, and it also can be affected after the recovery both of which can help to establish the diagnosis of ON. In most cases a good recovery was observed within 2–3 months. In the subjects with ON appearing as a first symptom, routine MRI examinations showed characteristic signs of MS and confirmed the diagnosis. Demographic and clinical characteristics including age, gender, duration of dis- ease, elapsed time between the last MSON episode and OCT examination and best corrected visual acuity are shown inTable 1.
Retinal layer thickness, texture and optical measurements on OCT images
In order to evaluate the diagnostic power of optical properties and texture descriptors com- pared to standard thickness measurements, mean thickness values per intraretinal layer were
Table 1. Descriptive statistics of the study participants.
Healthy group MSON- group MSON+ group
Number of eyes 29 31 36
Number of subjects(female/male) 24 (16/8) 25 (14/11) 26 (19/7)
Age(years,mean±SD,[median]) 33±9 [31] 34±9 [35] 34±9 [35]
BCVA(mean±SD,[median]) 1.0±0.00 [1.0] 1.0±0.00 [1.0] 0.91±0.25 [1.0]
Disease duration(months,mean±SD [median]) N/A 71±51 [48] 72±51 [53]
Elapsed time between last MSON episode and examination date(months,mean±SD [median]) N/A N/A 49±38 [38]
Abbreviations: SD (standard deviation); H (Healthy subjects group); MSON- (eyes of patients with multiple sclerosis without optic neuritis in medical history); MSON+ (eyes of patients with multiple sclerosis with optic neuritis in medical history); BCVA (best corrected visual acuity).
doi:10.1371/journal.pone.0143711.t001
extracted by computation of the mean distance between the borders of each layer. We note that we removed the noise first and then performed the processing so that noise effect could be nul- lified. Therefore, all calculations were performed after removing the speckle noise from raw OCT data using a complex diffusion filter. [6] We also note that factors extrinsic to the retina, such as media opacity, poor focusing, and scanning pitfalls, were removed by taking the ratio of the average reflectivity signal within the retina and each intraretinal layers and dividing it by the average reflectivity signal from a reference layer. Accordingly, the analyses performed using parameters based on optical properties and tissue descriptors considered mean reflectivity val- ues that were calculated using reflectivity with normalization to the RPE reflectance (NRPE).
[32] The mean values were calculated to each layer across the six radial OCT scans. [33]
A method based on the power spectrum was used to calculate the fractal dimension in OCT images. [14] Since the average power spectrum of an image obeys a power law scaling, the frac- tal dimension was calculated from the power law detected in the graph of the power spectrum as a function of the frequency in the Fourier transform of the OCT image (gray scale). In this particular case, when the graph is plotted in a log-log scale the curve is approximately similar to a straight line and the dimension is provided by the slope of the line.
The fast Fourier transform (FFT) was applied to the OCT reflectance’s profiles to obtain the power spectrum as follows:
PðoÞ ob ð1Þ
where P(ω) is the power spectrum with the frequencyω.βis the spectral exponent of the reflec- tance profile. The Eq (1) can be converted into:
lnðPðoÞÞ blnðoÞ ð2Þ The fractal dimension is linked to the power-law exponent by the following relationship:
[14]
FD¼5b
2 ð3Þ
Therefore, the fractal dimension was evaluated from the slopeβof a least-square regression line fit to the data points in log-log plot of power spectrum. The fractal dimension was calcu- lated for the reflectance profile within each intraretinal layer for each A-scan. The mean value of the fractal dimension was calculated by averaging the fractal dimension measurements across all A-scans in each macular region of each intraretinal layer. MATLAB software (The Mathworks, Natick, MA) was used to perform the fractal dimension analysis using a custom- built algorithm. Contrast measures were extracted by using second-order statistical texture analysis.
Optical properties such as total reflectance and layer index has been described previously and calculated as follows. [23,33,34] Total reflectanceTRkwas calculated by summarizing reflectivity values of the elements in the columnkof the selected ROI.
TRk¼MRkHk
Dy ð4Þ
whereMRkis the mean reflectance in the columnkof the selected ROI,Hkis the local thickness of ROI in the column ofk, andΔyis the pixel resolution defined by the OCT device.
Layer indexLIkwas defined as:
LIk¼MRkHk Isa ¼ 1
Nk
XNk
j¼1
Ij;kHk
Isa ð5Þ
whereMRkis the mean reflectance in the columnkof the selected ROI,Hkis the local thickness of ROI in the column ofk.Isais the reflectivity value representing the99%of all recorded reflectivity values in a given retinal OCT image.
It is worth to note that before the calculation of parameters related to reflectance values, the lateral coordinates of the blood vessel shadows were obtained by the help of a blood vessel shadowgram technique and were removed in each OCT image. [35] Following this, these shadows were removed in each OCT image before calculating the values for reflectance.
Total reflectance values included average values of reflectance with normalization to the RPE reflectance (NRPE). Average values of total reflectance per intraretinal layer were calculated.
Total reflectance values were converted to decibels (dB = 10 ×log10 [TR]). Layer index parameter was based on the mean reflectance corrected to the thickness of the region of interest and the 99% of the total reflectance of the scan (see details above andEq 5). [18] All calculated values were expressed in the foveolar, foveal, parafoveal and perifoveal regions and also as a mean across all macular regions. (Fig 2.) In the foveolar region, the calculations were limited to the outer retinal layers (OPL+IS, OS, RPE). For the analyses an additional composite layer was defined, the GCC consisting of the RNFL and GCL+IPL layers with the purpose to observe the changes of the whole ganglion cell with its proximal and distal denrites.
Statistical analyses
In order to correct for inter-eye bias, mixed model ANOVA analysis was used for the compari- son of thickness and optical parameters among the groups. Statistical analyses were performed using the software package SPSS version 16 (SPSS Inc, Chicago, Illinois). A modified p value (p<0.001) was considered as statistically significant.
Fig 2. Retinal scanning and macular regions used in the study.(A) The fundus image of a healthy eye. The white arrows in the macula show the locations of the OCT scans made. (B) The distribution of macular regions: foveolar region (a) with the diameter of 0.375 mm, foveal region (b) with a diameter of 1.85 mm; parafoveal region (c) with a diameter of 2.85 mm and perifoveal region (d) with a diameter of 5.85 mm.
doi:10.1371/journal.pone.0143711.g002
Results Thickness
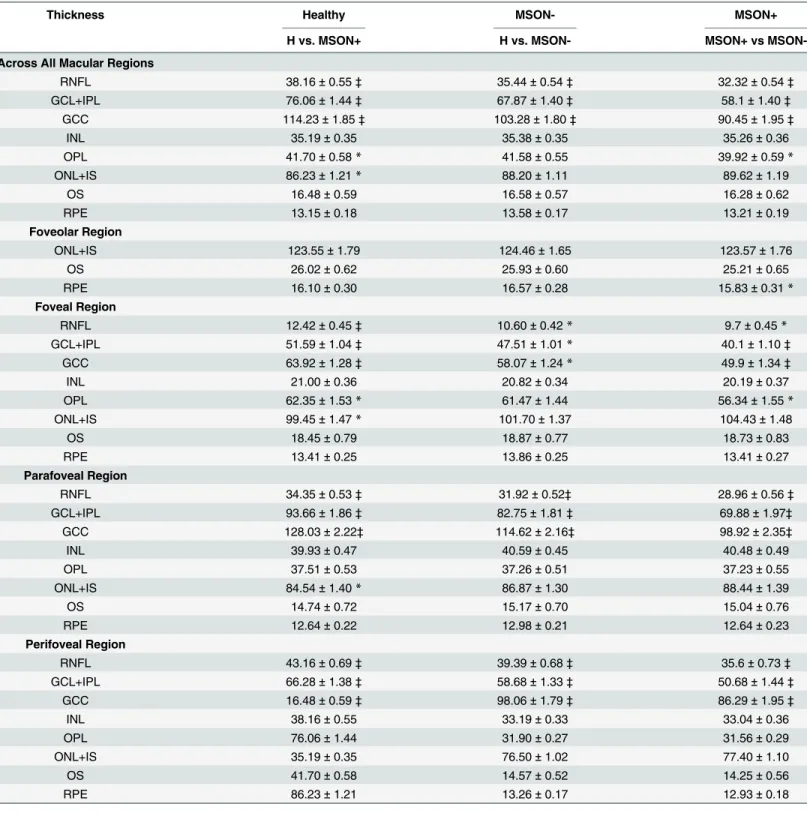
The thinning of the RNFL, GCL+IPL and also GCC was significant in all comparisons in each macular region except the foveal region. In the foveal region significant difference was observed in GCC between H, MSON- and MSON+ groups, in RNFL between H and MSON+, and GCL+IPL in MSON+ compared to the others. (Table 2.)
Contrast
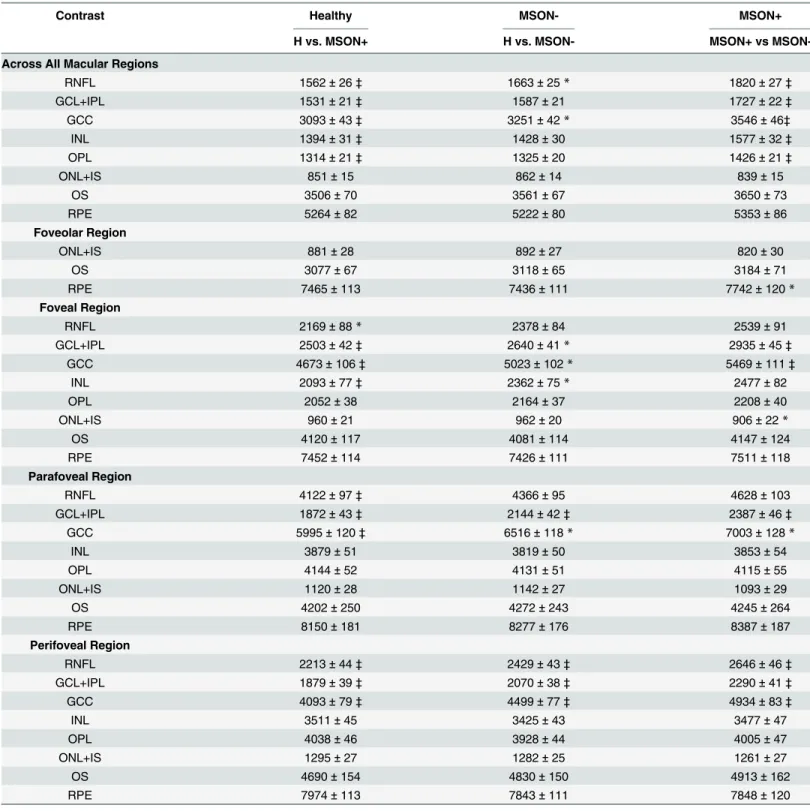
Significantly higher contrast values were observed in the MSON+ group compared to the H and MSON- groups in the RNFL, GCL+IPL, INL, OPL and GCC layers, in the whole macular region. A significant difference was found in the foveal region between MSON+ and the two other groups in the GCL+IPL and GCC, similarly to the INL in the MSON+ versus the healthy group. The GCL+IPL was significantly different between the three groups in the parafoveal region, and so was the RNFL and GCC in the MSON+ vs. H comparison. The perifoveal region showed a significant difference between the three groups in the RNFL, GCL+IPL and GCC lay- ers. (Table 3.)
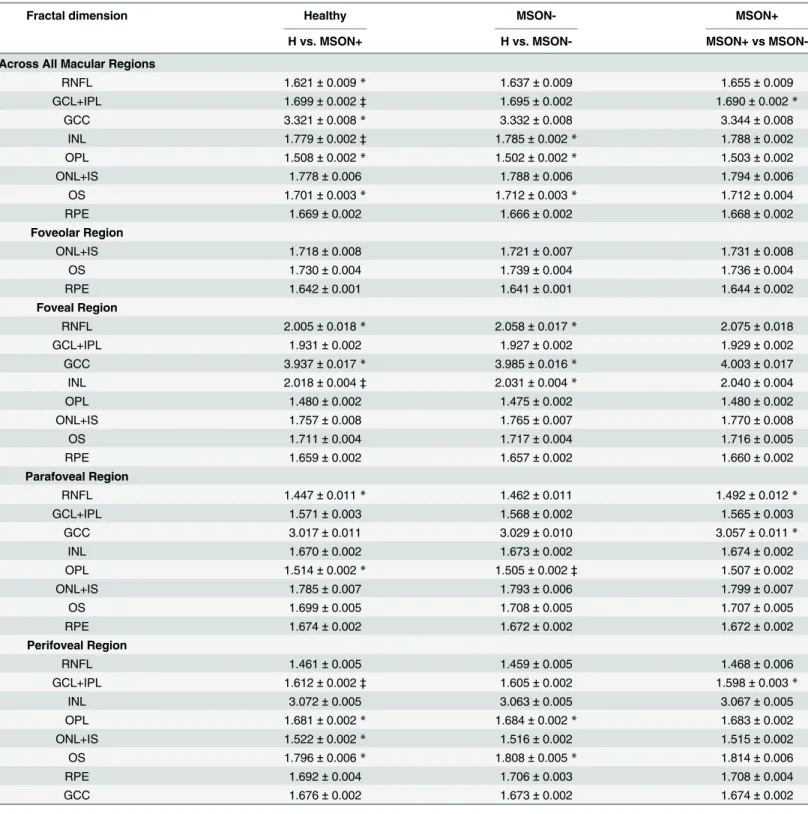
Fractal dimension
Fractal dimension was significantly higher in the MSON+ group compared to the H and MSON- groups in the GCL+IPL and INL in the whole macular region, in the INL in the foveal and in the GCL+IPL in the perifoveal regions. Also, a significant difference was found in the OPL between the H and MSON- groups in the parafoveal region. There were no significant dif- ferences found in any other layers in other comparisons. (Table 4.)
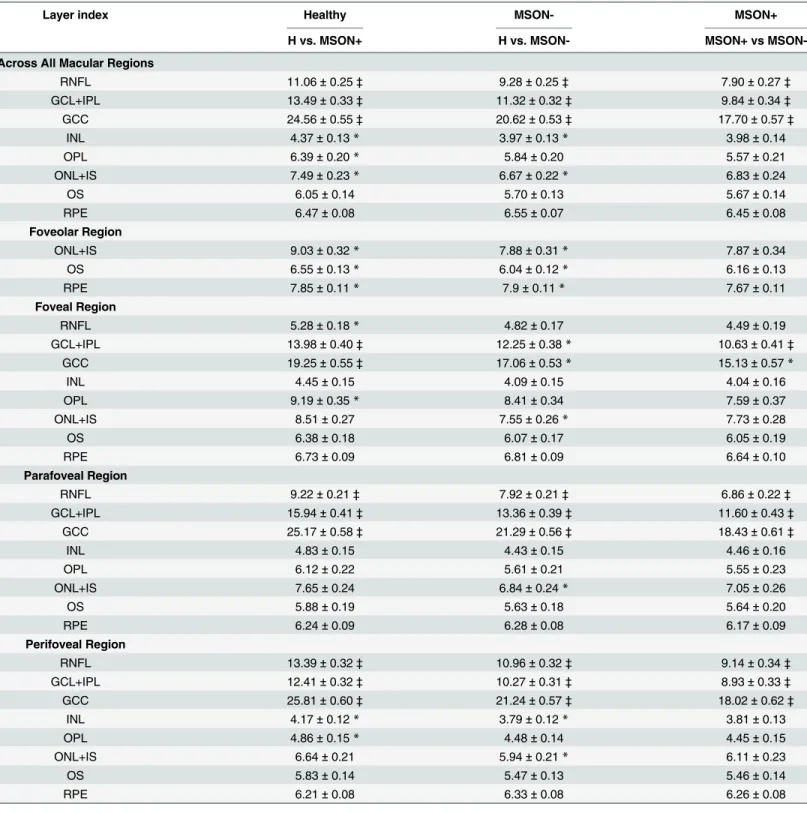
Layer index
The layer index values were significantly lower in the MSON- and MSON+ groups compared to the healthy controls, and also in the MSON+ versus MSON- comparisons in the RNFL, GCL+IPL and GCC in the whole macular, parafoveal and perifoveal regions. In the foveal region the GCL+IPL was significantly thinner in MSON+ compared to the other two groups, and the same was observed for the GCC in the MSON+ and H groups. (Table 5.)
Total reflectance
The total reflectance was found significantly different in the RNFL and GCC in both disease groups in the whole macular, the parafoveal and perifoveal regions, and the same was true for the GCL+IPL between the three groups in the parafoveal and perifoveal regions. In the foveal region a significant difference was observed in GCL+ IPL in MSON+ compared to the other groups, and also in the GCC complex for the comparison between the MSON+ and H groups.
(Table 6.) Discussion
Optical coherence tomography has been used extensively to describe structural changes in the retina. In case of patients with multiple sclerosis, significant changes of retinal structure were previously described by histology and by Fourier-domain OCT (FD-OCT) image segmenta- tion, not only in the inner, but also in the outer retinal layers. [36–39] Green et al. conducted postmortem evaluations in 82 patients with MS. They found histological changes not only in the ganglion cell layer but also in the inner nuclear layer, comprising the bipolar and amacrine
Table 2. Distribution statistics of the thickness (μm) of intraretinal layers by study group, represented as means±SD.
Thickness Healthy MSON- MSON+
H vs. MSON+ H vs. MSON- MSON+ vs MSON-
Across All Macular Regions
RNFL 38.16±0.55‡ 35.44±0.54‡ 32.32±0.54‡
GCL+IPL 76.06±1.44‡ 67.87±1.40‡ 58.1±1.40‡
GCC 114.23±1.85‡ 103.28±1.80‡ 90.45±1.95‡
INL 35.19±0.35 35.38±0.35 35.26±0.36
OPL 41.70±0.58* 41.58±0.55 39.92±0.59*
ONL+IS 86.23±1.21* 88.20±1.11 89.62±1.19
OS 16.48±0.59 16.58±0.57 16.28±0.62
RPE 13.15±0.18 13.58±0.17 13.21±0.19
Foveolar Region
ONL+IS 123.55±1.79 124.46±1.65 123.57±1.76
OS 26.02±0.62 25.93±0.60 25.21±0.65
RPE 16.10±0.30 16.57±0.28 15.83±0.31*
Foveal Region
RNFL 12.42±0.45‡ 10.60±0.42* 9.7±0.45*
GCL+IPL 51.59±1.04‡ 47.51±1.01* 40.1±1.10‡
GCC 63.92±1.28‡ 58.07±1.24* 49.9±1.34‡
INL 21.00±0.36 20.82±0.34 20.19±0.37
OPL 62.35±1.53* 61.47±1.44 56.34±1.55*
ONL+IS 99.45±1.47* 101.70±1.37 104.43±1.48
OS 18.45±0.79 18.87±0.77 18.73±0.83
RPE 13.41±0.25 13.86±0.25 13.41±0.27
Parafoveal Region
RNFL 34.35±0.53‡ 31.92±0.52‡ 28.96±0.56‡
GCL+IPL 93.66±1.86‡ 82.75±1.81‡ 69.88±1.97‡
GCC 128.03±2.22‡ 114.62±2.16‡ 98.92±2.35‡
INL 39.93±0.47 40.59±0.45 40.48±0.49
OPL 37.51±0.53 37.26±0.51 37.23±0.55
ONL+IS 84.54±1.40* 86.87±1.30 88.44±1.39
OS 14.74±0.72 15.17±0.70 15.04±0.76
RPE 12.64±0.22 12.98±0.21 12.64±0.23
Perifoveal Region
RNFL 43.16±0.69‡ 39.39±0.68‡ 35.6±0.73‡
GCL+IPL 66.28±1.38‡ 58.68±1.33‡ 50.68±1.44‡
GCC 16.48±0.59‡ 98.06±1.79‡ 86.29±1.95‡
INL 38.16±0.55 33.19±0.33 33.04±0.36
OPL 76.06±1.44 31.90±0.27 31.56±0.29
ONL+IS 35.19±0.35 76.50±1.02 77.40±1.10
OS 41.70±0.58 14.57±0.52 14.25±0.56
RPE 86.23±1.21 13.26±0.17 12.93±0.18
Abbreviations: SD (standard deviation); H (Healthy subjects group); MSON- (eyes of patients with multiple sclerosis without optic neuritis in medical history); MSON+ (eyes of patients with multiple sclerosis with optic neuritis in medical history); GCC (ganglion cell complex. the RNFL and GCL+IPL layers together)
*0.001<p<0.05 and
‡p<0.001 (Mixed-model analysis ANOVA) between H and MSON+ (see H column). H and MSON- (see MSON- column) and between MSON- and MSON + (see MSON+ column)
doi:10.1371/journal.pone.0143711.t002
Table 3. Distribution statistics of the contrast (a.u) of intraretinal layers by study group, represented as means±SD.
Contrast Healthy MSON- MSON+
H vs. MSON+ H vs. MSON- MSON+ vs MSON-
Across All Macular Regions
RNFL 1562±26‡ 1663±25* 1820±27‡
GCL+IPL 1531±21‡ 1587±21 1727±22‡
GCC 3093±43‡ 3251±42* 3546±46‡
INL 1394±31‡ 1428±30 1577±32‡
OPL 1314±21‡ 1325±20 1426±21‡
ONL+IS 851±15 862±14 839±15
OS 3506±70 3561±67 3650±73
RPE 5264±82 5222±80 5353±86
Foveolar Region
ONL+IS 881±28 892±27 820±30
OS 3077±67 3118±65 3184±71
RPE 7465±113 7436±111 7742±120*
Foveal Region
RNFL 2169±88* 2378±84 2539±91
GCL+IPL 2503±42‡ 2640±41* 2935±45‡
GCC 4673±106‡ 5023±102* 5469±111‡
INL 2093±77‡ 2362±75* 2477±82
OPL 2052±38 2164±37 2208±40
ONL+IS 960±21 962±20 906±22*
OS 4120±117 4081±114 4147±124
RPE 7452±114 7426±111 7511±118
Parafoveal Region
RNFL 4122±97‡ 4366±95 4628±103
GCL+IPL 1872±43‡ 2144±42‡ 2387±46‡
GCC 5995±120‡ 6516±118* 7003±128*
INL 3879±51 3819±50 3853±54
OPL 4144±52 4131±51 4115±55
ONL+IS 1120±28 1142±27 1093±29
OS 4202±250 4272±243 4245±264
RPE 8150±181 8277±176 8387±187
Perifoveal Region
RNFL 2213±44‡ 2429±43‡ 2646±46‡
GCL+IPL 1879±39‡ 2070±38‡ 2290±41‡
GCC 4093±79‡ 4499±77‡ 4934±83‡
INL 3511±45 3425±43 3477±47
OPL 4038±46 3928±44 4005±47
ONL+IS 1295±27 1282±25 1261±27
OS 4690±154 4830±150 4913±162
RPE 7974±113 7843±111 7848±120
Abbreviations: SD (standard deviation); H (Healthy subjects group); MSON- (eyes of patients with multiple sclerosis without optic neuritis in medical history); MSON+ (eyes of patients with multiple sclerosis with optic neuritis in medical history); GCC (ganglion cell complex. the RNFL and GCL+IPL layers together)
*0.001<p<0.05 and
‡p<0.001 (Mixed-model analysis ANOVA) between H and MSON+ (see H column). H and MSON- (see MSON- column) and between MSON- and MSON + (see MSON+ column)
doi:10.1371/journal.pone.0143711.t003
Table 4. Distribution statistics of the fractal dimension (a.u) of intraretinal layers by study group, represented as means±SD.
Fractal dimension Healthy MSON- MSON+
H vs. MSON+ H vs. MSON- MSON+ vs MSON-
Across All Macular Regions
RNFL 1.621±0.009* 1.637±0.009 1.655±0.009
GCL+IPL 1.699±0.002‡ 1.695±0.002 1.690±0.002*
GCC 3.321±0.008* 3.332±0.008 3.344±0.008
INL 1.779±0.002‡ 1.785±0.002* 1.788±0.002
OPL 1.508±0.002* 1.502±0.002* 1.503±0.002
ONL+IS 1.778±0.006 1.788±0.006 1.794±0.006
OS 1.701±0.003* 1.712±0.003* 1.712±0.004
RPE 1.669±0.002 1.666±0.002 1.668±0.002
Foveolar Region
ONL+IS 1.718±0.008 1.721±0.007 1.731±0.008
OS 1.730±0.004 1.739±0.004 1.736±0.004
RPE 1.642±0.001 1.641±0.001 1.644±0.002
Foveal Region
RNFL 2.005±0.018* 2.058±0.017* 2.075±0.018
GCL+IPL 1.931±0.002 1.927±0.002 1.929±0.002
GCC 3.937±0.017* 3.985±0.016* 4.003±0.017
INL 2.018±0.004‡ 2.031±0.004* 2.040±0.004
OPL 1.480±0.002 1.475±0.002 1.480±0.002
ONL+IS 1.757±0.008 1.765±0.007 1.770±0.008
OS 1.711±0.004 1.717±0.004 1.716±0.005
RPE 1.659±0.002 1.657±0.002 1.660±0.002
Parafoveal Region
RNFL 1.447±0.011* 1.462±0.011 1.492±0.012*
GCL+IPL 1.571±0.003 1.568±0.002 1.565±0.003
GCC 3.017±0.011 3.029±0.010 3.057±0.011*
INL 1.670±0.002 1.673±0.002 1.674±0.002
OPL 1.514±0.002* 1.505±0.002‡ 1.507±0.002
ONL+IS 1.785±0.007 1.793±0.006 1.799±0.007
OS 1.699±0.005 1.708±0.005 1.707±0.005
RPE 1.674±0.002 1.672±0.002 1.672±0.002
Perifoveal Region
RNFL 1.461±0.005 1.459±0.005 1.468±0.006
GCL+IPL 1.612±0.002‡ 1.605±0.002 1.598±0.003*
INL 3.072±0.005 3.063±0.005 3.067±0.005
OPL 1.681±0.002* 1.684±0.002* 1.683±0.002
ONL+IS 1.522±0.002* 1.516±0.002 1.515±0.002
OS 1.796±0.006* 1.808±0.005* 1.814±0.006
RPE 1.692±0.004 1.706±0.003 1.708±0.004
GCC 1.676±0.002 1.673±0.002 1.674±0.002
Abbreviations: SD (standard deviation); H (Healthy subjects group); MSON- (eyes of patients with multiple sclerosis without optic neuritis in medical history); MSON+ (eyes of patients with multiple sclerosis with optic neuritis in medical history); GCC (ganglion cell complex. the RNFL and GCL+IPL layers together)
*0.001<p<0.05 and
‡p<0.001 (Mixed-model analysis ANOVA) between H and MSON+ (see H column). H and MSON- (see MSON- column) and between MSON- and MSON + (see MSON+ column)
doi:10.1371/journal.pone.0143711.t004
Table 5. Distribution statistics of the layer index (a.u) of intraretinal layers by study group, represented as means±SD.
Layer index Healthy MSON- MSON+
H vs. MSON+ H vs. MSON- MSON+ vs MSON-
Across All Macular Regions
RNFL 11.06±0.25‡ 9.28±0.25‡ 7.90±0.27‡
GCL+IPL 13.49±0.33‡ 11.32±0.32‡ 9.84±0.34‡
GCC 24.56±0.55‡ 20.62±0.53‡ 17.70±0.57‡
INL 4.37±0.13* 3.97±0.13* 3.98±0.14
OPL 6.39±0.20* 5.84±0.20 5.57±0.21
ONL+IS 7.49±0.23* 6.67±0.22* 6.83±0.24
OS 6.05±0.14 5.70±0.13 5.67±0.14
RPE 6.47±0.08 6.55±0.07 6.45±0.08
Foveolar Region
ONL+IS 9.03±0.32* 7.88±0.31* 7.87±0.34
OS 6.55±0.13* 6.04±0.12* 6.16±0.13
RPE 7.85±0.11* 7.9±0.11* 7.67±0.11
Foveal Region
RNFL 5.28±0.18* 4.82±0.17 4.49±0.19
GCL+IPL 13.98±0.40‡ 12.25±0.38* 10.63±0.41‡
GCC 19.25±0.55‡ 17.06±0.53* 15.13±0.57*
INL 4.45±0.15 4.09±0.15 4.04±0.16
OPL 9.19±0.35* 8.41±0.34 7.59±0.37
ONL+IS 8.51±0.27 7.55±0.26* 7.73±0.28
OS 6.38±0.18 6.07±0.17 6.05±0.19
RPE 6.73±0.09 6.81±0.09 6.64±0.10
Parafoveal Region
RNFL 9.22±0.21‡ 7.92±0.21‡ 6.86±0.22‡
GCL+IPL 15.94±0.41‡ 13.36±0.39‡ 11.60±0.43‡
GCC 25.17±0.58‡ 21.29±0.56‡ 18.43±0.61‡
INL 4.83±0.15 4.43±0.15 4.46±0.16
OPL 6.12±0.22 5.61±0.21 5.55±0.23
ONL+IS 7.65±0.24 6.84±0.24* 7.05±0.26
OS 5.88±0.19 5.63±0.18 5.64±0.20
RPE 6.24±0.09 6.28±0.08 6.17±0.09
Perifoveal Region
RNFL 13.39±0.32‡ 10.96±0.32‡ 9.14±0.34‡
GCL+IPL 12.41±0.32‡ 10.27±0.31‡ 8.93±0.33‡
GCC 25.81±0.60‡ 21.24±0.57‡ 18.02±0.62‡
INL 4.17±0.12* 3.79±0.12* 3.81±0.13
OPL 4.86±0.15* 4.48±0.14 4.45±0.15
ONL+IS 6.64±0.21 5.94±0.21* 6.11±0.23
OS 5.83±0.14 5.47±0.13 5.46±0.14
RPE 6.21±0.08 6.33±0.08 6.26±0.08
Abbreviations: SD (standard deviation); H (Healthy subjects group); MSON- (eyes of patients with multiple sclerosis without optic neuritis in medical history); MSON+ (eyes of patients with multiple sclerosis with optic neuritis in medical history); GCC (ganglion cell complex. the RNFL and GCL+IPL layers together)
*0.001<p<0.05 and
‡p<0.001 (Mixed-model analysis ANOVA) between H and MSON+ (see H column). H and MSON- (see MSON- column) and between MSON- and MSON + (see MSON+ column)
doi:10.1371/journal.pone.0143711.t005
Table 6. Distribution statistics of the total reflectance (dB) with compensation to RPE layer reflectance of intraretinal layers by study group, repre- sented as means±SD.
Total reflectance Healthy MSON- MSON+
H vs. MSON+ H vs. MSON- MSON+ vs MSON-
Across All Macular Regions
RNFL 21.52±0.26‡ 19.90±0.26‡ 18.54±0.28‡
GCL+IPL 22.50±0.29‡ 20.76±0.28‡ 19.62±0.30‡
GCC 45.72±0.53‡ 42.14±0.51‡ 39.4±0.56‡
INL 13.03±0.30 12.10±0.29* 12.17±0.31
OPL 14.30±0.29* 13.52±0.28* 13.48±0.30
ONL+IS 16.98±0.32 15.99±0.31* 16.28±0.34
OS 15.89±0.21* 15.3±0.20* 15.20±0.22
RPE 16.43±0.10 16.58±0.09 16.45±0.10
Foveolar Region
ONL+IS 19.18±0.34* 18.06±0.33* 18.05±0.36
OS 16.55±0.17* 15.86±0.17* 16.00±0.18
RPE 18.11±0.12 18.19±0.12 17.93±0.13
Foveal Region
RNFL 14.87±0.32* 14.01±0.31 13.41±0.33
GCL+IPL 23.30±0.27‡ 22.11±0.27* 20.92±0.29‡
GCC 38.16±0.56‡ 36.12±0.54* 34.33±0.59*
INL 13.29±0.30 12.57±0.29 12.50±0.32
OPL 19.42±0.36* 18.61±0.35 17.82±0.38
ONL+IS 18.84±0.29 17.85±0.28* 18.08±0.31
OS 16.41±0.25 15.99±0.25 15.94±0.27
RPE 16.88±0.11 17.01±0.11 16.82±0.12
Parafoveal Region
RNFL 19.88±0.26‡ 18.55±0.25‡ 17.34±0.27‡
GCL+IPL 24.58±0.26‡ 23.05±0.25‡ 21.80±0.27‡
GCC 44.47±0.49‡ 41.61±0.47‡ 39.11±0.51‡
INL 14.14±0.28 13.44±0.27 13.47±0.29
OPL 16.17±0.30 15.41±0.29 15.35±0.32
ONL+IS 18.12±0.29 17.23±0.29* 17.48±0.31
OS 15.86±0.28 15.52±0.27 15.47±0.30
RPE 16.41±0.11 16.5±0.11 16.37±0.12
Perifoveal Region
RNFL 23.20±0.29‡ 21.34±0.28‡ 19.83±0.30‡
GCL+IPL 22.50±0.29‡ 20.76±0.28‡ 19.62±0.30‡
GCC 45.72±0.53‡ 42.14±0.51‡ 39.40±0.56‡
INL 13.03±0.30 12.10±0.29* 12.17±0.31
OPL 14.30±0.29* 13.52±0.28* 13.48±0.30
ONL+IS 16.98±0.32 15.99±0.31* 16.28±0.34
OS 15.89±0.21* 15.30±0.20* 15.20±0.22
RPE 16.43±0.10 16.58±0.09 16.45±0.10
Abbreviations: SD (standard deviation); H (Healthy subjects group); MSON- (eyes of patients with multiple sclerosis without optic neuritis in medical history); MSON+ (eyes of patients with multiple sclerosis with optic neuritis in medical history); GCC (ganglion cell complex. the RNFL and GCL+IPL layers together)
*0.001<p<0.05 and
‡p<0.001 (Mixed-model analysis ANOVA) between H and MSON+ (see H column). H and MSON- (see MSON- column) and between MSON- and MSON + (see MSON+ column)
doi:10.1371/journal.pone.0143711.t006