doi:10.4236/jbise.2011.410082 Published Online October 2011 (http://www.SciRP.org/journal/jbise/).
Investigation of changes in thickness and reflectivity from layered retinal structures of healthy and diabetic eyes with optical coherence tomography
Wei Gao1, Erika Tátrai2, Veronika Ölvedy2, Boglárka Varga2, Lenke Laurik2, Anikó Somogyi3, Gábor Márk Somfai2, Delia Cabrera DeBuc1
1Bascom Palmer Eye Institute, University of Miami Miller School of Medicine, Miami, USA;
2Semmelweis University, Department of Ophthalmology, Budapest, Hungary;
3Semmelweis University, 2nd Department of Internal Medicine, Budapest, Hungary.
Email: dcabrera2@med.miami.edu
Received 2 June 2011; revised 15 September 2011; accepted 26 September 2011.
ABSTRACT
OCT is usually employed for the measurement of retinal thickness. However, coherent reflected light carries more information characterizing the optical properties of tissue. Therefore, optical property changes may provide further information regarding cellular layers and early damage in ocular diseases.
We investigated the possibility of OCT in detecting changes in the optical backscattered signal from lay- ered retinal structures. OCT images were obtained from diabetic patients without retinopathy (DM, n = 38 eyes) or mild diabetic retinopathy (MDR, n = 43 eyes) and normal healthy subjects (n = 74 eyes). The thickness and reflectivity of various layered struc- tures were assessed using a custom-built algorithm.
In addition, we evaluated the usefulness of quantify- ing the reflectivity of layered structures in the detec- tion of retinal damage. Generalized estimating equa- tions considering within-subject inter-eye relations were used to test for differences between the groups.
A modified p value of <0.001 was considered statisti- cally significant. Receiver operating characteristic (ROC) curves were constructed to describe the abil- ity of each parameter to discriminate between the eyes of DM, MDR and healthy eyes. Thickness values of the GCL + IPL and OPL showed a significant de- crease in the MDR eyes compared to controls. Sig- nificant decreases of total reflectance average values were observed in all layers in the MDR eyes com- pared with controls. The highest AUROC values es- timated for the total reflectance were observed for the GCL + IPL, OPL and OS when comparing MDR eyes with controls. Total reflectance showed a better discriminating power between the MDR eyes and
healthy eyes compared to thickness values. Our re- sults suggest that the optical properties of the in- traretinal layers may provide useful information to differentiate pathological from healthy eyes. Further research is warranted to determine how this ap- proach may be used to improve diagnosis of early retinal neurodegeneration.
Keywords:Optical Coherence Tomography; Rerina;
Diabetic Retinopathy; Segmentation; Image Processing
1. INTRODUCTION
Optical coherence tomography (OCT) is an optical im- aging technique that has high axial resolution and high dynamic range by the use of a broadband light source and heterodyne detection technique [1]. Along with im- aging, OCT can also be used for quantitative analysis of tissue optical properties as the OCT signal depends on the total attenuation and backscattering coefficients [2].
This technique provides information on the optical properties of microstructures such as reflectance, scat- tering coefficient, absorption coefficient, refractive index and birefringence. OCT has been shown to be appropri- ate for non-invasive two-dimensional imaging of micro- structures underneath the tissue surface [3,4]. In addition, OCT has been used to measure optical properties of tis- sues, to derive spectroscopic information from tissue phantoms and to investigate the optical clearing of soft tissue and whole blood [5-8]. Hammer et al. investigated the optical scattering of four posterior eye segments from bovine/porcine samples [9,10].
From the clinical point of view, OCT has also been used to diagnose and follow-up ocular disorders. For example, optic nerve head disorders and macular dis-
eases involving both inner and outer cellular layers have been extensively investigated with this technology [11].
OCT is usually employed for the measurement of retinal thickness. Particularly, the quantification of structural changes of the various cellular layers of the retina with OCT has helped to assess treatment efficacy and identify potential markers for monitoring the disease progression.
However, coherent reflected light carries more informa- tion characterizing the optical properties of tissue. The- refore, the changes in tissue optical properties may pro- vide further information regarding cellular layers and early damage in ocular diseases.
It is known that diabetes leads to a thinning of the macula preceding the onset of severe diabetic retinopa- thy, which is most possibly attributed to neurodegenera- tion [12]. We have shown previously that the thinning of the retina is due to a loss of the inner retina, namely the ganglion cells [13] which is in accordance with the find- ings of other [14].
Our aim was to investigate the possibility of OCT to detect changes in the optical backscattered signal (i.e.
reflectivity) from layered retinal structures. OCT images were obtained from diabetic and normal healthy subjects and the thickness and reflectivity of various layered structures were assessed using a custom-built algorithm.
In addition, we evaluated the usefulness of quantifying the reflectivity of layered structures in the detection of retinal damage.
2. MATERIALS AND METHODOLOGY
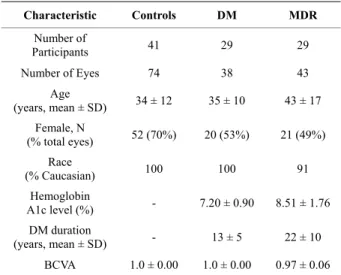
2.1. Data CollectionThe study conducted in this paper was approved by the Institutional Review Boards in our institutions. The re- search adhered to the tenets set forth in the declaration of Helsinki. Informed consent was obtained from each subject. OCT examination was performed in healthy and diabetic eyes with and without retinopathy. A total of 74 healthy eyes (34 ± 12 yr, 52 female, 22 male), 38 eyes with type 1 diabetes mellitus (DM) with no retinopathy (35 ± 10 yr, 20 female, 18 male) and 43 eyes with mild diabetic retinopathy (MDR, 43 ± 17 yr, 21 female, 22 male) on biomicroscopy were included in the study (see Table 1).
2.2. OCT System and Measurements
The OCT system (Stratus OCT, Carl Zeiss Meditec, Dublin, California) used in this study employs a broad- band light source, delivering an output power of 1 mW at the central wavelength of 820 nm with a bandwidth of 25 nm. The light source yields 12 µm axial resolution in free space that determines the imaging axial resolution of the system. A cross-sectional image is achieved by the combination of axial reflectance while the sample is
Table 1. Characteristics of study participants. Abbreviations:
SD = standard deviation.
Characteristic Controls DM MDR Number of
Participants 41 29 29 Number of Eyes 74 38 43
Age
(years, mean ± SD) 34 ± 12 35 ± 10 43 ± 17 Female, N
(% total eyes) 52 (70%) 20 (53%) 21 (49%) Race
(% Caucasian) 100 100 91 Hemoglobin
A1c level (%) - 7.20 ± 0.90 8.51 ± 1.76 DM duration
(years, mean ± SD) - 13 ± 5 22 ± 10 BCVA 1.0 ± 0.00 1.0 ± 0.00 0.97 ± 0.06
scanned laterally. All Stratus OCT’ study cases were obtained using the Macular Thickness Map (MTM) pro- tocol. This protocol consists of six radial scan lines cen- tered on the fovea, each having a 6mm transverse length.
In order to obtain the best image quality, focusing and optimization settings were controlled and scans were accepted only if the signal strength (SS) was above 6 (preferably 9 - 10) [15]. Scans with foveal decentration (i.e. with center point thickness SD > 10%) were repeated.
2.3. OCT Image and Data Analysis
Macular radial line scans of the retina for each case were exported with the export feature available in the Stratus OCT device and analyzed using a custom-built software for OCT image analysis [16,17]. Segmentation errors were manually corrected using the manual correction tool provided by OCTRIMA. The OCTRIMA method- ology essentially provides dual functionality by com- bining image enhancement and denoising of OCT im- ages along with automatic segmentation of the various cellular layers of the retina. Moreover, OCTRIMA has the capability to perform calculations based on measured values of corrected thickness and reflectance of the various cellular layers of the retina and the whole mac- ula. The OCTRIMA software enables the segmentation of 7 cellular layers of the retina on OCT images based on their optical densities: the retinal nerve fiber layer (RNFL), the ganglion cell and inner plexiform layer complex (GCL + IPL), the inner nuclear layer (INL), the outer plexiform layer (OPL), the outer nuclear layer and inner photoreceptor segment (ONL + IS), outer photore- ceptor segment (OS) and retinal pigment epithelium (RPE) (see Figure 1). We have previously shown a high reliability and reproducibility of OCTRIMA software using Stratus OCT data from normal healthy eyes [17,
18]. As in some Fourier-domain OCT (FD-OCT) sys- tems, OCTRIMA facilitates the total retinal thickness calculations between the ILM and the inner boundary of the second hyperreflective band, which has been attrib- uted to the outer segment/retinal pigment epithelium (OS/RPE) junction in agreement with histological stud- ies [19-21].
Lateral coordinates of the blood vessel shadows were first extracted by using a blood vessel shadowgram technique [22]. Then, these shadows were removed in each OCT image (see Figure 2) before calculating re- flectivity values. Average values of total reflectance and thickness per intraretinal layer were calculated. Total reflectance values included average values of relative internal reflectivity (NRIR: reflectivity normalized to the maximum value within the whole retina) and reflectivity with normalization to the RPE reflectance (NRPE). Total reflectance values were converted to decibels (dB = 10 ×
log10 [TR]). Generalized estimating equations consider- ing within-subject inter-eye relations were used to test for differences between the groups. A modified p value of <0.001 was considered statistically significant. Re- ceiver operating characteristic (ROC) curves were con- structed to describe the ability of each parameter to dis- criminate between the eyes of diabetic patients without retinopathy with diabetic patients with retinopathy and healthy eyes. It is worth to note that an area under curve (AUROC) of 1.0 indicates perfect discrimination, while an AUROC of 0.5 indicates no discrimination. For the statistical analyses SPSS Statistics 17.0 software was used.
3. RESULTS
Thickness values of the GCL + IPL and OPL showed a significant decrease in the MDR eyes compared to con- trols (see Table 2). Average values in other layers (except
(a)
(b)
Figure 1. Macular image segmentation using OCTRIMA. (a) The image of a healthy macula scanned by Stratus OCT.
(b) The same OCT scan processed with OCTRIMA. Abbreviations: Ch, choroid; GCL + IPL, ganglion cell layer and inner plexiform layer complex; INL, inner nuclear layer; ONL + IS, combined outer nuclear layer and inner segment of photoreceptors; OS, outer segment of photoreceptors; OPL, outer plexiform layer; RNFL, retinal nerve fiber layer;
RPE, retinal pigment epithelial layer; V, vitreous. Note that OCTRIMA measures the thickness of the total retina be- tween the inner limiting membrane and the inner boundary of the photoreceptor outer segment/RPE junction. The thickness of the combined ONL + IS structure is measured between the outer boundary of OPL and the inner bound- ary of the photoreceptor outer segment/RPE junction.
(a) (b) (c)
Figure 2. Image denoising and segmentation. (a) OCT raw image. (b) OCT image showing segmentation results after removal of speckle noise. (c) OCT filtered image showing the location of the extracted blood vessel boundaries using the shawdogram technique.
Table 2. Distribution statistics of thickness (mean ± SD) values by study group.
Thickness (µm) Controls DM MDR RNFL 42.02 ± 2.35 41.19 ± 2.45 41.39 ± 3.28 GCL + IPL 78.30 ± 4.61 75.41 ± 5.70 71.80 ± 8.89‡ INL 35.02 ± 1.78 35.74 ± 2.29 35.05 ± 2.99 OPL 41.30 ± 2.71 39.88 ± 5.19 36.07 ± 3.77‡ ONL + IS 86.41 ± 5.61 85.55 ± 8.12 88.40 ± 9.19 OS 16.30 ± 3.27 17.98 ± 2.96 14.60 ± 2.07 RPE 12.71 ± 1.49 13.78 ± 1.34 12.76 ± 1.18
‡p < 0.001 between Controls and MDR (Generalized estimating equations).
the RPE and ONL + IS) showed a tendency towards thinning without reaching significance as compared to DM and normal healthy eyes. Significant decreases of total reflectance average values using both NRIR and NRPE normalizations were observed in all layers in the MDR eyes compared with controls (except RPE, see Tables 3 and 4).
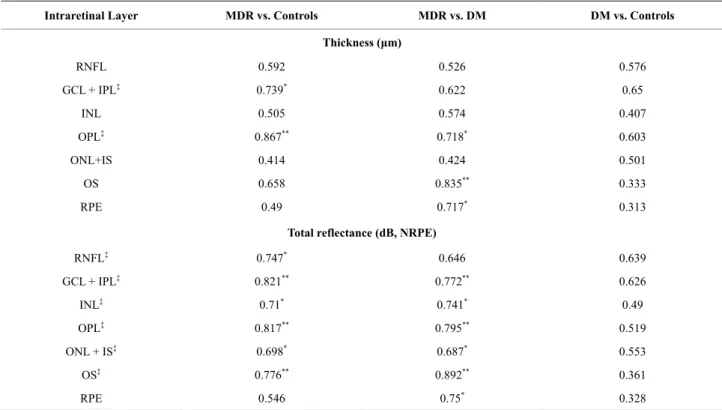
The ROC analysis was performed for thickness and total reflectance (NRIR & NRPE) average values of each intraretinal layer (see Figure 3). The AUROC values are shown in Tables 5 by study groups. Detailed ROC analysis results for variables that showed significant difference between the groups are also shown in Tables 6 and 7. The highest values estimated for the total re- flectance (NRIR & NRPE) were observed for GCL + IPL, OPL and OS when comparing MDR with healthy normal eyes. The highest values estimated for the thick- ness were observed for GCL + IPL and OPL when com- paring MDR with healthy normal eyes. Total reflectance showed a better discriminating power between the MDR eyes and healthy eyes.
4. DISCUSSION
OCT is usually employed for the measurement of retinal thickness. However, coherent reflected light carries more information characterizing the optical properties of tis- sue. Therefore, optical property changes may provide further information regarding cellular layers and early damage in ocular diseases. We investigated the possibil- ity of OCT in detecting early changes in the optical backscattered signal from layered retinal structures in diabetic eyes. In this study, the total reflectance dis- played the most powerful diagnostic utility for detecting early changes in the diabetic retina.
Quantitative OCT-based measures have become an essential part of diabetic macular assessment and man- agement during the last years. OCT images can be used to understand the early histological changes of the macula
Table 3. Distribution statistics of total reflectance (NRIR, mean ± SD) values by study group.
Total Reflectance
(dB, NRIR) Controls DM MDR
RNFL 19.13 ± 1.23 18.54 ± 1.15 17.55 ± 1.46‡ GCL + IPL 20.21 ± 1.75 19.66 ± 1.47 17.88 ± 1.73‡ INL 10.08 ± 2.14 10.15 ± 1.87 8.46 ± 1.91 OPL 13.33 ± 2.19 13.07 ± 2.46 10.62 ± 1.74‡ ONL+IS 14.93 ± 2.23 14.54 ± 1.81 13.34 ± 2.13 OS 13.08 ± 1.32 13.52 ± 0.98 11.64 ± 0.94‡ RPE 13.38 ± 0.92 13.82 ± 0.92 13.01 ± 0.78
‡p < 0.001 between Controls and MDR (Generalized estimating equations).
Table 4. Distribution statistics of total reflectance (NRPE) values by study group.
Total Reflectance
(dB, NRPE) Controls DM MDR
RNFL 22.58 ± 1.12 22.06 ± 1.02 21.42 ± 1.44‡ GCL + IPL 23.44 ± 1.50 22.97 ± 1.26 21.45 ± 1.66 INL 13.27 ± 1.87 13.44 ± 1.57 12.00 ± 1.70 OPL 16.25 ± 1.94 16.14 ± 2.12 13.93 ± 1.57‡ ONL + IS 17.86 ± 1.99 17.59 ± 1.56 16.60 ± 2.03 OS 16.11 ± 1.12 16.64 ± 0.98 15.00 ± 0.95‡ RPE 16.34 ± 0.76 16.85 ± 0.70 16.23 ± 0.57
‡p < 0.001 between Controls and MDR (Generalized estimating equations).
in diabetes by comparing the thickness and reflectance measurements of the various cellular layers of the retina in diabetic patients with minimal DR with the thickness and reflectance measurements in normal healthy subjects and diabetic patients who have no retinopathy. This par- ticular comparison is especially important in the early stages of DR when the structural changes are not yet evident with slit-lamp biomicroscopy or angiographi- cally [15,20]. To date, all studies reporting retinal changes associated to diabetes have only used thickness measurements [12]. These studies have generated con- tradictory results and conclusions. Particularly, accord- ing to the first reports with the use of OCT it seemed that thickening of the retina may be an early sign of diabetic changes in eyes with no significant macular edema [23].
For example, in the study by Schaudig et al. (2000) an increased retinal thickness of the macula in the superior nasal quadrant was observed in patients with DR as compared to patients without DR and controls [24].
Oshitari et al. (2008) showed that the macula was thicker and RNFL was thinner at the early stages of DR, and
(a) (b)
(c) (d)
Figure 3. Receiver operating characteristic (ROC) curves for the detection of early diabetic retinopathy using thickness and total reflectance (NRPE) as predictor variables. (a) Thickness (MDR vs. Controls); (b) Total reflectance (NRPE, MDR vs. Controls); (c) Thickness (MDR vs. DM); (d) Total reflectance (NRPE, MDR vs. DM). Areas under the ROC curves for total reflectance (NRPE) were significantly greater than that for the thickness analysis (P ≤ 0.05).
Table 5. AUROC values of best diagnostic parameters by study group.
Intraretinal Layer MDR vs. Controls MDR vs. DM DM vs. Controls
Thickness (μm)
RNFL 0.592 0.526 0.576
GCL + IPL‡ 0.739* 0.622 0.65
INL 0.505 0.574 0.407
OPL‡ 0.867** 0.718* 0.603
ONL+IS 0.414 0.424 0.501
OS 0.658 0.835** 0.333
RPE 0.49 0.717* 0.313
Total reflectance (dB, NRPE)
RNFL‡ 0.747* 0.646 0.639
GCL + IPL‡ 0.821** 0.772** 0.626
INL‡ 0.71* 0.741* 0.49
OPL‡ 0.817** 0.795** 0.519
ONL + IS‡ 0.698* 0.687* 0.553
OS‡ 0.776** 0.892** 0.361
RPE 0.546 0.75* 0.328
* 0.7≤ AUROC≤0.8, **0.8 ≤ AUROC, ‡p < 0.001 between Controls and MDR (ANOVA followed by Newman-Keuls post hoc analysis).
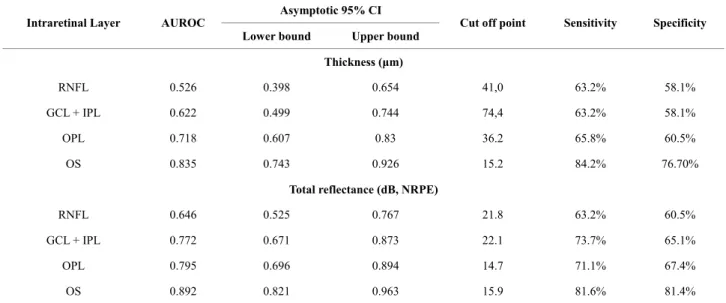
Table 6. Cutoff values derived from the ROC analyses for variables that showed significant difference between the MDR group and Controls.
Asymptotic 95% CI Intraretinal Layer AUROC
Lower bound Upper bound
Cut off point Sensitivity Specificity
Thickness (μm)
RNFL 0.592 0.477 0.707 41.0 66.2% 58.1%
GCL + IPL 0.739 0.637 0.841 75.4 74.3% 65.1%
OPL 0.867 0.786 0.949 38.9 83.8% 83.7%
OS 0.658 0.558 0.757 14.6 67.6% 58.1%
Total reflectance (dB, NRPE)
RNFL 0.747 0.654 0.841 22.1 73.0% 67.4%
GCL + IPL 0.821 0.741 0.901 22.7 77.0% 74.4%
OPL 0.817 0.739 0.894 15 77.0% 76.7%
OS 0.776 0.69 0.861 15.5 71.6% 69.8%
Table 7. Cutoff values derived from the ROC analyses for variables that showed significant difference between the MDR and DM groups.
Asymptotic 95% CI Intraretinal Layer AUROC
Lower bound Upper bound Cut off point Sensitivity Specificity Thickness (μm)
RNFL 0.526 0.398 0.654 41,0 63.2% 58.1%
GCL + IPL 0.622 0.499 0.744 74,4 63.2% 58.1%
OPL 0.718 0.607 0.83 36.2 65.8% 60.5%
OS 0.835 0.743 0.926 15.2 84.2% 76.70%
Total reflectance (dB, NRPE)
RNFL 0.646 0.525 0.767 21.8 63.2% 60.5%
GCL + IPL 0.772 0.671 0.873 22.1 73.7% 65.1%
OPL 0.795 0.696 0.894 14.7 71.1% 67.4%
OS 0.892 0.821 0.963 15.9 81.6% 81.4%
concluded that these changes may be related to both the neuronal and vascular abnormalities [25]. Another report by Asefzadeh et al. (2008) found that macular and foveal thickness was significantly thinner with longer duration of disease in subjects with no or mild DR [26]. Pires et al. (2002) also suggested that localized areas of retinal thickening occur in diabetes in the initial stages of reti- nopathy [27].
Our results suggest that the RNFL, GCL + IPL com- plex, OPL and OS are more susceptible to initial damage when comparing MDR with control eyes. Particularly, the trend observed for the thickness and total reflectance of the RNFL and GCL + IPL in MDR eyes might be
associated with pathological metabolic changes in the retina and may reflect neurodegenerative changes in the diabetic retina. These findings also have possible impli- cations for the early detection of macular damage in dia- betes. Because the macular region is rich in retinal gan- glion cells, it could be suggested that diabetic damage of this central region might occur early in the disease proc- ess. In fact, animal models of DR show significant loss of macular ganglion cells [28-32]. Interestingly, the thickness and total reflectance of the OPL in MDR eyes was significantly reduced compared with similar meas- ures in normal healthy eyes. Previous studies have shown that not only retinal pericytes and endothelial
cells are susceptible to hyperglycemia, but neuroglial elements of the retina are also involved in the retinal damage caused by diabetes [28,33,34]. According to Barber and colleagues, apoptotic cells are likely to in- clude ganglion cells and other neurons in the retina (such as cells of the plexiform and nuclear layers) [28]. On the other hand, the highest AUROC values were obtained for the OS when comparing MDR with DM eyes. This particular result might suggest that diabetes also inflicts additional damage to the outer photoreceptor segment, which could be an early indication of visual function degeneration that could be used as an additional indica- tor to enable the early detection of diabetic retinal dam- age or disease progression.
In this study, the AUROC results showed a similar trend for both total reflectance including average values of reflectivity normalized to the maximum value within the whole retina (RIR) and reflectivity with normaliza- tion to the RPE reflectance (NRPE). This similar trend might rule out the dependence to the sensitivity of the direction of incidence of the light beam. Taking into ac- count the RPE layer apparently behaves like a diffuse reflector, an assumption that could be valid when the RPE is more or less flat, this layer could be fairly insen- sitive to the direction of incidence of the light beam.
Accordingly, our results appear not to be affected by the directionality of the light beam in the OCT system.
There are some potential shortcomings of our study.
Time-domain OCT technology has some limitations compared to the more advanced OCT technology. In addition, current OCT devices include different segmen- tation algorithms and methods for speckle noise removal.
Therefore, data analysis is influenced by special as- sumptions and technological specifications that are in place for each individual OCT device. Particularly, ul- trahigh resolution and spectral-domain technologies fa- cilitate a more precise delineation of the RPE and inner segment-outer segment junction of the macular photore- ceptors [18,21]. Although OCTRIMA is able to extract the RPE layer in data obtained with time domain OCT, there is much variability in the segmentation of the RPE outer boundary due to the lower resolution of deeper structures extracted by Stratus OCT [17]. Therefore, the use of advanced OCT devices will remove this short- coming and improve the reliability of RPE measure- ments. Future studies will benefit from higher resolution imaging; an increase in the size of the patient population studied will also be of importance.
5. CONCLUSIONS
The early results presented have shown this methodol- ogy could have the potential to differentiate diabetic eyes with early retinopathy from healthy eyes. Future
studies are needed to determine the accuracy, repeatabil- ity and full capability of this methodology with more OCT scans.
6. CONFLICT OF INTEREST
The University of Miami and Dr. Cabrera DeBuc hold a pending patent used in the study and have the potential for financial benefit from its future commercialization.
All other authors of the manuscript report no disclosures.
7. ACKNOWLEDGEMENTS
This study was supported in part by a Juvenile Diabetes Research Foundation grant (JDRF 2007-727), a NIH center grant P30-EY014801, Department of Defense (DOD-Grant#W81XWH-09-1-0675) and by an unrestricted grant to the University of Miami from Research to Prevent Blindness, Inc. The authors would like to express their gratitude to Dr.
Ádám Gy. Tabák (Department of Epidemiology & Public Health, Uni- versity College London, UK and 1st Department of Internal Medicine, Budapest, Hungary) for his expert statistical advice.
REFERENCES
[1] Huang, D., Swanson, E.A., Lin, C.P., Schuman, J.S., Stinson, W.G., Chang, W., Hee, M.R., Flotte, T., Gregory, K. and Puliafito, C.A. (1991) Optical coherent tomogra- phy. Science, 254, 1178-1181.
doi:/10.1126/science.1957169
[2] Schmitt, J.M., Knuttel, A. and Bonner, R.F. (1993) Mea- surement of optical properties of biological tissues by low-coherence reflectometry. Applied Optics, 32, 6032- 6042.doi:/10.1364/AO.32.006032
[3] Tearney, G.J., Brezinski, M.E., Bouma, B.E., Boppart, S.A. and Fujimoto, J.G. (1997) In vivo endoscopic optical biopsy with optical coherence tomography. Science, 276, 2037-2039.doi:/10.1126/science.276.5321.2037
[4] Wang, R.K. and Elder, J.B. (2002) High resolution to- mographic imaging of soft biological tissues. The Inter- national Journal Laser Physics, 12, 661-616.
[5] Schmitt, J.M., Xiang, S.H. and Yung, K.M. (1998) Dif- ferential absorption imaging with optical coherence to- mography. Journal of the Optical Society of America A, 15, 2288-2296.doi:/10.1364/JOSAA.15.002288
[6] Wang, R.K. (2000) Modelling optical properties of soft tissue by fractal distribution of scatters. Journal of Mod- ern Optics, 47, 103-120.
[7] Wang, R.K. and Elder, J.B. (2002) Propylene glycol as a contrasting medium for optical coherence tomography to image gastrointestinal tissues. Lasers in Surgery and Medicine, 30, 201-208.doi:/10.1002/lsm.10013
[8] Tuchin, V.V., Xu, X. and Wang, R.K. (2002) Dynamic optical coherence tomography in studies of optical clear- ing, sedimentation, and aggregation of immersed blood.
Applied Optics, 41, 258-271.doi:/10.1364/AO.41.000258 [9] Hammer, M., Roggan, A., Schweitzer, D. and Muller, G.
(1995) Optical properties of ocular fundus tissues—an in vitro study using the double-integrating-sphere technique and inverse Monte Carlo simulation. Physics in Medicine and Biology, 40, 963-978.
doi:/10.1088/0031-9155/40/6/001
[10] Hammer, M., Schweitzer, D., Thamm, E. and Kolb, A.
(2000) Optical properties of ocular fundus tissues deter- mined by optical coherence tomography. Optics Commu- nications, 186, 149-153.
doi:/10.1016/S0030-4018(00)01054-3
[11] Schuman, J.S., Puliafito, C.A. and Fujimoto, J.G. (2006) Everyday OCT: Handbook for clinicians and technicians.
Slack Inc., Thorofare.
[12] Wilkinson C.P., Ferris F.L. III, Klein R.E., Lee P.P., A- gardh C.D., Davis M., Dills D., Kampik A., Pararajase- garam R. and Verdaguer J.T. (2003) Global Diabetic Re- tinopathy Project Group. Proposed international clinical diabetic retinopathy and diabetic macular edema disease severity scales. Ophthalmology, 110, 1677-1682.
doi:/10.1016/S0161-6420(03)00475-5
[13] DeBuc, D.C., Somfai, G.M. (2010) Early detection of retinal thickness changes in diabetes using optical co- herence tomography. Medical science monitor interna- tional medical journal of experimental and clinical re- search, 16, MT15-T21.
[14] van Diji, H.W., Kok., P.H.B., Garvin, M., Sonka, M., De- Vries, J.H., Michels, R.P.J., van Velthoven, M.E.J., Sch- lingemann, R.O., Verbrakk, F.D. and Abramoff, M.D.
(2009) Selective loss of inner retinal layer thickness in type 1 diabetic patients with minimal diabetic retinopathy.
Investigative Ophthalmology and Visual Science, 50, 3404-3409.doi:/10.1167/iovs.08-3143
[15] Somfai, G.M., Salinas, H.M., Puliafito, C.A. and Fer- nandez, D.C. (2007) Evaluation of potential image ac- quisition pitfalls during optical coherence tomography and their influence on retinal image segmentation. Jour- nal Biomedical Optics, 12, 041209.
doi:/10.1117/1.2774827
[16] DeBuc, D.C., Salinas, H.M. and Puliafito, C.A. (2005) Automated detection of retinal layer structures on optical coherence tomography images. Optics Express, 13, 10200-10216.doi:/10.1364/OPEX.13.010200
[17] DeBuc, D.C., Somfai, G.M., Ranganathan, S., Tátrai, E., Ferencz, M. and Puliafito, C.A. (2009) Reliability and reproducibility of macular segmentation using a custom- built optical coherence tomography retinal image analy- sis software. Journal Biomedical Optics, 14, 064023.
doi:/10.1117/1.3268773
[18] DeBuc, D.C., Salinas, H.M., Ranganathan, S., Gao, W., Shen, M., Wang, J., Tátrai, E., Somfai, G.M. and Puliafito, C.A. (2010) Improving image segmentation performance and quantitative analysis via a computer-aided grading methodology for optical coherence tomography retinal image analysis. Journal Biomedical Optics, 15, 046015.
doi:/10.1117/1.3470116
[19] Ahlers, C., Simader, C., Geitzenauer, W., Stock, G., Stet- son, P., Dastmalchi, S. and Schmidt-Erfurth, U. (2008) Automatic segmentation in three-dimensional analysis of fibrovascular pigment epithelial detachment using high- definition optical coherence tomography. British Journal of Ophthalmology, 92, 197-203.
doi:/10.1136/bjo.2007.120956
[20] Hageman, G.S., Marmor, M.F., Yao, X.Y. and Johnson, L.V. (1995) The interphotoreceptor matrix mediates pri- mate retinal adhesion. Archives of Ophthalmology, 113, 655-660.
[21] Costa, R.A., Skaf, M., Melo Jr., L.A.S., Calucci, D., Cardillo, J.A., Castro, J.C., Huang, D. and Wojtkowski, M. (2006) Retinal assessment using optical coherence tomography. Progress in Retinal and Eye Research, 25, 325-353.doi:/10.1016/j.preteyeres.2006.03.001
[22] Wehbe, H., Ruggeri, M., Jiao, S., Gregori, G., Puliafito, C.A. and Zhao, W. (2007) Automatic retinal blood flow calculation using spectral domain optical coherence to- mography. Optical Express, 15, 15193-15206.
doi:/10.1364/OE.15.015193
[23] Ozdek, S.C., Erdinc, M.A., Gurelik, G., Aydin, B., Ba- hceci, U., Hasanreisoglu, B. (2005) Optical coherence to- mographic assessment of diabetic macular edema: Com- parison with fluorescein angiographic and clinical find- ings. Ophthalmologica, 219, 86-92.
doi:/10.1159/000083266
[24] Schaudig, U.H., Glaefke, C., Scholz, F. and Richard, G.
(2000) Optical coherence tomography for retinal thick- ness measurement in diabetic patients without clinically significant macular edema. Ophthalmic Surgery, Lasers and Imaging, 31, 182-186.
[25] Oshitari, T., Hanawa, K. and Adachi-Usami, E. (2009) Changes of macular and RNFL thicknesses measured by Stratus OCT in patients with early stage diabetes. Eye, 23, 884-889.doi:/10.1038/eye.2008.119
[26] Asefzadeh, B., Fisch, B.M., Parenteau, C.E. and Cava- llerano, A.A. (2008) Macular thickness and systemic markers for diabetes in individuals with no or mild dia- betic retinopathy. Clinical and Experimental Ophthal- mology, 36, 455-463.
doi:/10.1111/j.1442-9071.2008.01769.x
[27] Pires, I., Bernardes, R.C., Lobo, C.L., Soares, M.A. and Cunha-Vaz, J.G. (2002) Retinal thickness in eyes with mild nonproliferative retinopathy in patients with type 2 diabetes mellitus: Comparison of measurements obtained by retinal thickness analysis and optical coherence to- mography. Archives of Ophthalmology, 120, 1301-1306.
[28] Barber, A.J., Lieth, E., Khin, S.A., Antonetti, D.A., Bu- chanan, A.G. and Gardner, T.W. (1998) Neural apoptosis in the retina during experimental and human diabetes.
Early onset and effect of insulin. The Journal of Clinical Investigation, 102, 783-791.doi:/10.1172/JCI2425 [29] Park, S.H., Park, J.W., Park, S.J., Kim, K.Y., Chung, J.W.,
Chun, M.H. and Oh, S.J. (2003) Apoptotic death of pho- toreceptors in the streptozotocin-induced diabetic rat ret- ina. Diabetologia, 46, 1260-1268.
doi:/10.1007/s00125-003-1177-6
[30] Rungger-Brandle, E., Dosso, A.A. and Leuenberger, P.M.
(2000) Glial reactivity, an early feature of diabetic reti- nopathy. Investigative Ophthalmology and Visual Science, 41, 1971-1980.
[31] Zeng, X.X., Ng, Y.K. and Ling, E.A. (2000) Neuronal and microglial response in the retina of streptozotocin- induced diabetic rats. Visual Neuroscience, 17, 463-471.
doi:/10.1017/S0952523800173122
[32] Barber, A.J., Antonetti, D.A., Kern, T.S., Reiter, C.E.N., Soans, R.S., Krady, J.K., Levison, S.W., Gardner, T.W.
and Bronson, S.K. (2005) The Ins2Akita mouse as a model of early retinal complications in diabetes. Investi- gative Ophthalmology and Visual Science, 46, 2210-2218.
doi:/10.1167/iovs.04-1340
[33] Barber, A.J. (2003) A new view of diabetic retinopathy: A
neurodegenerative disease of the eye. Progress in Neu- ropsychopharmacology and Biological Psychiatry, 27, 283-290.doi:/10.1016/S0278-5846(03)00023-X
[34] Mizutani, M., Gerhardinger, C., Lorenzi, M. (1998) Mul- ler cell changes in human diabetic retinopathy. Diabetes, 47, 445-449.doi:/10.2337/diabetes.47.3.445